
Abstract
BACKGROUND AND PURPOSE: Anoxic brain injury is a result of prolonged hypoxia. We sought to describe the nonquantitative arterial spin-labeling perfusion imaging patterns of anoxic brain injury, characterize the relationship of arterial spin-labeling and DWI, and evaluate the normalized diffusion-to-perfusion ratio to differentiate patients with anoxic brain injury from healthy controls.
MATERIALS AND METHODS: We identified all patients diagnosed with anoxic brain injuries from 2002 to 2019. Twelve ROIs were drawn on arterial spin-labeling with coordinate-matched ROIs identified on DWI. Linear regression analysis was performed to examine the relationship between arterial spin-labeling perfusion and diffusion signal. Normalized diffusion-to-perfusion maps were generated using a custom-built algorithm.
RESULTS: Thirty-five patients with anoxic brain injuries and 34 healthy controls were identified. Linear regression analysis demonstrated a significant positive correlation between arterial spin-labeling and DWI signal. By means of a combinatory cutoff of slope of >0 and R2 of > 0.78, linear regression using arterial spin-labeling and DWI showed a sensitivity of 0.86 (95% CI, 0.71–0.94) and specificity of 0.82 (95% CI, 0.66–0.92) for anoxic brain injuries. A normalized diffusion-to-perfusion color map demonstrated heterogeneous ratios throughout the brain in healthy controls and homogeneous ratios in patients with anoxic brain injuries.
CONCLUSIONS: In anoxic brain injuries, a homogeneously positive correlation between qualitative perfusion and DWI signal was identified so that areas of increased diffusion signal showed increased ASL signal. By exploiting this relationship, the normalized diffusion-to-perfusion ratio color map may be a valuable imaging biomarker for diagnosing anoxic brain injury and potentially assessing BBB integrity.
ABBREVIATIONS:
- ASL
- arterial spin-labeling
- NDP
- normalized diffusion-to-perfusion
- BBB
- blood brain barrier
- CBF
- cerebral blood flow
Anoxic or hypoxic brain injury has several classic, well-described imaging findings, including symmetric diffusion restriction in the basal ganglia and cortex.1,2 In the neonatal population, the classic diffusion findings may not be as readily apparent due to the high water content and immature morphology of the brain.3 Arterial spin-labeling (ASL) perfusion is a unique, noninvasive measurement of cerebral blood flow (CBF). ASL perfusion relies on the magnetic tagging of arterial blood water, which is then used as a tracer for brain perfusion.4⇓⇓-7 ASL is uniquely positioned to be incorporated into pediatric and neonatal stroke protocols because it is a noncontrast and repeatable perfusion measurement.8 The ASL tracer has been assumed to be freely diffusible across the blood-brain barrier.5,9⇓-11 However, animal models have shown BBB disruption, due to mannitol or stroke, increased the ASL perfusion signal relative to the dynamic susceptibility contrast perfusion; this finding suggests that the measured ASL perfusion is dependent on BBB integrity, and the ASL signal increases when there is BBB disruption.9 This BBB dependency has not been shown in humans to date.
The ASL sequence has been used to measure perfusion in a variety of pathologies, including anoxic brain injury8,12⇓⇓⇓⇓⇓-18 and ischemic strokes.19,20 Quantitative forms of ASL have demonstrated a global increase in CBF12 as well as relative hyperperfusion in regions with demonstrated injury on conventional MR imaging14,15,21 in patients with anoxic brain injury. This hyperperfusion has been theorized to represent flow restoration exceeding the metabolic demands of the injured brain regions with subsequent neurovascular uncoupling, loss of autoregulation, and further brain damage with potential future poor neurologic outcomes.13,22⇓⇓-25 In addition to the quantitative form of ASL, qualitative forms of ASL perfusion are available, which display relative differences in CBF. Qualitative ASL has some advantages over quantitative ASL. The qualitative version of ASL is available in clinical practice from all major vendors, whereas quantitative techniques are not as readily available, require more complex processing, and may only be available with research licenses at academic centers. Qualitative ASL is much simpler, only requiring subtraction between the control and label pairs, whereas quantification requires the assumption or measurement of multiple variables, including the T1 of tissue, T1 of blood, tagging efficiency, M0 blood and the M0 white matter correction factors, and it depends on accurate segmentation of a high resolution T1.16,26 Each of these variables not only complicates quantification but is also a potential source of error in quantification. The imaging pattern of anoxic brain injury has not been described with nonquantitative forms of ASL perfusion nor has there been an effort to quantify the relationship between quantitative or nonquantitative ASL perfusion and DWI. In this study, we sought to describe the nonquantitative ASL perfusion imaging patterns of anoxic brain injury, characterize the relationship of ASL and DWI, and evaluate a new metric: the normalized diffusion-to-perfusion (NDP) ratio to differentiate patients with anoxic brain injury from healthy controls.
MATERIALS AND METHODS
With institutional review board approval, we retrospectively identified and reviewed medical records of all patients imaged at our institution between 2002 and 2019 whose brain MR imaging report contained the words “anoxic” or “hypoxic” using an institutional radiology search engine. Patients with anoxia were included if their MR imaging study contained diagnostic ASL perfusion and DWI sequences. Patients were excluded if there were severe motion artifacts or the ASL or DWI sequence was otherwise nondiagnostic. Age-matched controls imaged with ASL and DWI without a history of anoxic or hypoxic injury were also collected and analyzed. Similar to the anoxic group, control patients were excluded if the ASL or DWI sequence was nondiagnostic. In addition, patients with prior operations, intracranial hemorrhage, and ischemic injuries of any age were excluded. Patient age, cause of anoxic injury, and time from anoxic injury to imaging were recorded. Our institutional review board approved this retrospective study.
ASL CBF maps were generated using the single-phase pulsed ASL clinical sequence on 3T and 1.5T Ingenia systems (Philips Healthcare, Best, the Netherlands). Imaging parameters were as follows: 30 dynamics with tag and control pairs; TE, 25 ms; label delay, 1200–900 ms; flip angle, 70°; TR, 4000 ms; FOV, 24 × 24 cm; acquisition matrix, 68 × 66 (12 sections, 6-mm thickness, 0.6-mm section gap). A subtraction of the control and labeled pairs was performed to generate a qualitative gray-scale CBF map. No vascular suppression gradients were used because they are not part of the standard Philips ASL sequence.
DWI parameters were as follows: TR, 5355 ms; TE, 81 ms; matrix, 116 × 116; FOV, 23 × 23 cm (3-mm thickness, 0.3-mm section gap). B0 and b = 1000 images were used to calculate the ADC images using the in-line vendor software during image acquisition.
Ten ROIs were manually drawn on the ASL sequence in the caudate, putamen, thalamus, frontal cerebral cortex, and cerebral white matter bilaterally (Fig 1). An additional ROI was placed in the brain stem and cerebellum and served to normalize the perfusion values; in patients in whom the brain stem and/or the cerebellum showed restricted diffusion, another area free of involvement was selected for normalization for either white matter, gray matter, or both. Corresponding ROIs were placed on the DWI and ADC images. The signal intensity of each ROI was recorded in gray.

Sample image showing 10 of the 12 ROI measurements on DWI (left) and ASL (right) at the level of the basal ganglia in a patient who had anoxic brain injury.
Statistical Analysis
ASL perfusion and DWI measurements for each ROI were normalized using the ROI signal intensity in the cerebellum or the brain stem for gray matter and white matter, respectively. A linear best fit was performed between the normalized DWI and the normalized ASL values, and the slope was recorded, allowing identification and removal of up to 4 outliers. A triple-variable receiver operating characteristic analysis involving the number of outliers, best-fitted line slopes, and their respective R2 values was performed to determine the optimal cutoff. A similar analysis was performed using the quantitative and normalized ADC measurements.
The relationship between the estimated time interval from the inciting event to imaging and the linear regression slopes as well as R2 values were examined to determine the dependence on the timing of imaging. Calculations were also performed to determine the dependence on the number of ROI measurements. Two random raw (non-normalized) DWI and ASL ROIs were selected for each patient, and the slope was calculated using the 2 points alone. All possible combinations of 2 ROI selections were segregated into 3 different groups: both ROIs within basal ganglia and thalamus, either ROI within basal ganglia and thalamus, or no ROI within basal ganglia and thalamus.
Data were presented as mean ± standard error of the mean and frequency (percentage) for numeric and categoric variables, respectively. Analysis was completed using the Fisher exact test and the Mann-Whitney nonparametric t test. A 2-tailed P value < .05 was considered significant. Šidák multiple comparison correction was used.
Normalized Diffusion-to-Perfusion Ratio Color Map Generation
DICOM files of the ASL and DWI sequences were coregistered using Advanced Normalization Tools (ANTs, Version 2.3.2; ANTsPy, Version 0.1.6; http://stnava.github.io/ANTs/).27⇓-29 To decrease the impact of punctate heterogeneous noisy signals, we applied an anisotropic diffusion-smoothing function to both sequences (Insight Toolkit, Version5.0.1; Anisotropic Diffusion Library, Version 1.0.2; https://itk.org/).30⇓-32 The NDP color map was then generated using the ratio of the z score–normalized DWI and ASL sequences. A value of “not a number” was assigned and subsequently rendered black on the final color map if the ASL value was zero.
RESULTS
Forty-five patients with anoxic injuries were initially identified using our institutional radiology search engine from 2002 to 2019 with 2-reader confirmation. Nine patients were excluded due to nondiagnostic imaging sequences; 1 patient was excluded due to remote injury (imaging was obtained 253 days after initial inciting event). The remaining 35 patients with anoxic injuries had imaging ranging from 0 to 14 days after the reported inciting event with a mean of 3.8 ± 0.5 days. Thirty-four age-matched patients with an MR imaging with normal findings performed between September 2010 and May 2019 were selected. Of these 34 patients in the control group, 30 (88.2%) had studies performed to rule out stroke, given concerning mental status changes, headache, vertigo, facial or extremity weakness or paresthesia, and vision changes. Three (8.8%) had studies ordered for follow-up of surgery, seizure, and prior remote punctate stroke. The remaining patient (3.0%) had an MR imaging performed to rule out asphyxiation from nonaccidental trauma, which was subsequently cleared. Four of the 34 (11.8%) patients in the control group had additional brain imaging in our system and continued to be negative for significant radiographic findings. Patient characteristics of the anoxic group and the healthy group are shown in Table 1.
Patient characteristics of the anoxic injury group and the healthy control group
Triple-variable receiver operating characteristic analysis involving the allowable number of outliers, best linear-fitted line slopes, and their respective R2 values was performed using the normalized DWI and ASL measurements. Identification of up to 3 outliers (25%) yielded the best diagnostic performance. Under this constraint, the best-fitted lines of anoxic injuries demonstrated significantly higher slopes of 0.93 ± 0.05 compared with those of healthy controls at 0.53 ± 0.11, P < .001. The best-fitted lines of anoxic injuries also had significantly higher R2 values of 0.85 ± 0.01, compared with 0.63 ± 0.03 in healthy controls, with P < .001. Scatterplots of the best-fitted lines of R2 and their corresponding slopes were generated (Fig 2). By means of a combinatory cutoff of slopes higher than 0 and R2 values higher than 0.78 as determined per the receiver operating characteristic analysis, the following diagnostic characteristics for anoxic injuries were obtained using normalized DWI and ASL: sensitivity of 0.86 (95% CI, 0.71–0.94), specificity of 0.82 (95% CI, 0.66–0.92), positive predictive value of 0.83 (95% CI, 0.68–0.92), and negative predictive value of 0.85 (95% CI, 0.69–0.94). The contingency table is shown in Table 2, with the Fisher exact test, P < .001.

Twelve-point ROI linear regression analysis using DWI and ASL sequences. A, R2-versus-slope scatterplot for patients with anoxic brain injuries identified 30 of 35 cases positive for anoxic brain injury using a receiver operating characteristic analysis–determined cutoff of positive slopes and R2 higher than 0.78. B, R2-versus-slope scatterplot for healthy controls excludes 28 of 34 cases negative for anoxic brain injury using the same slope and R2 cutoffs.
Contingency table of normalized DWI and normalized ASL linear regression for the diagnosis of anoxic injury using a combinatory cutoff of slope of >0 and R2 of >0.78a
A similar analysis was performed on the raw quantitative ADC measurements with the following diagnostic characteristics for anoxic injuries: sensitivity of 0.57 (95% CI, 0.41–0.72), specificity of 0.71 (95% CI, 0.54–0.83), positive predictive value of 0.67 (95% CI, 0.49–0.81), and negative predictive value of 0.62 (95% CI, 0.46–0.75) with the Fisher exact test, P = .03.
To determine the effects of time, we examined the relationship between the time interval from the inciting event to imaging and the linear regression slopes and R2 (Fig 3). Both failed to demonstrate significantly nonzero slopes (y = 0.01055 × x + 0.8847 with P = .58 and y = 0.003945 × x + 0.8327 with P = .38, for linear regression slopes and R2, respectively).

Linear regression analysis demonstrates no significant linear dependence between slopes and interval to imaging (left) or between R2 and interval to imaging (right), using DWI and the ASL sequences. Nonetheless, both exhibited positive trends. Linear fit equations: y = 0.01055 × x + 0.8847, P = .58 (left); y = 0.003945 × x + 0.8327, P = .38 (right).
Permutations of all possible “12 select 2” ( ) ROI raw (non-normalized) DWI and ASL signal densities were examined to determine the dependence on ROI selection. Using a cutoff of positive-versus-negative slopes for anoxic and healthy diagnostic predictions, we calculated specificity and sensitivity. Data were segregated into 3 groups: both ROIs within the basal ganglia and thalamus, either ROI within the basal ganglia and thalamus, or no ROI within the basal ganglia and thalamus. A combination of the caudate and contralateral putamen was able to achieve a sensitivity of 0.71 and specificity of 0.76. Another combination, the putamen and contralateral cortex, showed a sensitivity of 0.89 and specificity of 0.74. The overall diagnostic performance of this “2-location ROI” method was inferior to that of the “12-location ROI linear regression” method (P < .001 for both sensitivity and specificity).
The NDP ratio color map was generated using the coregistered, smoothed, and z score–normalized DWI (b = 1000) and ASL sequences (Fig 4). The NDP ratio color map of anoxic injuries demonstrated homogeneous color distribution throughout the brain (Fig 4A, -B). The NDP ratio color map of healthy controls demonstrated heterogeneous color distribution bilaterally (Fig 4E, -F). If one highlighted the differences between the anoxic and nonanoxic patterns, the NDP ratio color map of predominately unilateral anoxic injury secondary to strangulation demonstrated homogeneous signals in the primarily affected right hemisphere and heterogeneous signals in the preserved left hemisphere (Fig 4I, -J).

Representative slices of voxelwise normalized NDP color map generation and corresponding DWI and ADC images. Anoxic brain injury (A and B) demonstrates homogeneous NDP ratios throughout the brain. B = 1000 DWI (C) and ADC (D) images show symmetric diffusion restriction in the frontal and parietal gray matter. E and F, A healthy control demonstrates heterogeneous NDP ratios throughout the brain. The heterogeneity is most pronounced in the white matter. B = 1000 DWI (G) and ADC map (H) show no diffusion restriction. Unilateral anoxic brain injury with NDP (I and J) showing 1 predominately homogeneous (anoxic) right hemisphere and 1 heterogeneous (nonaffected) left hemisphere. J, The asymmetry is most pronounced at the vertex. B = 1000 DWI (K) and ADC map (L) demonstrate unilateral cortical diffusion restriction in the right anoxic hemisphere, corresponding to the more homogeneous NDP ratios.
DISCUSSION
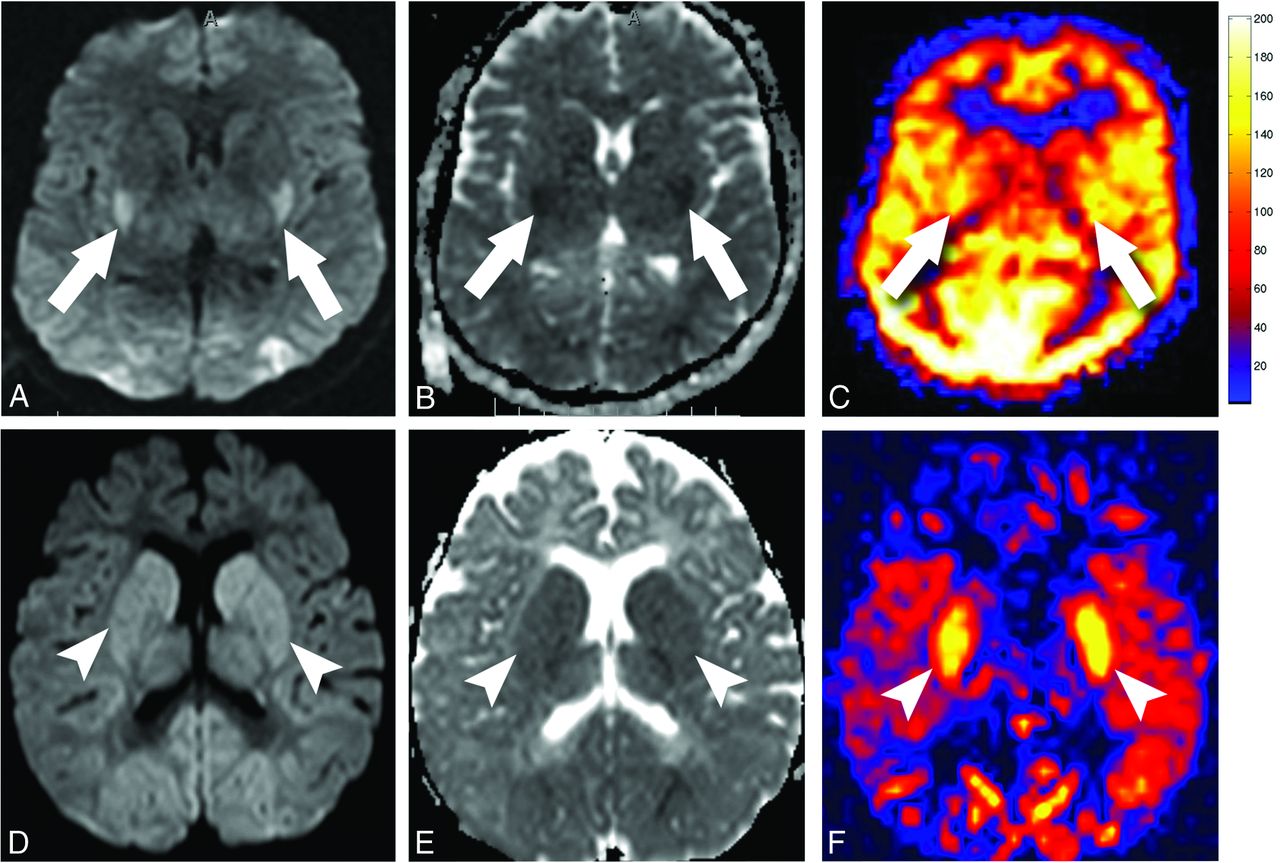
Anoxic brain injury is a medical condition with devastating outcomes.12,33,34 Discriminating anoxic from nonanoxic injuries, especially in the neonatal period, is important for medical management,35 potential therapeutic hypothermia protocol adjustment,22 and prognostic estimation.13,34,35 Classic findings of diffusion restriction as well as quantitative hyperperfusion, especially in the regions of higher metabolic demand such as the basal ganglia and cortex, have been described previously in the literature.1⇓-3,12⇓-14,22 However, there remains a gap in the literature regarding the anoxic brain injury patterns on nonquantitative ASL sequences. In this article, we characterized the qualitative ASL perfusion findings in anoxic injury. We identified the relationship between ASL perfusion and diffusion restriction, which demonstrated a homogeneously positive correlation in patients with anoxic brain injuries so that areas of restricted diffusion showed increased ASL perfusion signal (Fig 5D–F).

Quantitative-versus-nonquantitative ASL perfusion in anoxic brain injury. A–C, Quantitative perfusion imaging in a 31-year-old patient who had an anoxic brain injury after cardiac arrest. B = 1000 DWI (A) and ADC map (B) show diffusion restriction in the posterior putamen (arrows) and occipital cortex. C, Quantitative pulsed ASL image shows global hyperperfusion. Subtle increased cerebral blood flow is seen in the posterior putamen and occipital lobes, corresponding to the areas of diffusion restriction (arrows). D–F, Nonquantitative perfusion imaging in a 22-month-old child who had an anoxic injury after cardiac arrest. B = 1000 DWI (D) and ADC map (E) show diffusion restriction in the basal ganglia (arrowheads) and occipital cortex. F, Nonquantitative colorized pulsed ASL image demonstrates marked increases in the ASL signal in the putamen (arrowheads) and occipital cortex, corresponding to the areas of diffusion restriction.
Review of the 35 patients with anoxic brain injuries demonstrated classic diffusion restriction findings (hyperintense on DWI and hypointense on ADC). Ischemic changes including energy metabolism variations and cytotoxic edema reflected by diffusion-weighted imaging were prominent in the metabolically active tissue in the brain,36 most commonly in the basal ganglia (especially the posterior putamina), ventrolateral thalami, and cortex.1⇓-3,37⇓-39 In addition to a pattern of global hyperperfusion seen with prior quantitative ASL studies (Fig 5A–C), review of the qualitative ASL perfusion images also demonstrated regional signal increases that correlated with the areas of increased DWI signal (Fig 5D–F).12,13 We suspect that the regional ASL perfusion differences are detectable with quantitative techniques, but on typical color maps that might not be adequately scaled, global hyperperfusion may render these relative differences less apparent because the entire brain is at the high end of the color spectrum.
ROI analyses demonstrated a uniform homogeneously positive relationship between the ASL perfusion signal and the DWI signal in the selected regions among patients with anoxic brain injuries (Fig 2). This relationship held true not only in the more commonly described basal ganglia region but also in the cortical gray matter and white matter regions.15,21 Analysis of the ADC signal revealed a similar relationship, consistent with prior literature demonstrating significant correlations between decreased ADC and elevated ASL cerebral blood perfusion signals;25 however, the diagnostic performance of the ADC and normalized ADC was inferior, likely due to higher susceptibility to volume-averaging artifacts from the surrounding CSF or intrinsic properties yet to be delineated causing higher ASL cerebral blood perfusion elevation than the corresponding ADC abnormality.25
This homogeneously positive relationship between ASL and DWI may be related to changes in global BBB permeability. Tanaka et al9 previously showed that the ASL perfusion sequence tends to overestimate CBF in ischemic stroke in an animal model. Unilateral injection of mannitol in healthy animals, which increased the permeability of the BBB, also increased the ASL signal. Assuming that the magnetically tagged water molecules are freely diffusible across the BBB,5,10,11 they postulated that ischemic stroke injuries, with subsequent disruption of the BBB, allowed increased extravasation of water molecules, implying that ASL perfusion signal is dependent on BBB integrity.
On the basis of the results of the animal studies and our current observations, we hypothesize that in an anoxic injury, there is both a global and regional disruption of the BBB, especially in the regions of higher metabolic demands, leading to regional increases in ASL signal that correlate with the areas of greatest diffusion restriction (Fig 5D–F). Nondependence of the positive relationship between ASL and DWI signal on the time interval from injury to imaging (Fig 3) suggests that the BBB injury is present and enduring up to 14 days (range, 0–14 days after the reported inciting event). This BBB disruption is normally seen on gadolinium contrast-enhanced MR imaging 2–3 days after ischemic injury and may persist for months;40 however, it is conceivable that the BBB injury occurs earlier than 2–3 days, and it is only after 2–3 days that the BBB disruption is large enough for the gadolinium particles to cross the BBB.
Gadoterate meglumine, a commonly used chelated gadolinium contrast medium, is 2 nm,41 compared with 0.275 nm for a water molecule. ASL uses the protons within the blood water,4,5,42,43 making the ASL sequence much more sensitive to early changes in the BBB pore size. Although there is not a significantly nonzero slope, positive trends of both the linear regression slope and R2 over interval to imaging were observed (Fig 3). These may suggest that the repair of the BBB is gradual and lags behind the pseudonormalization of the diffusion signals, a phenomenon in which diffusion-weighted imaging improves and appears to have normal findings by the end of the first week.3 Gradually decreasing metabolic demands due to delayed cell death during the energy failure component of the reperfusion phase21,44,45 with persistent BBB disruption could theoretically have contributed to a similar relationship. Further research with animal models and survival studies is needed to delineate the underlying physiologic response and to evaluate the effects of BBB disruption in humans and the recovery of BBB integrity.
The animal studies showing an increase in ASL signal with BBB disruption alone highlight 1 potential limitation of quantitative ASL techniques. Quantitative ASL equations are based on the assumption that the ASL tag is a freely diffusible tracer and is able to freely cross the BBB. If the animal studies and our hypothesis are true, then nonquantitative methods may be advantageous when studying entities such as anoxic brain injury. Prior quantitative studies looking at anoxic brain injury showed marked global hyperperfusion with mean gray matter perfusion values reaching up to 204 mL/100 g of tissue/min (Fig 5A–C).12 These exceptionally high perfusion values are 3–4 times normal and would mean between 45% and 60% of cardiac output would be directed to the brain.46 On the basis of these superphysiologic values, we believe that the cerebral perfusion has increased to a degree; however, changes in BBB permeability have also influenced the quantitative ASL measurements. Future studies may evaluate quantitative and nonquantitative ASL perfusion in a human BBB disruption model to validate this hypothesis.
Another potential cause of the diffusion and perfusion ratio observations would be loss of autoregulation, leading to loss of global vasoreactivity after anoxic brain injury.47,48 Loss of vasoreactivity has been suggested in neonates with hypoxic-ischemic encephalopathy.49 Additionally, global hyperperfusion affecting the white matter could artificially increase the ratio in the white matter regions by increasing their perfusion values to a level similar to that of the gray matter. Future studies could investigate this possibility by applying gray-white matter segmentation and analyzing the mean diffusion-to-perfusion ratios in the gray matter and white matter, respectively.
Among healthy controls, significantly lower R2 values and lower slopes of the linear regression models implied underlying heterogeneity of the relationship between the ASL perfusion and the DWI signal. Analyses of the ADC also demonstrated similar results. The lack of a homogeneous relationship is likely secondary to a much lower signal-to-noise ratio among the intracranial structures in healthy controls. Small variability in metabolic demand, regional perfusion, BBB permeability, and the inherent delay of the autoregulation feedback loop may also contribute to the demonstrated heterogeneities.47,48
Generation of the voxelwise NDP color map highlights 2 key concepts. First, in patients with anoxic brain injuries, for reasons that remain elusive, the ratio between ASL and DWI signal was homogeneous throughout the brain, including the white and gray matter (Fig 4A, -B). In patients with anoxia, this voxelwise global homogeneous relationship supersedes any larger manual or automated ROI methodology by showing that as long as enough ROIs are selected and the locations of the DWI and ASL are matched, the actual location of the ROI in a particular structure is not significant. Second, in healthy controls, the NDP color map (Fig 4E, -F) demonstrated global heterogeneity, evident by the large distribution of DWI/ASL ratios through the brain structures. Thus, in the healthy population, ROI placement and, most important, the number of ROIs become significant due to the global heterogeneity. This is most pronounced in the white matter regions where perfusion values are very low. The NDP color map of the predominately unilateral case, which was an unfortunate patient with nonaccidental trauma with anoxic brain injury secondary to unilateral carotid occlusion from strangulation, demonstrated more uniform color distribution in the affected right hemisphere and heterogeneous color distribution in the nonaffected left hemisphere (Fig 4I–J). With future automatic implementation, we believe the NDP color map can be an additional imaging biomarker for anoxic brain injuries, especially in the neonatal population. The NDP ratio map avoids the dependence, complexity, and inherit limitations of manual or automated ROI selection and ratio calculations.
In an attempt to simplify the NDP ratio generation for a neuroradiologist in a general clinical practice who might not have a pipeline to generate these NDP maps or have time to select 10 ROIs, we examined the diagnostic performance of choosing 2 random ROIs. The positivity of the slope of the line between the 2 points on a graph of ASL-versus-DWI signal was determined. Positive slopes would be consistent with anoxic injuries. Negative slopes would be consistent with healthy patients. The diagnostic performance of this method was inferior to that of the 12-point ROI linear regression method. This was expected because the inherent heterogeneity of the NDP ratios in the healthy population could not be accurately captured by a random 2-point selection (Fig 4E, -F). If the NDP ratio color map cannot be obtained while one is trying to confirm the diagnosis of anoxic brain injury, alternatively, 2 different basal ganglia or thalamus structures from the opposite hemisphere can be selected for slope determination with reasonable sensitivity (0.78) and specificity (0.71).
This study has several limitations, in addition to the inherent limitations of being a retrospective study. First, despite recent progress in the understanding of BBB permeability and ASL perfusion, our knowledge of their characteristics, especially in the context of anoxic brain injuries, remains limited. The exact underlying physiologic property that the NDP ratio is reflecting remains uncertain. Further research is needed for better characterization of the physical and molecular properties of the BBB during anoxic brain injury, timing, and its subsequent repair and also to evaluate the NDP ratio in models of BBB disruption. Second, we performed a strict comparison between patients with a confirmed diagnosis of anoxic brain injury and control subjects with normal imaging examination findings. This improves our statistical power and highlights our findings. Further studies will aim to examine the NDP ratios in other isolated and mixed etiologies, including tumor, stroke, and metabolic diseases. Third, we used the in-line vendor software for automatic ADC map generation. Prior comparative studies have demonstrated significant variations in the generation of ADC maps across different postprocessing software.50 Future studies could be repeated with an open-source postprocessing software, such as Horos (https://sourceforge.net/projects/horos/). Moreover, manually placed ROI regions could have signal interference from surrounding structures, volume averaging, or incompletely matched locations. An automated atlas-based process for brain parcellation, region selection, and location-matching across series could be more accurate if performed with a high-resolution T1 series.
Last, the ASL perfusion sequence remains suboptimal in the neonatal population due to the small head size and requires optimization to ensure good-quality imaging. Our postlabel delay times at 1200 ms differ from the International Society for Magnetic Resonance in Medicine Perfusion Study Group ASL parameter recommendations, but most of our cases were scanned before the release of these recommendations. It is possible that the shorter postlabel delay has influenced the findings and observations with the NDP map. These findings can be further validated and confirmed at longer postlabel delay times in future studies.51
CONCLUSIONS
In patients with anoxic brain injury, there is a global homogeneously positive relationship between qualitative ASL perfusion and diffusion-weighted signal so that areas of restricted diffusion show significantly increased ASL perfusion signal. This relationship suggests that ASL perfusion signal may be dependent on BBB integrity, consistent with prior animal models. A new metric, the NDP ratio color map, may be a valuable imaging biomarker to differentiate patients with anoxic brain injury from healthy controls and to potentially assess BBB integrity. Further studies are necessary to better understand the underlying physiology reflected in the NDP ratio map observations in anoxic brain injury.
Footnotes
Disclosures: Ningcheng Li—UNRELATED: Patents (Planned, Pending or Issued): A Patent application has been filed for this work. We have not received any payments. Jeffrey M. Pollock—UNRELATED: Patents (Planned, Pending or Issued): A Patent application has been filed for this work. We have not received any payments.
References
- Received August 26, 2019.
- Accepted after revision January 28, 2020.
- © 2020 by American Journal of Neuroradiology


Jump to section
Related Articles
Cited By...
- No citing articles found.