
Abstract
BACKGROUND AND PURPOSE: Recent studies showed thalamic atrophy in the early stages of MS. We investigated the impact of intracortical lesions on the volumes of subcortical structures (especially the thalamus) compared with other lesions in MS.
MATERIALS AND METHODS: Seventy-one patients with MS were included. The volumes of intracortical lesions and white matter lesions were identified on double inversion recovery and FLAIR, respectively, by using 3D Slicer. Volumes of white matter T1 hypointensities and subcortical gray matter, thalamus, caudate, putamen, and pallidum volumes were calculated using FreeSurfer. Age, MS duration, and the Expanded Disability Status Scale score were assessed.
RESULTS: Patients with intracortical lesions were older (P = .003), had longer disease duration (P < .001), and higher Expanded Disability Status Scale scores (P = .02). The presence of intracortical lesions was associated with a significant decrease of subcortical gray matter volume (P = .02). In our multiple regression model, intracortical lesion volume was the only predictor of thalamic volume (R2 = 0.4, b* = –0.28, P = .03) independent of white matter lesion volume and T1 hypointensity volume. White matter lesion volume showed an impact on subcortical gray matter volume in patients with relapsing-remitting MS (P = .04) and those with disease duration of <5 years (P = .04) and on thalamic volume in patients with Expanded Disability Status Scale scores of <4.0 (P = .01). By contrast, intracortical lesion volume showed an impact on subcortical gray matter and thalamic volumes in the secondary-progressive MS subgroup (P = .02 and P < .001) in patients with a long-standing disease course (P < .001 and P = .001) and more profound disability (P < .001 and P < .001).
CONCLUSIONS: Thalamic atrophy was explained better by intracortical lesions than by white matter lesion and T1 hypointensity volumes, especially in patients with more profound disability.
ABBREVIATIONS:
- DIR
- double inversion recovery
- EDSS
- Expanded Disability Status Scale
- iCL
- intracortical lesion
- ICV
- intracranial volume
- PPMS
- primary-progressive MS
- RRMS
- relapsing-remitting MS
- SPMS
- secondary-progressive MS
- T1H
- T1 hypointensities
- WMH
- white matter hypointensities
- WML
- white matter lesions
- SGMS
- subcortical grey matter structures
- b*
- standartized regression coefficients
Multiple sclerosis (MS) is a chronic debilitating disease of the CNS. Atrophy of subcortical gray matter structures (SGMS) is associated with cognitive dysfunction, fatigue, and overall disability in MS.1 Among all SGMS, most attention is riveted on the thalamus, a gateway for cortical areas and a relay between the cortex and basal ganglia.2
Volumetric MR imaging studies showed thalamic atrophy at early stages of the disease, including clinically and radiologically isolated syndromes.3,4 Thalamic atrophy was associated with fatigue,5,6 cognitive impairments,7,8 decrease of walking speed,9 and higher disability.10,11 Measuring thalamic volume may be a good surrogate biomarker for clinical trials and, probably, routine practice.4,11,12
Thalamic atrophy in MS can be related to either primary damage in the thalamus or distant damage of afferent or efferent thalamic fibers.1 Primary damage includes inflammation and neurodegeneration followed by demyelination, neuronal loss, neuronal shrinkage, and axonal damage.7,13 Distant damage occurs due to mechanisms of Wallerian or transneuronal degeneration as a result of gray matter (GM)14 and white matter (WM)15 pathology.
In early MS, most lesions are located in the WM with less prominent involvement of the GM.16 Cortical demyelination spreads as the disease progresses, and it is most prominent in the secondary-progressive phase.17 However, thalamic atrophy is prominent in early stages and continues throughout the disease course.11 The differential impact of localization of demyelinating lesions on the thalamus and SGMS atrophy is unclear. In a neuropathological study of Vercellino et al,18 demyelination of subcortical GM correlates well with cortical, but not WM, demyelination. By contrast, in the MR imaging study by Henry et al,19 in patients with clinically isolated syndrome, the evidence of a direct connection between thalamic atrophy and white matter lesions (WML) was shown. In the MR imaging study of Ruggieri et al,14 atrophy of SGMS, eg, the thalamus, correlated with the number and volume of cortical lesions. The negative correlation of T1 black hole load and SGMS atrophy in patients with relapsing-remitting MS (RRMS) was shown.20
To date, not enough data demonstrate the differentiated impact of cortical and WM pathology on subcortical gray matter atrophy. In this study, we aimed to investigate the impact of cortical lesions on volumes of the thalamus and other subcortical structures compared with other lesion locations (eg, WML and T1 white matter hypointensities (WMH) in MS.
MATERIALS AND METHODS
Study Population
This study had a cross-sectional design with retrospective analysis of data. Seventy-one patients with MS were included. The study was approved by the Local Ethics Committee of the SBIH City Clinical Hospital No. 31, and all subjects provided their written informed consent.
The inclusion criteria were as follows: patients of both sexes with multiple sclerosis, defined with the McDonald 2017 criteria; 18–65 years of age at MR imaging; and providing informed consent. The exclusion criteria were as follows: patients with relapses or steroid use within 30 days before MR imaging; a medical history associated with brain pathology (excluding MS); and pregnancy.
All data were collected for the time of MR imaging study and included sex, age, disease duration (time from the first relapse till the date of MR imaging), and Expanded Disability Status Scale (EDSS) score.
MR Imaging Acquisition Protocol
MR imaging was performed on General Electric (GE) Signa (GE Healthcare) 3T machine with isometric voxels (1 × 1 × 1 mm); model discovery, 750w; receive channels, 24. MR imaging sequence protocol was as follows—T1 CUBE (GE Healthcare): imaging plane, sagittal; imaging resolution, 1 × 1 × 1 mm; TR, 7.68 ms; TE, 3.12 ms; TI, 400 ms; flip angle, 11°; echo-train length, 1; bandwidth, 244 Hz/pixel; FLAIR CUBE: imaging plane, sagittal; imaging resolution, 1 × 1 × 1 mm; TR, 6500 ms; TE, 90 ms; TI, 1956 ms; flip angle, 90°; echo-train length, 140; bandwidth, 122 Hz/pixel; and double inversion recovery (DIR) CUBE: imaging plane, sagittal; imaging resolution, 1 × 1 × 1 mm; TR, 7000 ms; TE, 90 ms; TI, 2897 ms; flip angle, 90°; echo-train length, 160; bandwidth, 140 Hz/pixel.
For this project, we defined only intracortical lesions (iCLs) that were confined within the cortex, with sparing of the white matter and detected using the DIR sequence.19 WML were detected on FLAIR. Lesion volumes were manually counted using 3D Slicer (http://www.slicer.org) by 2 independent neuroscientists with experience in lesion segmentation (G.M., I.K.) based on predefined criteria. All inconsistencies were solved by agreement.
Volumes of white matter hypointensities, detected on T1 (T1H); subcortical gray matter volume; and thalamus, caudate, putamen, and pallidum volumes were measured automatically using FreeSurfer (https://surfer.nmr.mgh.harvard.edu/). To normalize lesion volumes for brain size, we used ROBEX (https://www.nitrc.org/projects/robex) to count the intracranial volume (ICV) and then transformed all volumes in milliliters to percentage of ICV using the following formula:

Statistical Analysis
All datasets were checked for normality with the Kolmogorov-Smirnov test.
On the first step, we divided all patients in 2 groups according to their intracortical lesion status, positive and negative for iCLs to compare demographic, clinical, and radiologic features of both groups depending on the iCL status. A comparison between iCL-negative and iCL-positive groups was performed with nonparametric (Mann-Whitney U test) tests. To compare the categorical data (the sex and MS phenotype), we used the Pearson χ2 test. We considered P < .05 as significant. Data are presented as mean (SD) or as median (25th, 75th quartile).
On the second step, we attempted to assess the impact of iCL on volumes of subcortical structures using multivariate analysis of covariance, corrected for age and sex. Then we assessed the impact of iCL on volumes of subcortical structures compared with white matter lesions and T1 WMH using multiple regression analysis. Furthermore, using regression analysis, we estimated the impact of iCL in different disease categories, such as the following: 1) patients with relapsing-remitting MS (RRMS), secondary-progressive MS (SPMS), and primary-progressive MS (PPMS); 2) disease duration before and after 5 years; and 3) EDSS score <4.0 and ≥4.0. Volumes of iCL, WML, WMH, age, and disease duration were included as covariates.
RESULTS
Forty-three (61%) women and 28 (39%) men were included in the study. The median age was 37 years (interquartile range (difference between 75th and 25th percentiles), 29–49 years). According to the disease phenotype, there were 54/71 (76%) patients with RRMS, 12/71 (17%) with SPMS, and 5/71 (7%) with PPMS. The median EDSS score and disease duration were 3 months (interquartile range, 2–4.5 months) and 53 months (interquartile range, 15–122) months, respectively.
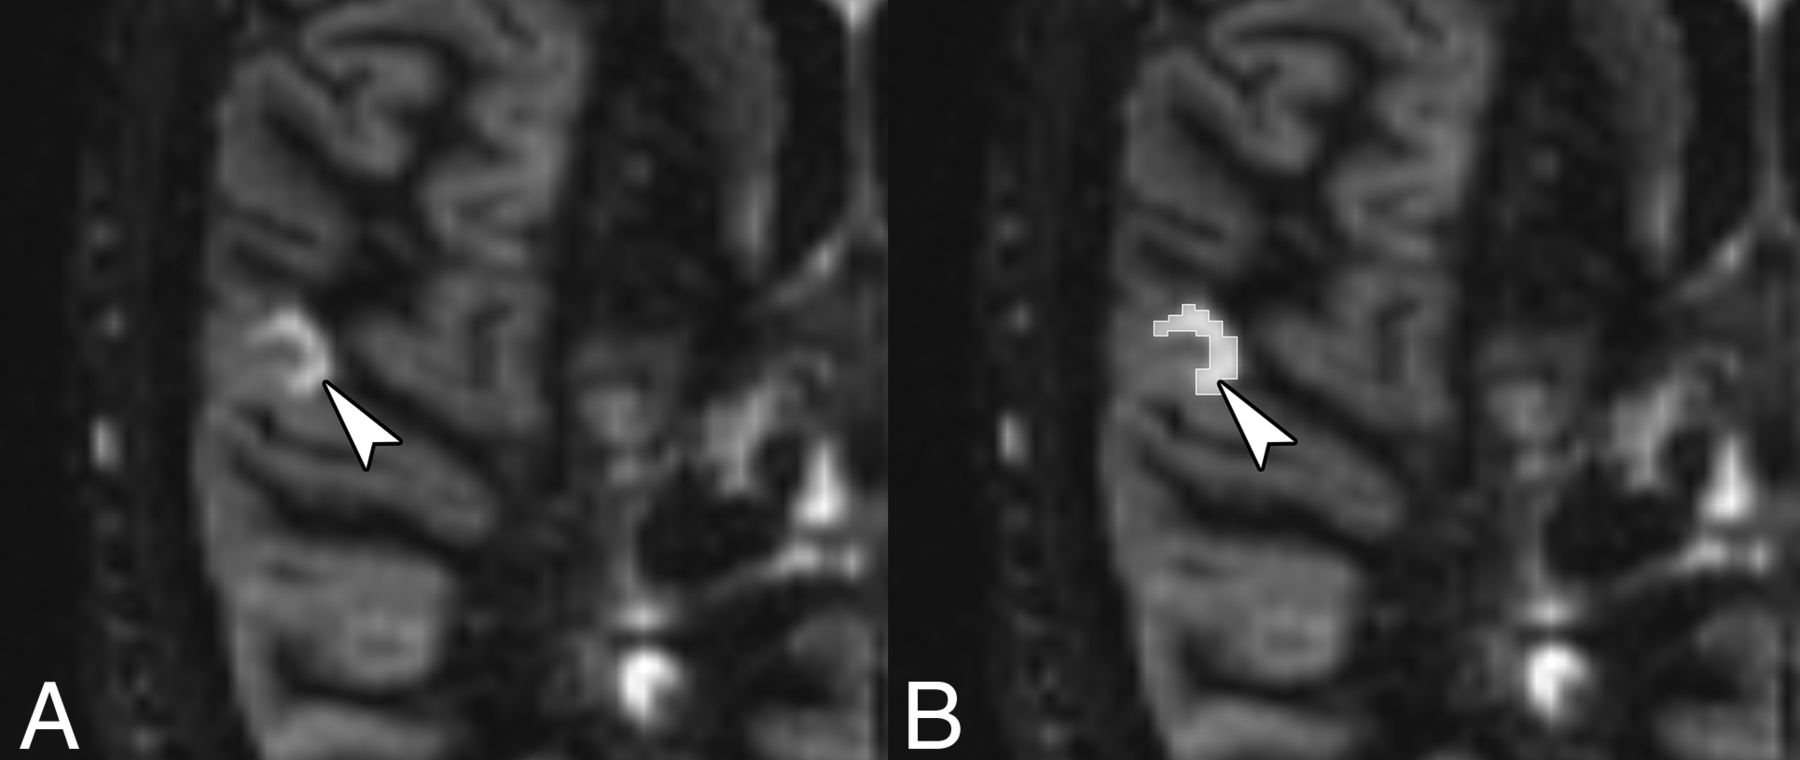
iCLs were detected in 55/71 (77%) patients. An example of a purely iCL is shown in Fig 1. On the basis of iCL status, patients were divided into groups positive and negative for iCL. Clinical and imaging data were compared between these 2 groups. No difference in the disease phenotype (RRMS, SPMS, PPMS) was detected between groups (P = .11). Patients with iCLs were older (P = .003) and had longer disease duration (P < .001) and the highest EDSS scores (P = .02). Results are shown in the Table 1.

An example of a purely intracortical lesion (arrowhead) (A) on the DIR MR image and its manual segmentation using 3D Slicer (B).
Demographic characteristics according to iCL status
The presence of iCLs was associated with a significant decrease of subcortical gray matter volume (P = .02) and atrophy of the caudate, putamen, and pallidum (P = .03, P = .02, P = .005, respectively). Results are presented in Table 2 and Fig 2; examples of the volume measurements of the thalamus in patients positive and negative for iCL are shown in the Fig 3.
Brain morphometry analysis according to the iCL status
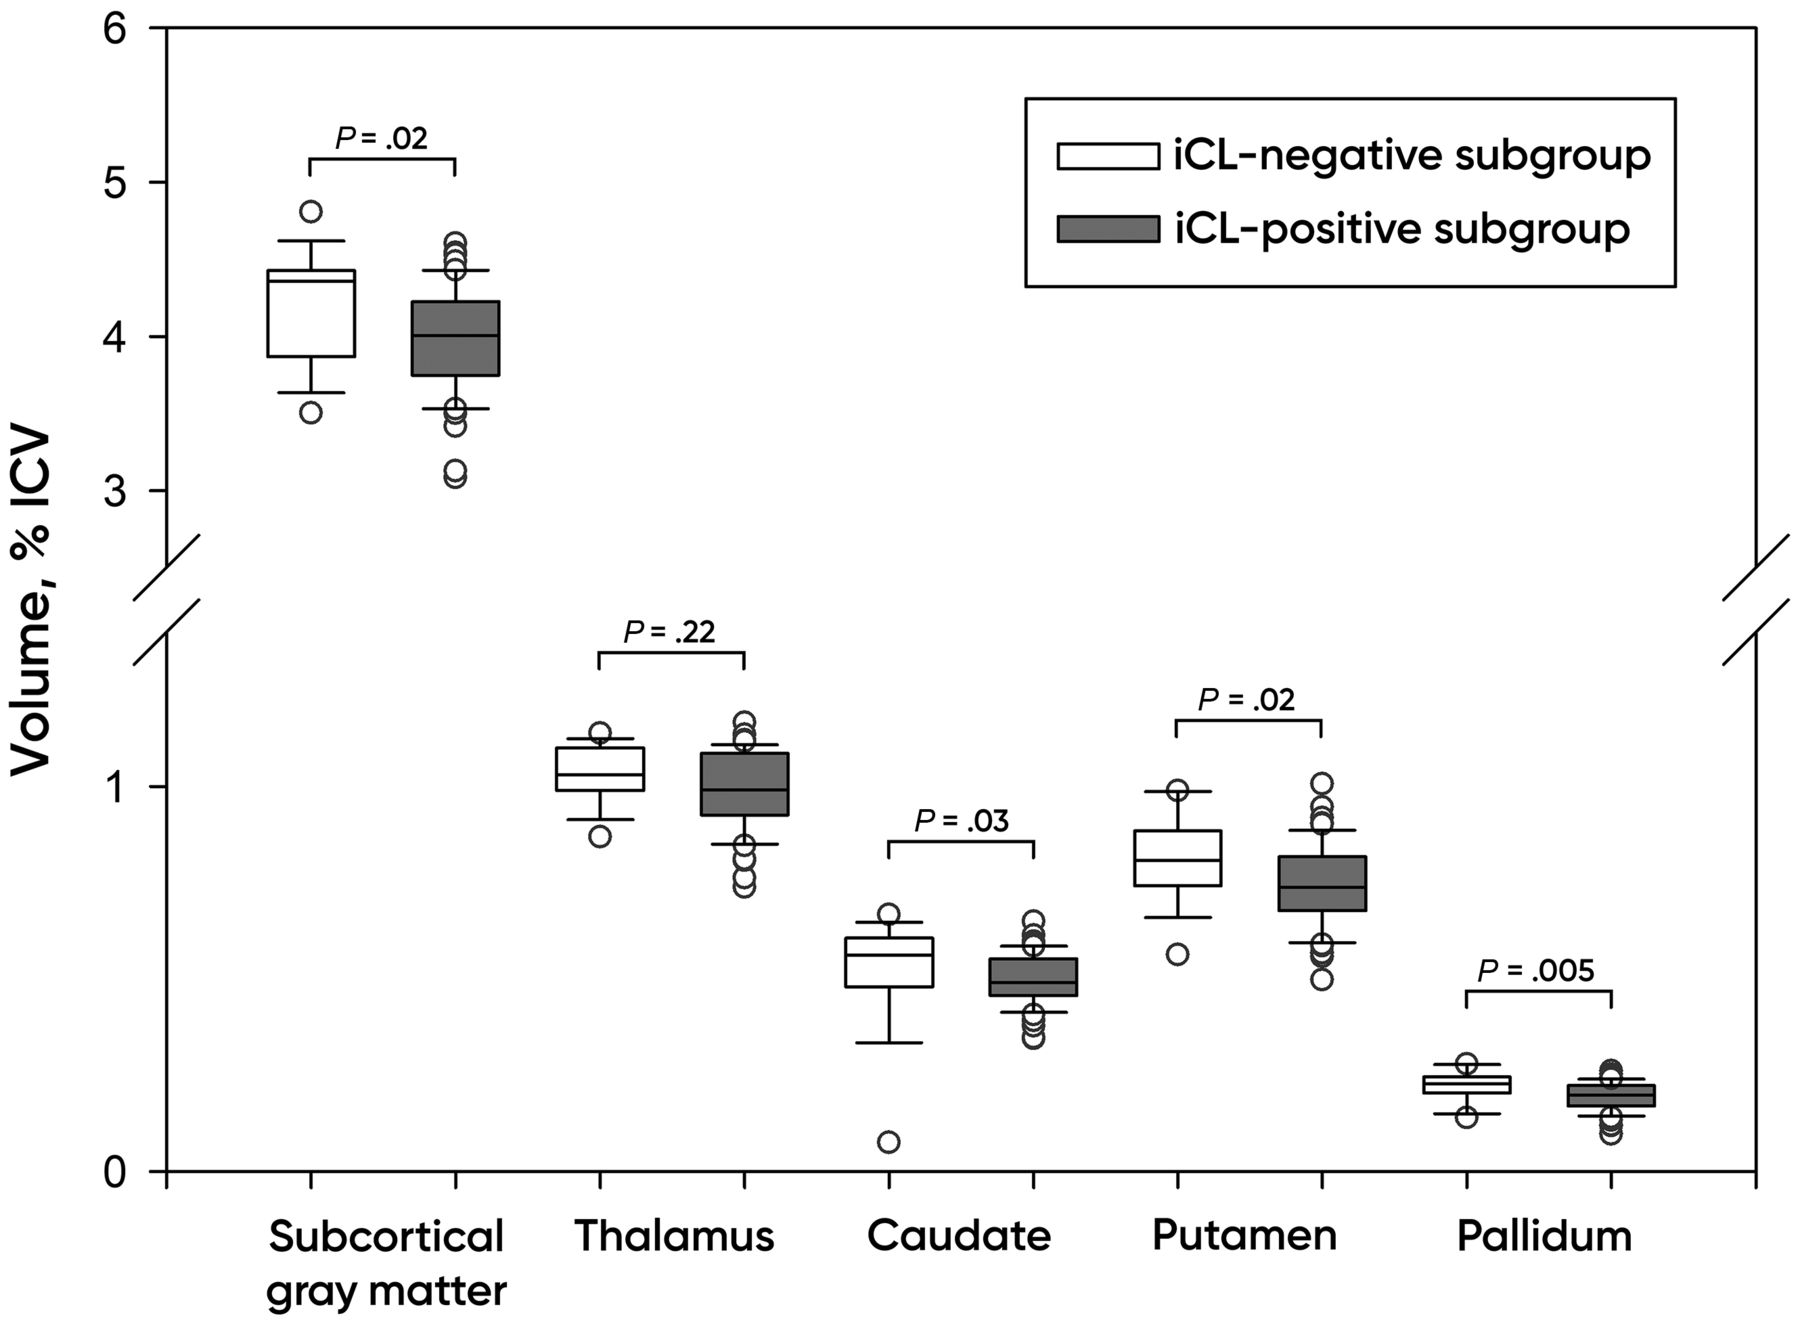
Brain volumes according to the iCL status. Plots of the median, 10th, 25th, 75th, and 90th percentiles as vertical boxes with error bars.

Examples of the volume measurement of the thalamus (arrowheads) in iCL-negative (A and B) and iCL-positive patients (C and D) using FreeSurfer (T1-weighted MR image).
Generalized linear model analysis of covariance revealed a significant impact of the volume of iCLs (% ICV) on the volumes of subcortical gray matter (F = 20.8, P < .001), thalamus (F = 16.15, P < .001), caudate (F = 7.4, P = .008), putamen (F = 7.15, P = .009), and pallidum (F = 8.88, P = .004). Age significantly predicted the total volumes of subcortical gray matter (F = 7.76, P = .007) and the putamen (F = 24.7, P < .001). Sex was not a significant predictor in this model.
Our multiple regression model explained 43% of variance (R2 = 0.43), and iCL volume was the only predictor of the thalamic volume (b* = −0.28, P = .03) independent of the volume of WML and T1H. iCL volume did not demonstrate an impact on volumes of other structures. T1H volume predicted subcortical gray matter volume (R2 = 0.52, b* = −0.41, P = .02) independent of the volumes of iCLs and WML.
Subgroup Analysis
Disease Phenotype.
In patients with RRMS, only the WML volume had a significant impact on subcortical gray matter volume (R2 = 0.49, b* = −0.49, P = .04) and putamen volume (R2 = 0.27, b* = −0.57, P = .04).
By contrast, in the SPMS subgroup, iCL lesion volume showed a significant impact on subcortical gray matter volume (R2 = 0.81, b* = −0.44, P = .02) and thalamic volume (R2 = 0.89, b* = −0.78, P < .001). Volumes of T1H explained only subcortical gray matter volume (R2 = 0.81, b* = −1.11, P = .04). Volumes of WML showed no significant associations.
We did not perform multiple regression for the PPMS subgroup due to the low number of patients (4 subjects).
Disease Duration.
In the iCL-positive group, 20 patients had disease duration of <5 years and 35 patients had disease duration of >5 years.
In patients with MS with disease duration of <5 years, only the volume of WML had a significant impact on subcortical gray matter volume (R2 = 0.34, b* = −0.70, P = .04), putamen volume (R2 = 0.36, b* = −0.79, P = .02), and pallidum volume (R2 = 0.32, b* = −0.77, P = .03).
In patients with long-standing disease course (>5 years), we showed significant impact of iCL volume on subcortical gray matter volume (R2 = 0.71, b* = −0.41, P < .001), thalamus (R2 = 0.55, b* = −0.50, P = .001), and caudate volumes (R2 = 0.49, b* = −0.59, P = .01). The volume of T1H was associated with subcortical gray matter volume (R2 = 0.71 b* = −0.62, P = .001). Volumes of WML showed no significant associations.
EDSS Score.
In the iCL-positive group, 28 patients had EDSS scores of <4, and 27 patients had EDSS scores ≥4.0.
In the subgroup of patients with MS with EDSS scores of <4.0, the only significant impact was shown for the volume of WML on thalamic volume (R2 = 0.34, b* = −0.60, P = .01).
In patients with EDSS score ≥4.0, iCL lesion volume showed a significant impact on subcortical gray matter volume (R2 = 0.77, b* = −0.56, P < .001), thalamic volume (R2 = 0.55, b* = −0.60, P < .001), and caudate volume (R2 = 0.57, b* = −0.44, P = .007).
The volume of T1H was associated with subcortical gray matter (R2 = 0.77, b* = −0.79, P = .002) and thalamic volumes (R2 = 0.55, b* = −0.74, P = .03). Volumes of WML showed no significant associations.
All data can be found in the On-line Table.
DISCUSSION
In this study, we assessed the impact of iCL on volumes of subcortical structures compared with WML and T1H in MS.
Our findings demonstrate that the volumes of iCLs may impact the volumes of subcortical gray matter structures, especially on the thalamus in MS. iCL volume was the only predictor of thalamic volume independent of volumes of WML and T1H.
The more interesting results were found in subgroup analysis. Volumes of WML impacted subcortical gray matter volume in patients with RRMS, patients with disease duration of <5 years, and the volume of the thalamus in patients with EDSS scores of <4.0. These findings are is in line with those of the study of Tao et al,20 which has shown a correlation between the volume of WML and thalamic atrophy in patients with RRMS. Acute inflammation, related to the formation of WML, is the major driving force during the RRMS phase, with some diminishing inflammatory activity in the progressive phase.21 Hence, our findings are highly relevant to this concept. iCLs have a different pathogenesis and may prevail in progressive forms of MS, becoming more important to atrophy of subcortical structures.22
iCL volume impacted subcortical gray matter and thalamic volume in patients with long-standing disease course and more profound disability. Although we found that iCL volume impacts subcortical gray matter and thalamic volumes in the SPMS subgroup, we had no iCL-negative patients with SPMS for comparison. In fact, the presence of cortical demyelination has been shown in pathology studies;23 however, MR imaging methods like the DIR sequence may not be sensitive enough to detect iCLs.24 Cortical pathology in our iCL-negative subgroup may not have been prominent enough to be detected with the DIR sequence, so in fact, this study may represent only a part of disease mechanisms due to technical limitations.
Because in the early stages of disease, white matter pathology predominates over cortical pathology,25 we suppose, that in this case, thalamic atrophy can be caused by distant damage of afferent or efferent thalamic fibers. This supposition is in line with previous MR imaging studies that supposed that atrophy of the subcortical gray matter structures preceded cortical atrophy in early MS.19,26 Rocca et al4 observed that white matter lesions contribute to thalamic tissue loss. In another study, Henry et al19 demonstrated that only WML in the region of thalamocortical fibers significantly correlated with thalamic atrophy in patients with clinically isolated syndrome.
Cortical demyelination becomes much more prominent in the chronic disease stages.17 iCLs can result in thalamic atrophy due to retrograde degeneration of thalamocortical radiations.14 This finding is in accordance with previously published neuropathologic and MR imaging that showed a correlation between cortical demyelination and cortical lesions with thalamic atrophy.14,18
Our study had some limitations. We had a rather small sample size (71 patients in total and 55 with iCLs). The design of the study was not prospective, so the dynamics of changes were not evaluated. A low number of patients with PPMS (4 subjects) made it impossible to perform multiple regression for this subgroup. In addition, we had no healthy controls or a control group of patients with other neurodegenerative disorders with pathology of the basal ganglia.
CONCLUSIONS
Thalamic atrophy was explained better by intracortical lesions, than by white matter lesions and T1 white matter hypointensities, especially in patients with disease duration of >5 years and EDSS scores of ≥4.0.
Footnotes
The study was supported by a research grant from the Russian Science Foundation (project No. 16-15-10203).
Disclosures: Ivan Kalinin—UNRELATED: Travel/Accommodations/Meeting Expenses Unrelated to Activities Listed: travel grants, Comments: ECTRIMS 2018, EAN 2019, 27th Annual Meeting of the Charcot Foundation 2019. Gleb Makshakov—RELATED: Grant: Russian Scientific Fund, Comments: Russian Scientific Fund grant application No. 16-15-203, received in 2016–2018*; UNRELATED: Payment for Lectures Including Service on Speakers Bureaus: Genzyme, Janssen, Roche, Comments: honoraria for lectures and speaking in the past 2 years; Travel/Accommodations/Meeting Expenses Unrelated to Activities Listed: travel grants, Comments: ECTRIMS 2015, 2016, 2017, 2018, and 2019 meetings. Evgeniy Evdoshenko—RELATED: Grant: Russian Science Foundation (Application No. 16-15-203), received in 2016–2018*; UNRELATED: Payment for Lectures Including Service on Speakers Bureaus: Merck, Biogen, Roche, Johnson & Johnson, Novartis, GlaxoSmithKline, Sanofi, Genzyme, Generium, Comments: honoraria for lectures and speaking in the past 2 years. *Money paid to the institution.
Indicates open access to non-subscribers at www.ajnr.org
References
- Received December 12, 2019.
- Accepted after revision February 27, 2020.
- © 2020 by American Journal of Neuroradiology


