
Abstract
BACKGROUND AND PURPOSE: Studies consistently report lower ADC values in isocitrate dehydrogenase (IDH) wild-type gliomas than in IDH mutant tumors, but their methods and thresholds vary. This research aimed to compare volumetric and regional ADC measurement techniques for glioma genotyping, with a focus on IDH status prediction.
MATERIALS AND METHODS: Treatment-naïve World Health Organization grade II and III gliomas were analyzed by 3 neuroradiologist readers blinded to tissue results. ADC minimum and mean ROIs were defined in tumor and in normal-appearing white matter to calculate normalized values. T2-weighted tumor VOIs were registered to ADC maps with histogram parameters (mean, 2nd and 5th percentiles) extracted. Nonparametric testing (eta2 and ANOVA) was performed to identify associations between ADC metrics and glioma genotypes. Logistic regression was used to probe the ability of VOI and ROI metrics to predict IDH status.
RESULTS: The study included 283 patients with 79 IDH wild-type and 204 IDH mutant gliomas. Across the study population, IDH status was most accurately predicted by ROI mean normalized ADC and VOI mean normalized ADC, with areas under the curve of 0.83 and 0.82, respectively. The results for ROI-based genotyping of nonenhancing and solid-patchy enhancing gliomas were comparable with volumetric parameters (area under the curve = 0.81–0.84). In rim-enhancing, centrally necrotic tumors (n = 23), only volumetric measurements were predictive (0.90).
CONCLUSIONS: Regional normalized mean ADC measurements are noninferior to volumetric segmentation for defining solid glioma IDH status. Partially necrotic, rim-enhancing tumors are unsuitable for ROI assessment and may benefit from volumetric ADC quantification.
ABBREVIATIONS:
- AUC
- area under the curve
- NAWM
- normal-appearing white matter
- min
- minimum
- 1p19qcodel
- codeletion of the short arm of chromosome 1 and the long arm of chromosome 19
- rADC
- normalized ADC
- WHO
- World Health Organization
Diffuse gliomas of World Health Organization (WHO) grades II and III comprise a diverse group of tumors characterized by distinct genetic profiles and varied median survival.1 Three major types of diffuse gliomas are found in adults: isocitrate dehydrogenase (IDH) wild-type gliomas with a molecular profile of IDH wild-type glioblastoma, IDH mutant astrocytoma (with p53 and ATRX chromatin remodeler [ATRX] mutations), and the IDH mutant oligodendroglioma with a codeletion of the short arm of chromosome 1p and the long arm of chromosome 19q (IDH mutant/1p19qcodel).2 In addition to these major intrinsic neoplasms, multiple other tumor types exist, for example, with alterations in the map kinase pathway (B-Raf proto-oncogene, serine/threonine kinase [BRAF] mutations), histone mutations, and the distinct group of ependymal tumors.
IDH wild-type astrocytomas share glioblastoma-specific genetic mutations such as combined chromosome 7 gain and chromosome 10 loss, epidermal growth factor receptor (EGFR) amplification, and/or telomerase reverse transcriptase (TERT) promoter mutations3 and have a short life expectancy.3,4 Henceforth, with the term “IDH wild-type diffuse glioma,” we will refer to molecular glioblastoma, IDH wild-type.
Rapid glioma genotyping is of prognostic importance and influences therapeutic planning; for example, IDH mutant/1p19qcodel gliomas are responsive to chemotherapy,5 whereas in 1p19q intact (IDH mutant/1p19q intact) tumors, maximum safe resection appears critical to improve outcomes.6 It remains uncertain to what extent the strategy of maximal glioblastoma resection7,8 could prolong survival for diffusely infiltrative IDH wild-type gliomas in the WHO grade II and III stages.
A number of imaging techniques have shown the potential for glioma genotype predictions. Of these, conventional MR imaging has the advantage of universal availability, but mostly provides visual-anatomic features, some of which have limited reproducibility.9,10 Advanced MR imaging techniques such as perfusion and spectroscopy provide physiologic, quantifiable tumor data but can have threshold overlap and lack of technical standardization.11
DWI is widely integrated into clinical glioma MR imaging protocols with tissue properties measurable at the time of reporting. DWI exploits the inverse relationship between free water motion in tissues and cellularity.12 Differences in diffusion-weighted image signals have been shown for glioma WHO grades and, more recently, between genetic subtypes.13,14 The finding of lower ADC values in IDH wild-type diffuse glioma compared with IDH mutant tumors is consistently reported; however, the methods and accuracy vary among studies, whereby published techniques include mean and minimum ROI measurements and, in some cases, volumetric ADC quantification.13⇓⇓-16 Hypothetically, “entire lesion” analysis might provide the most representative information on any individual tumor, whereas ROI placements have the advantage of being minimally time-consuming in clinical workflow.
There are few data comparing regional and volumetric diffusivity measurements for glioma genotyping, currently limited to nonenhancing glioma evaluation. The purpose of this study was to compare the performance of whole-tumor ADC measurements with different ROI parameters for glioma molecular typing, with a focus on IDH status prediction.
MATERIALS and METHODS
Patients
Ethics review board approval (University College London Hospitals and Health Research Authority, United Kingdom) was obtained with informed consent waived for this retrospective imaging data study. Consecutive patients diagnosed at our national brain tumor referral institution from July 2008 to January 2018 were eligible for the research.
Inclusion criteria consisted of histologic confirmation of WHO grade II and III glioma, documented IDH and 1p19q genetic test results, and available pretreatment MR imaging. Exclusion criteria were previous glioma treatment; a diagnosis other than WHO grade II and III gliomas; incomplete, inconclusive, or ambiguous molecular results (eg, IDH wild-type/1p19qcodel); a prolonged (≥ year) interval from MR imaging to surgery; incomplete images; and failed volumetric image registration.
All tissue samples were analyzed at our neuropathology department, using the latest methodology according to the WHO 2016 Classification of CNS Tumors, as described previously.17,18 Multiple gene Sanger sequencing was completed for IDH R132H-negative tumors to identify rarer IDH mutations, and the 1p/19q status was established through quantitative polymerase chain reaction–based copy number assay.
MR Imaging Acquisition and Postprocessing
All MR imaging examinations included T2-weighted, T2-FLAIR, and T1-weighted sequences; pre- and postadministration of a gadolinium-based contrast agent; and DWI sequences (n = 211 at 1.5T, n = 79 at 3T). Because our institution is a quaternary center, the imaging originated from 23 different MR imaging machines with no individual scanner contributing >14% of any glioma subtype. In the generation of an ADC map, the image acquired without diffusion gradients is divided by the image acquired with diffusion gradients, removing dependence on T1, T2, and TR.19 Sufficient comparability of ADC among scanners has been demonstrated previously.20 The range of MR imaging parameters used has been described in a prior component of the study.21 ADC maps were calculated from 3-directional DWI acquired with 2 gradient values (b = 0 and b = 1000 s/mm2) using proprietary software (Olea Sphere, Version 2.3; Olea Medical).
ROI Measurements
The ADC regional measurements were performed by 3 independent observers as detailed in Maynard et al,21 blinded to tissue diagnosis. First, each observer sited small (30–40 mm2) ROIs 3× into the visually perceived lowest ADC portions of each glioma (within ≥1 axial image slice), while remaining in the solid tumor component and avoiding apparent necrotic, hemorrhagic, or cystic areas or blood vessels, as identified on the relevant accompanying contrast-enhanced and other sequences. From these 3 ROIs, the mean value of the numerically lowest ADC measurement was designated minimum ADC (ADCmin) as described in Xing et al.14
Thereafter, 1 large ROI (ADCmean) was placed to cover most of the largest axial tumor cross-section, excluding tumor margins, necrosis, macroscopic hemorrhage, and calcifications, as described in Thust et al.22 Finally, a comparative ROI was positioned in the contralateral normal-appearing centrum semiovale white matter (ADCNAWM), amounting to 5 ROI measurements per patient. Multifocal tumors were measured as 1 glioma.
Observer 1 analyzed all (n = 290) gliomas, observer 2 re-analyzed a subset of 75 gliomas, and observer 3 re-analyzed the remaining subset of 215 gliomas, totaling 2900 ADC measurements (ie, 5 ROIs by 2 observers per glioma, ie, 10 × 290 measurements). From these, the normalized minimum ADC (rADCmin, defined as ADCmin/ADCNAWM ratio) and the mean normalized ADC (rADCmean) (defined as ADCmean/ADCNAWM ratio) were calculated, resulting in 4 regional ADC parameters (ROI ADCmin, ROI rADCmin, ROI ADCmean, and ROI rADCmean) per glioma. An example of the ROI placements is shown in Fig 1A–D.

An example of regional and volumetric ADC measurements in a patient with IDH mutant 1p19q intact glioma. T2-weighted image (A) and ADC maps (B–D) show ADCmin (3 × 30–40 mm2 (black, B and C), ADCmean (white, C), and ADCNAWM (white, D) ROI measurements. T2-weighted image (E) and ADC map (F) in the same patient demonstrate the volumetric segmentation and image registration, respectively.
Volumetric ADC Histogram Analysis
Whole-tumor VOIs were segmented by a general radiologist (M.B., 5 years’ experience) using the ITK-Snap Toolbox, Version 3.6 (www.itksnap.org23) following training and under supervision of a neuroradiologist specialized in brain tumor imaging (S.C.T, 9 years’ experience). Segmentations incorporated the entire T2-weighted signal abnormality. For multicentric gliomas, the total volume of signal abnormality was treated as 1 lesion. To assess interobserver reproducibility, a proportion (10%) of gliomas was randomly chosen to undergo a repeat unsupervised segmentation by a second neuroradiologist (J.A.M., 4 years’ experience, including brain tumor research).
ADC maps were then co-registered to T2-weighted sequences using the FMRIB Linear Image Registration Tool (FLIRT; http://www.fmrib.ox.ac.uk/fsl/fslwiki/FLIRT),24,25 according to an affine 12-parameter model with the correlation ratio as a cost function, except in 15 cases in which manual review favored optimization of the registration by substitution of Normalized Mutual Information as the cost function. Subsequently, ADC histogram data were obtained for each tumor ROI, using an in-house script written in Python 2.7. For each tumor, the second and fifth ADC histogram percentiles, ADC mean, and the T2-weighted total lesion volume were extracted. Normalized histogram parameters were calculated using the same ROI ADCNAWM value for the regional measurements to maximize direct comparability. An example of the volumetric segmentation is provided in Fig 1E, -F.
Enhancement Pattern Subgroup Analysis
Information on tumor enhancement, recorded as part of a preceding study,21 was used for a subgroup analysis. Thus, the ability of ROI and VOI parameters to predict the IDH genotype was assessed separately for 3 morphologic groups: 1) nonenhancing, 2) solid-patchy enhancing, and 3) rim-enhancing, centrally necrotic gliomas. An example of the enhancement pattern distinction is provided in the Online Supplemental Data.
Statistical Analysis
All statistical testing was performed in SPSS 25 (IBM). The interobserver agreement for the ROI-derived ADC measurements and for the volumetric segmentations was assessed by intraclass correlation coefficient analysis, using a 2-way random effects model. For each ADC ROI, the mean of the observers’ measurements was adopted as the final value. For the proportion of tumors that were segmented by 2 observers, the average of the volumetric ADC results was designated as the final value.
To compare the mean ranks of the groups of ADC values and glioma subtypes, we used the nonparametric Kruskal-Wallis ANOVA test, including the Dunn pair-wise comparisons with Bonferroni correction. The strength of the association between glioma subtype and ADC metrics was tested using eta2 (η2), which quantifies the percentage of variance in the dependent variable (ADC value) that is explained by >1 independent variable (glioma genotype).
Univariable logistic regression was applied to test which ROI or VOI ADC parameter best predicted glioma IDH status (with P < .05 considered significant). The Youden index was used to identify diagnostic thresholds for the most predictive parameter, as determined by the area under the curve (AUC). Nonparametric (Wilcoxon signed rank) testing was performed to assess differences between the region-derived and volumetric ADC values.
RESULTS
Patient Demographics
Of 515 patients identified as potentially eligible for the study, 42 were duplicates, and 190 met the exclusion criteria as follows: previous glioma treatment (n = 60), tumor other than WHO grade II or III glioma (n = 43 and n = 1 spinal cord tumor), ambiguous or incomplete molecular results (n = 29), no preoperative DWI (n = 24 and n = 15 ADC maps not computable), unavailable histopathology report (n = 2), prolonged (≥ 1 year) interval from MR imaging to surgery (n = 3), MRI artefact (n = 5), incomplete images (n = 1), and failed volumetric image registration (n = 7). Finally, 283 patients (median, 40 years of age; interquartile range, 33–53 years; 164 men) were included in the analysis. The demographic details for the study population are listed in the Table.
Patient demographics, IDH, and 1p19q genotypes of the study population
Observer Comparison
The reproducibility of the ROI ADC parameters and contrast-enhancement patterns among 3 independent raters has been established in preceding research (intraclass correlation coefficient = 0.83–0.96 and Cohen κ = 0.69–0.72, respectively).21 In the current study, the concordance between the 2 observers for the twice-segmented tumor volumes (n = 28) was near-complete (intraclass correlation coefficient = 0.97–0.98). This information is further detailed in the Online Supplemental Data.
Association between ADC Values and IDH Genotype
Box and whisker plots showing a comparison between IDH mutant and IDH wild-type gliomas for ADCmean, rADCmean, ADCmin, and rADCmin are shown in the Online Supplemental Data (VOI and ROI methods). Detailed results from the statistical analysis with Kruskal-Wallis and η2 tests are provided in the Online Supplemental Data. For all regional parameters (ROI ADCmin, ROI rADCmin, ROI ADCmean, and ROI rADCmean), the ADC values significantly differed among the IDH wild-type, IDH mutant, 1p19q intact, and IDH mutant 1p19qcodel glioma groups (P < .001). VOI ADCmean and VOI rADCmean also differed among the glioma molecular groups (P < .001).
VOI ADCmin and VOI rADCmin differed between IDH wild-type and IDH mutant 1p19qcodel genotypes (P = .003 and P < .001, respectively). However, no significant difference in VOI ADCmin or VOI rADCmin was shown between IDH mutant 1p19q intact and IDH mutant 1p19qcodel gliomas.
Wilcoxon signed rank testing confirmed statistically significant differences between the VOI and ROI results of the absolute and normalized ADC values (P < .001). The association between glioma genotype and diffusivity was strongest for ROI ADCmean and ROI rADCmean values (η2 = 0.38) across the study population, while also being substantial for ROI ADCmin and ROI rADCmin (η2 = 0.28–0.29).
The subgroup analysis according to the contrast-enhancement pattern revealed associations between ROI ADCmean and ROI rADCmean values and genotype for nonenhancing gliomas (n = 170, η2 = 0.39–0.41) and solid-patchy enhancing gliomas (n = 85, η2 = 0.24–0.28). No association was evident between ROI ADC parameters and the rim-enhancing, centrally necrotic glioma IDH genotype (n = 23, η2 = 0.0–0.05). The strongest association for the rim-enhancing gliomas was with VOI rADCmean values (η2 = 0.36).
No correlation among IDH status, VOI ADCmin, and VOI rADCmin was identified for nonenhancing gliomas (η2 = 0.02–0.03). Across all regional and volumetric parameters, smaller η2 effect sizes were observed for minimum ADC values compared with mean ADC values. The VOI ADCmin was tested as determined by either the 2nd or 5th percentile by histogram analysis, with consistently larger η2 values observed between ADCmin and genotype when the 5th percentile was used. Thereafter, VOI ADCmin referred to the 5th percentile only.
Univariable Analysis for Prediction of IDH Status
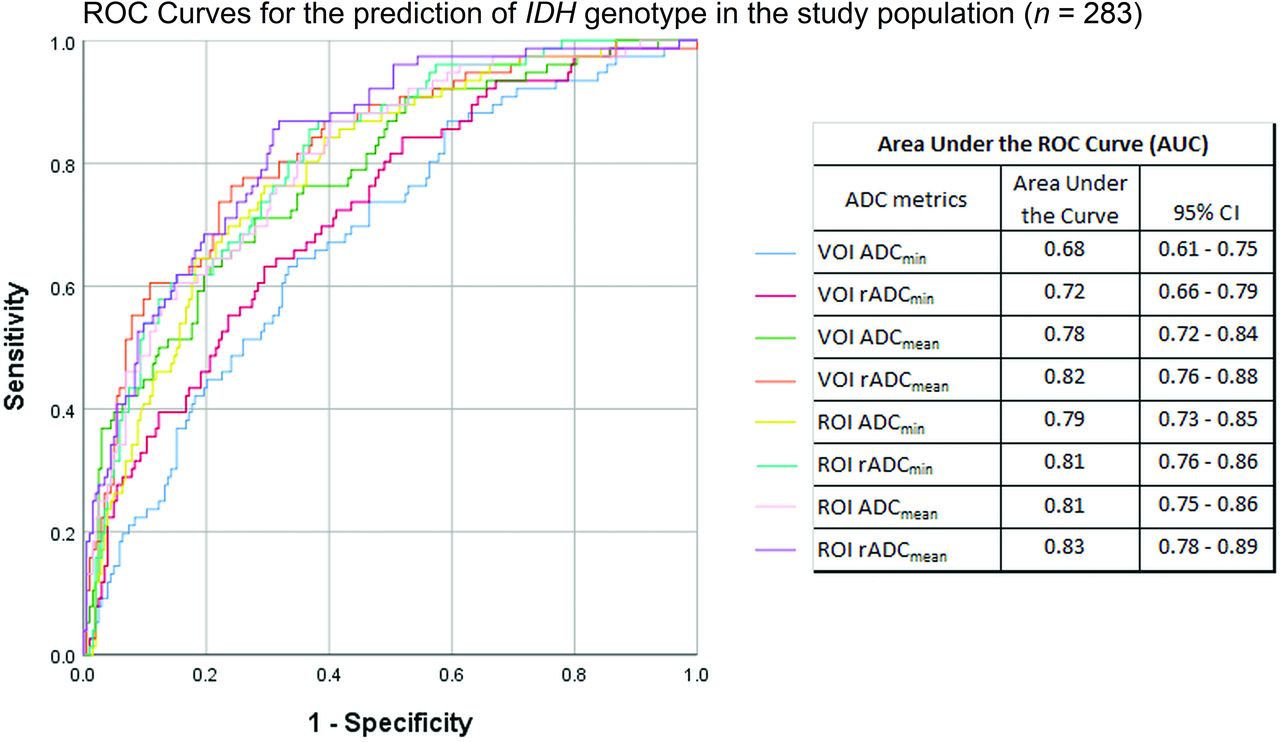
The univariable analysis of regional and volumetric ADC metrics, when compared across all (n = 283) gliomas, showed that the most accurate prediction of IDH status was achieved using ROI rADCmean or VOI rADCmean (AUC = 0.83 and 0.82, respectively). The least accurate predictions were observed for VOI ADCmin (AUC = 0.68) and VOI rADCmin (AUC = 0.72). The ROC curve analysis is presented in Fig 2, with additional results listed in the Online Supplemental Data.

ROC curves for the prediction of IDH genotype in the study population (n = 283).
When assessing nonenhancing gliomas alone, the ROI ADCmean (AUC = 0.82) and ROI rADCmean (AUC = 0.84) results were almost equal to the VOI ADCmean (AUC = 0.81) and VOI rADCmean (AUC = 0.84). For solid-patchy tumors, the ROI ADCmean (AUC = 0.79) and ROI rADCmean (AUC = 0.81) were almost equal to the VOI ADCmean (AUC = 0.78) and VOI rADCmean (AUC = 0.80), respectively.
Conversely, in rim-enhancing centrally necrotic lesions, only volumetric ADC results demonstrated a significant ability to predict IDH status (VOI ADCmean [AUC = 0.84], VOI rADCmean [AUC = 0.90]), but not the ROI ADCmean and ROI rADCmean values (AUC = 0.49–0.61). Given the lack of an association between the volumetric ADCmin parameters and IDH status, these were not further subjected to a subgroup analysis according to enhancement patterns.
DISCUSSION
This study investigated the comparability of region-derived and volumetric ADC values for WHO grade II and III glioma genotyping, specifically their performance for predicting IDH status. Our results indicate that the accuracy of regional measurements for solid glioma IDH typing is unimproved by performing whole-tumor segmentations (maximum AUC = 0.84 for VOI and ROI rADCmean). However, for IDH status prediction in the small proportion of rim-enhancing, centrally necrotic tumors (n = 23), entire lesion ADC mean parameters were superior to solid-tumor ROI measurements. Throughout the study, mean ADC measurements appeared more accurate than ADCmin metrics, particularly if performing a volumetric analysis.
Before the discovery of glioma molecular subgroups, research was focused on testing the ability of ADC to predict glioma histologic grades, showing an inverse correlation between cellularity and diffusion.26⇓-28 More recently, Leu et al13 demonstrated a stronger association between glioma ADC values and genotype than WHO grade. Specifically for IDH wild-type glioblastoma, no difference in diffusivity may exist between grades II and IV.29 Villaneuva-Meyer et al30 previously assessed ROI-derived minimum, mean, and maximum in WHO grade II gliomas: A minimum ADC threshold of 0.9 × 10⁻³ seconds/mm2 provided the greatest sensitivity (91%) and specificity (76%) for IDH typing, with an AUC of 0.901.19 ROI-based minimum ADC analysis was also performed by Wasserman et al15 with a proposed cutoff point of 0.95× 10⁻³ seconds/mm2 (sensitivity of 76.9%, specificity of 65.2%, and AUC = 0.711)13 and by Xing et al14 with a suggested minimum ADC threshold of 1.01× 10⁻³ seconds/mm2 (sensitivity of 76.9%, specificity of 82.6%, AUC = 0.87).15
By means of ROI measurements, ADCmin and rADCmin appeared valuable for IDH typing in our study, with optimal thresholds in the region of 1.07 × 10⁻³ seconds/mm2 (sensitivity of 82.3%, specificity of 61.3%, AUC = 0.79) and 1.40 (sensitivity of 85.5%, specificity of 62.3%, AUC = 0.81), respectively. For an ROI ADCmean threshold of 1.34 × 10⁻³ seconds/mm2, a similar sensitivity of 84.8%, specificity of 60.3%, and AUC of 0.81 were observed. For an rADCmean threshold of 1.75, the results were marginally better (sensitivity of 86.8%, specificity of 62.3, AUC = 0.83).
Across the whole study population, the largest ROI AUC (0.83) was observed for rADCmean values in our research. Liu et al16 previously assessed glioma mean and minimum ADC, but only the results for mean ADC reached statistical significance (P = .028). Recently, in a study of normalized mean measurements for IDH typing of non-gadolinium-enhancing WHO grades II and III gliomas, an rADCmean threshold in the region of 1.8 was proposed.22
Several studies reported lower ADC values in IDH mutant 1p19qcodel oligodendrogliomas compared with IDH mutant 1p19q intact astrocytomas, with 2 studies indicating an ADCmean threshold in the region of 1.4–1.6 × 10⁻³ seconds/mm2 for 1p19q genotyping.31,32 However, similar to the reduced specificity of elevated perfusion (blood volume), which may be observed in low-grade oligodendrogliomas, erroneously low ADC values can occur in this tumor type despite its relatively good prognosis. A potential influence from extracellular matrix components is probable.33 It is also noteworthy that measurements in calcified tumor components may underestimate ADC values and should be avoided.
From our results, it appears that ROI ADCmean and rADCmean are slightly superior to minimum ROI ADC measurements for IDH genotyping of WHO grade II and III gliomas. Similarly, Han et al34 investigated the variability of ADC values according to the ROI technique for glioma grading, with the mean ADC value of single-round ROI showing the highest effect size (0.72) and the greatest AUC (0.872), being superior to minimum measurements for the identification of high-grade gliomas. Within the aforementioned study, minimum ADC values also differed significantly between whole-volume and single-round ROI placements (P = .003),34 indicating that these are not interchangeable.
It has been shown that volumetric tumor diffusivity analysis is not necessarily superior to ROI placements, for example, for WHO grading.35 In 2 recent studies using ADC for H3 K27M histone-mutant glioma characterization, only the study using ROI measurements was predictive of genotype.36,37
It could be hypothesized that the previously reported lower accuracy of ADC for WHO grade IV glioblastoma IDH typing38 could be related to the foci of necrosis. However, in our current study, the best prediction of IDH status for such masses was achieved using VOI rADCmean values derived from segmentation inclusive of necrosis, as opposed to ROI measurement in solid lesion components. Indeed, our data suggest that partially necrotic tumors may benefit from a volumetric diffusivity (VOI rADCmean) assessment, but the small patient number (n = 23) in this subgroup is a limitation of our research. Furthermore, it is possible that in some cases of necrotic tumors, limited tissue sampling resulted in a WHO grade II and III diagnosis instead of glioblastoma.
Imperfections in the volumetric image registration at glioma margins due to ADC map distortion from susceptibility gradients and eddy current effects, which are not visible in the T2-weighted image data, could have contributed to volumetric minimum ADC measurements performing less well in our research.
While the binary discrimination of IDH wild-type from IDH mutant gliomas is imperfect, noninvasive identification of early glioblastoma stages could help prioritize tissue sampling in such circumstances in which observational management is initially favored or when waiting times to surgery could result in a diagnostic delay.
CONCLUSIONS
Regional diffusivity measurements are noninferior and are possibly preferable to volumetric histogram analysis for IDH status prediction of macroscopically solid WHO grade II and III gliomas. ROI rADCmean calculation is rapid and scanner-independent, thus easily introduced into clinical reporting. Partially necrotic, rim-enhancing lesions are unsuitable for ROI assessment and may benefit from volumetric ADC quantification for genotyping.
Footnotes
S.C. Thust, Z. Jaunmuktane, and S. Brandner are supported by the Department of Health’s National Institute of Health Research/Biomedical Research Center’s funding scheme to the University College London Hospitals. No specific grant is associated with this research.
S.C. Thust, J.A. Maynard, and M. Benenati contributed equally to this work.
Disclosures: Stefanie C. Thust—RELATED: Grant: National Institute of Health Research/Biomedical Research Center funding scheme, Comments: University College London/University College London Hospitals receive proportional funding through the UK National Institute of Health Research/Biomedical Research Center funding scheme. No specific grant number is associated with the presented research.* Hans Rolf Jäger—UNRELATED: Royalties: payment by Springer of £1000, Comments: payment for co-editing the textbook Clincal Neuroradiology, published by Springer in 2019. *Money paid to the institution.
Indicates open access to non-subscribers at www.ajnr.org
References
- Received July 11, 2020.
- Accepted after revision October 19, 2020.
- © 2021 by American Journal of Neuroradiology


