
Abstract
SUMMARY: This article will familiarize neuroradiologists with the pathophysiology, clinical findings, and standard MR imaging and PET imaging features of multiple forms of dementia as well as new emerging techniques. Cases were compiled from multiple institutions with the goal of improved diagnostic accuracy and improved patient care as well as information about biomarkers on the horizon. Dementia topics addressed include the following: Alzheimer disease, frontotemporal dementia, cerebral amyloid angiopathy, Lewy body dementia, Parkinson disease and Parkinson disease variants, amyotrophic lateral sclerosis, multisystem atrophy, Huntington disease vascular dementia, and Creutzfeldt-Jakob disease.
ABBREVIATIONS:
- AD
- Alzheimer disease
- CAA
- cerebral amyloid angiopathy
- CBD
- corticobasilar degeneration
- FTD
- frontotemporal dementia
- LBD
- Lewy body dementia
- MCI
- mild cognitive impairment
- MH
- microhemorrhages
- MSA
- multisystem atrophy
- PD
- Parkinson disease
- PSP
- progressive supranuclear palsy
- rsfMRI
- resting-state fMRI
In patients who present with cognitive impairment, obtaining MR imaging is standard practice, but PET strengthens interpretation. Neurodegenerative syndromes are diagnosed by clinical findings/Lumbar Puncture markers and not pathology, and they may overlap. This overview of neurodegenerative syndromes and their MR imaging/PET appearances includes Alzheimer disease (AD), frontotemporal dementia (FTD), cerebral amyloid angiopathy (CAA), Lewy body dementia (LBD), Parkinson disease (PD), amyotrophic lateral sclerosis, multisystem atrophy (MSA), progressive supranuclear palsy (PSP), corticobasilar degeneration (CBD), Huntington disease, vascular dementia, and Creutzfeldt-Jakob disease. The discussion includes newer MR imaging techniques (resting-state fMRI [rsfMRI]/task-based MR imaging), DTI, and iron deposition as well as novel nuclear medicine agents. Our goal was familiarization of neuroradiologists with nuclear medicine and molecular imaging diagnoses and novel imaging techniques. Institutional review board (University of North Carolina) approval and a waiver of patient consent was obtained (study No. 20–2089).
Alzheimer Disease
AD, the second most common neurodegenerative disorder after stroke, affects 10% of the population older than 65 years of age, and it is the sixth leading cause of death with US annual costs of $236 billion. Clinical symptom similarities hamper diagnosis, leading to a low 71%–87% sensitivity and 44%–71% specificity.1 Despite no cure, diagnosis is helpful because cholinesterase inhibitors delay cognitive decline, and there is the need for institutionalization and improved end-of-life planning.1
Molecular imaging modalities demonstrate elevated amyloid-β and τ proteins. Amyloid-β impacts synaptic function, while age-accumulating τ neurofibrillary tangles cause neuroinflammation and neurodegeneration and finally dementia.2,3 Additional causations include inflammatory microglial (M2) and poor amyloid-β clearance by astrocytes.3 Drugs targeting amyloid fail because of a long prodromal and asymptomatic inflammatory phase and other processes of AD, suggesting an urgent need for earlier diagnosis and better surrogate markers.2⇓⇓-5 Preventative measures include exercise and appropriate sleep (impact glymphatic system amyloid and τ removal)3,6 and diabetes and stress control (preventing inflammation and BBB disruption).3⇓⇓⇓-7 Tau formation and neuronal damage cascade also occur in Parkinson, amyotrophic lateral sclerosis, multiple sclerosis, and Huntington disease (Online Supplemental Data).8
Two AD forms exist, early (younger than 65 years of age, which is less common and associated with autosomal dominant Presenilin genes 1 and 2) and late-onset (older than 65 years of age). Predisposing factors for late-onset are female sex (related to metabolic differences and medium fatty acid chains), the APOE4 variant (a fat metabolism protein associated with increased amyloid deposition 1 decade before diagnosis; heterozygotes [3× risk]; homozygotes [15× risk]), and FDG-PET uptake reductions when asymptomatic.4,8 Trauma is also associated with in-creased τ and amyloid deposition and microhemorrhages (MHs).3,4,9 Tau formation spreads confluently via neurons and glia and neural networks in a prionlike manner, correlating with atrophy.4,6,7,10,11
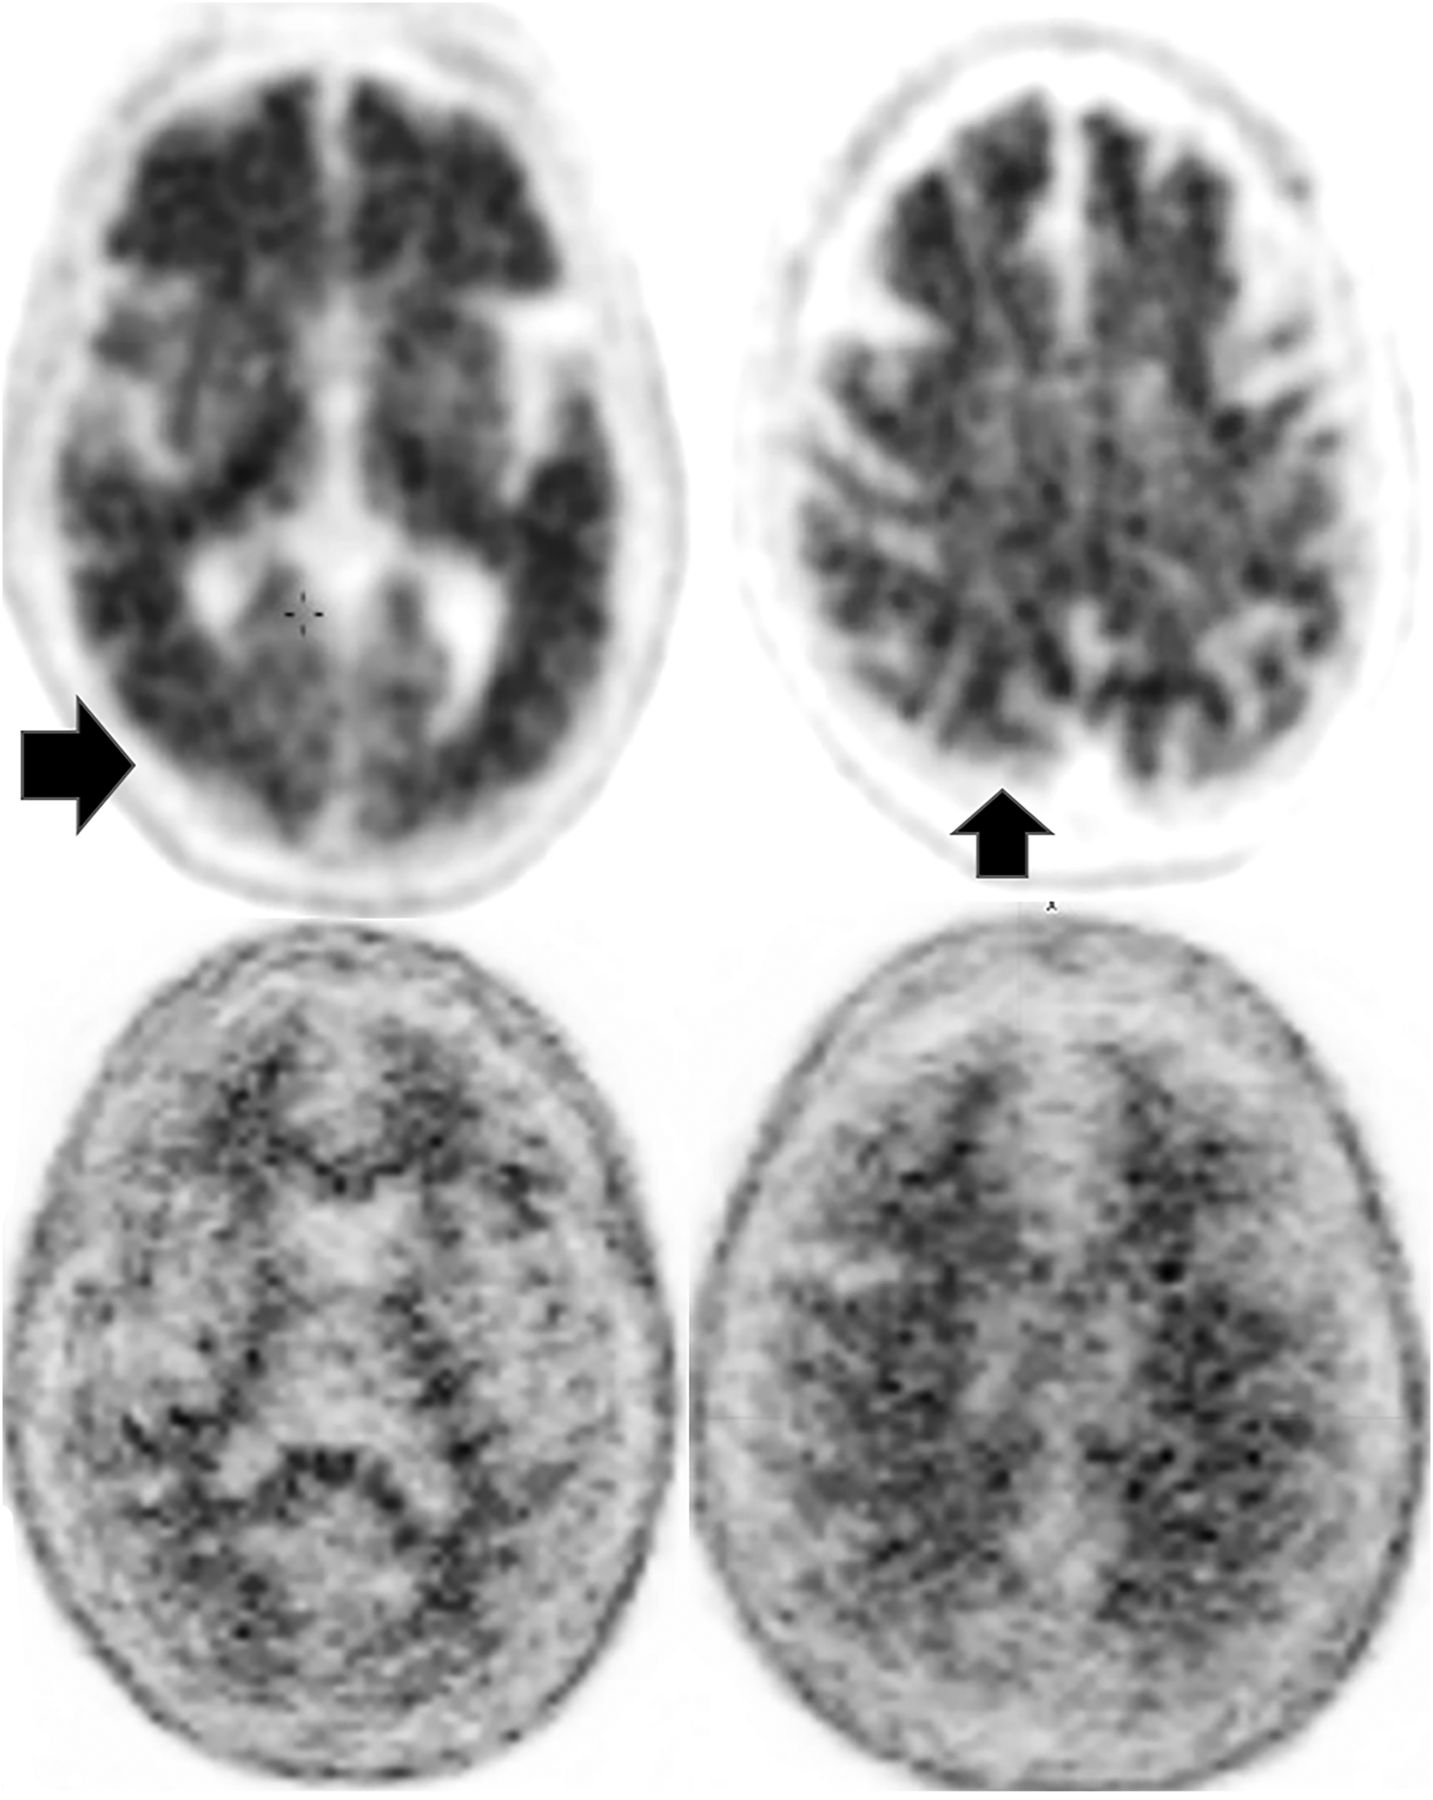
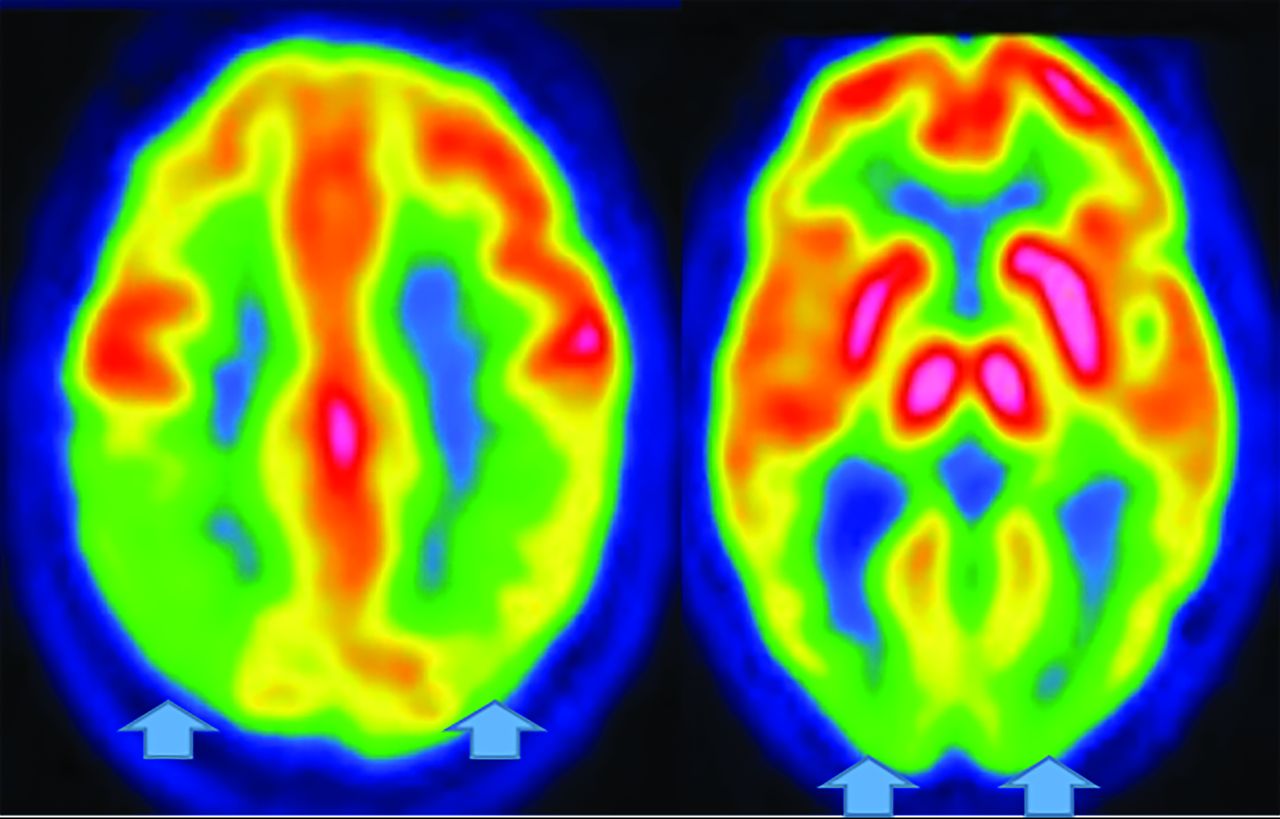
MR imaging demonstrates precuneus, parietal, hippocampal, entorhinal cortex, and temporal atrophy, with frontal lobe involvement in advanced cases. FDG-PET demonstrates de-creased temporoparietal uptake (sensitivity = 80%–93% and specificity = 60%–76%),3,11with possible decreased inferior parietal, frontal, lateral temporal, and precuneus uptake mirroring atrophy on MR imaging.12,13 Particularly specific PET findings include posterior cingulate involvement with occipital sparing (Fig 1).13 However, similar hypometabolism is seen in PD, bilateral parietal subdural hematomas, radiation, or vascular disease.8 Opinions vary with regard to FDG-PET use for conversion of mild cognitive impairment (MCI) to AD (sensitivity = 97% and specificity = 50%–76%),3,13⇓-15 while scans with negative findings indicating progression to AD are unlikely for 3 years.3

FDG-PET in a patient with AD demonstrates decreased bilateral parietal and temporal uptake (arrows). FDG uptake in the occipital lobe is preserved (not shown). The degree of abnormalities correlates with symptoms.
Amyloid deposition is associated with FDG-PET decline and precedes τ changes, which, in turn, precede abnormal glucose metabolism, all of which precede clinical symptomatology.3,4 Several tracers help visualize amyloid. Pittsburgh compound B (11C-P, 20-minute half-life) is logistically difficult and, hence, never reached commercial use.16 Longer half-life commercially available 18F tracers are the following: florbetapir (Amyvid), florbetaben (Vizamyl), and flutemetamol (Neuraceq). Recently, flortaucipir (Tavid) received FDA approval. A meta-analysis of florbetapir and florbetaben (89%–90% sensitivity and 87%–88% specificity) demonstrated no difference between agents.17 Data distinguishing AD and MCI, however, are mixed,17 with rates of PET positive for MCI intermediate between patients with AD and controls.14 Pooled (sensitivity and specificity) values of multiple methods of AD diagnosis versus controls are the following: MR imaging (visual inspection, 83/89), SPECT (80/85), FDG-PET (90–94/73–89), CSF amyloid-β (80/82), CSF T-τ (82/90) and p-τ (80/83), and 18F amyloid-β (90–92/84–100).3,17 This finding explains the poor diagnostic capability with 1 test and the need for improved methods of AD diagnosis.
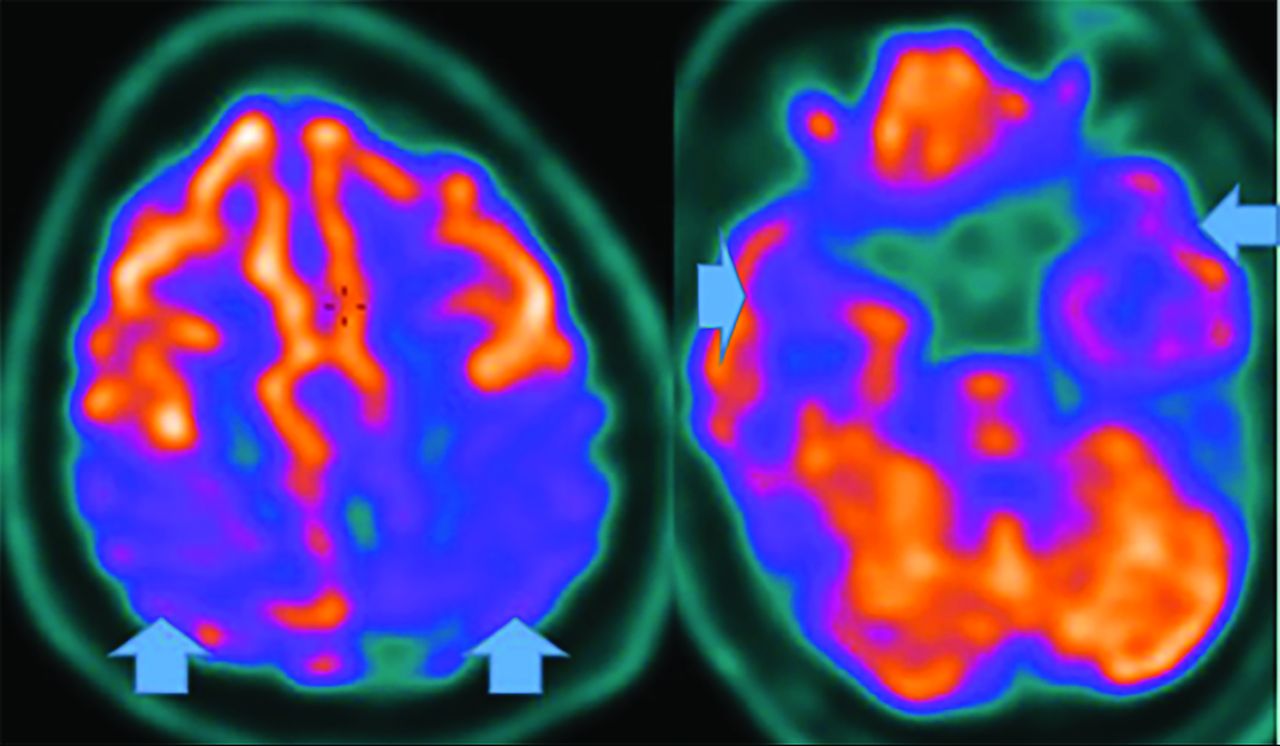
Amyloid-β demonstrates higher negative-than-positive predictive values because 25% of postmortem examinations of cognitively healthy individuals and 21% of cognitively healthy patients have deposition; however, lack of accumulation usually excludes AD and 50% of patients with AD can have other pathologies.8,17,18 Therefore, amyloid is a good exclusionary test but limited for severity stratification or progression depiction. Amyloid tracers in AD accumulate in the gray matter, while controls have primarily white matter uptake,19 producing GM-WM differentiation loss, particularly in the precuneus, posterior cingulate gyrus, and lateral-frontal and temporal lobes (Fig 2).20,21
Upper row: Abnormal florbetapir PET (arrows) shows diffuse cortical uptake with loss of GM-WM differentiation, indicating a high amyloid plaque burden. Lower row: A 65-year-old woman with MCI. Florbetapir scan demonstrates normal WM uptake without accumulation in the cortical gray matter, indicating no amyloid plaque. This finding effectively rules out AD (lower images courtesy of Dr Olga James, Duke University).
Unlike amyloid, which does not correlate with severity,3,22 τ uptake correlates strongly with cognitive impairment and dementia severity.3,22 Tau, particularly outside the medial temporal lobe is suspicious for AD, even in cases negative for amyloid (Fig 3).23 However, FTD, PD, PSP, CBD, traumatic encephalopathy, and Down syndrome also accumulate τ.3,22 Tau, unfortunately, has concentrations 5–20 times lower than amyloid, with amygdala and striatum off-target binding.22
Increased amyloid plaque burden in the posterior parietal and frontal lobes on florbetapir PET (left) with corresponding tracer uptake in the parietal lobes on tau PET images (right, arrows). Note that the τ tracer more clearly localizes to sites of neuronal damage. The pattern is most consistent with AD (images courtesy of Dr James Burke, Duke University).
AD MR imaging structural assessment reveals hippocampal (26%–27%), entorhinal (38%–40%), and thalamic and caudate volume loss (due to multinetwork connections), which is asymptomatic and precedes hippocampal loss and cortical atrophy.3,20,24 This feature is accompanied by increased DTI diffusivity.3,20,24 Volume loss of hippocampal regions with both NeuroQuant (https://www.cortechs.ai/products/neuroquant) and Neuroreader (https://brainreader.net/) is the single best prediction of AD from MCI at 3-year follow-up compared with other regions (Fig 4).24 T2 WM hyperintensity burden and the Fazekas score (particularly perivascular) show promise, correlating with Montreal Cognitive Assessment scores and amyloid burden, while negatively correlating with FDG-PET uptake.25⇓-27 T2 abnormalities occur 20 years before disease expression, particularly in late-myelinating regions secondary to neurodegeneration and poor oligodendrocyte repair.28 Additionally, iron SWI measurement, rsfMRI/task-based fMRI, arterial spin-labeling, MR spectroscopy (lower NAA and higher mIns), and DTI (reduced hippocampal, thalamic, and caudate anisotropy) are under investigation.4,20,25,27 In summary, WM burden predicts AD and cognitive decline and correlates with amyloid and τ CSF levels and decreased perfusion and abnormal DTI networks before atrophy or abnormal findings on FDG-PET.28
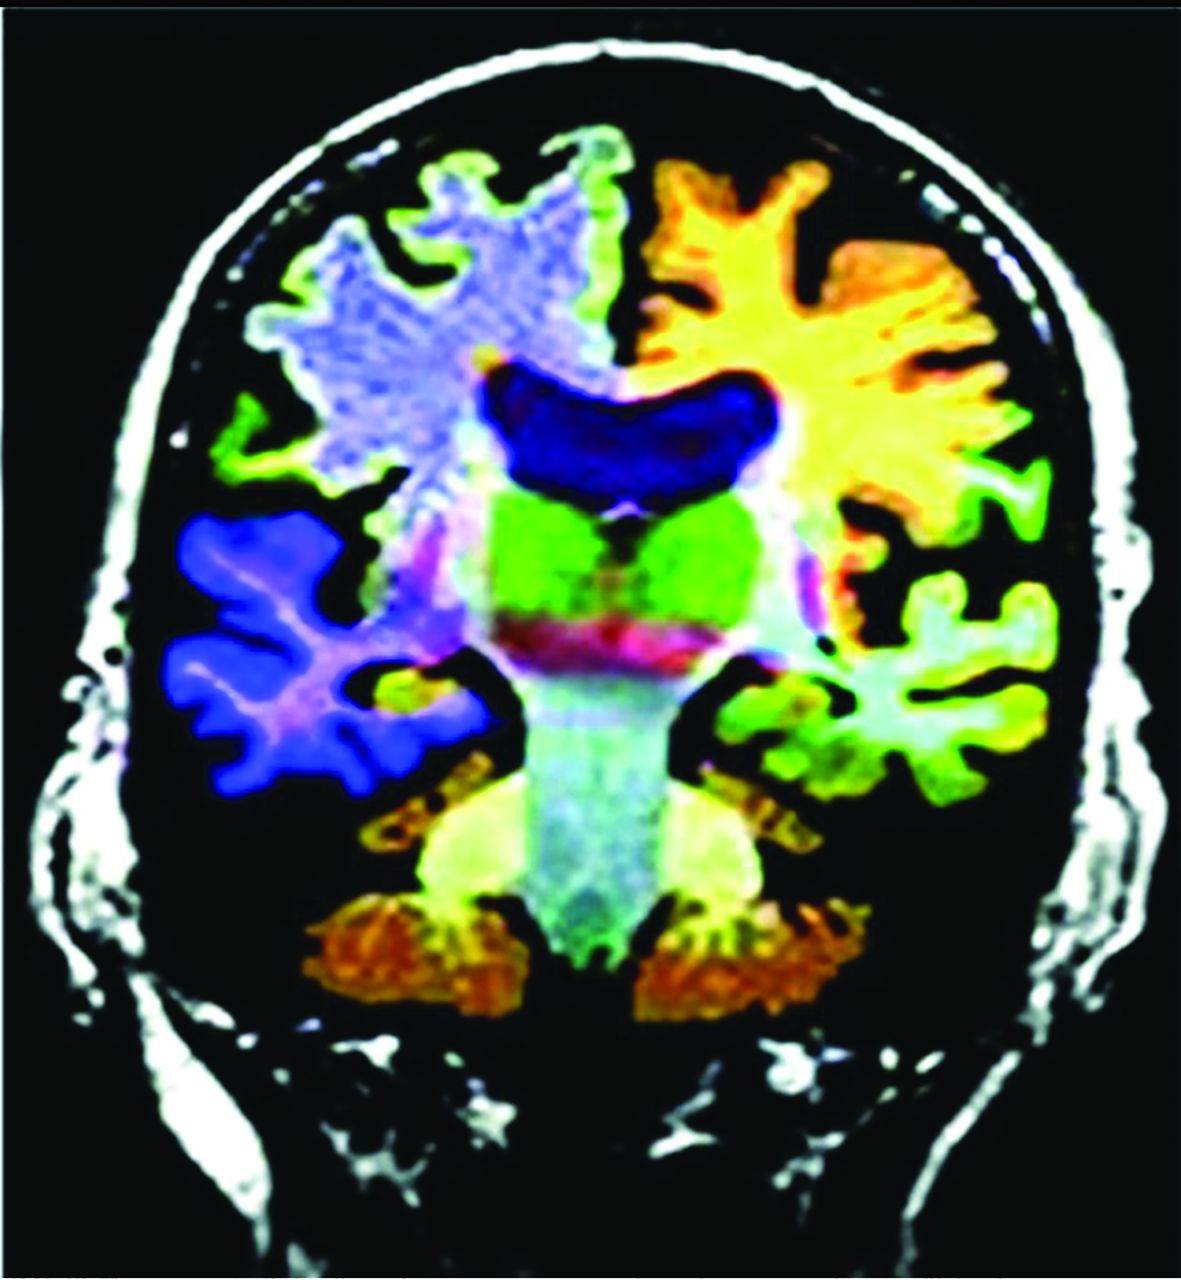
Commercial volumetric assessment shows lobar and deep, superficial GM differentiation by color for comparative analysis. For instance, the right frontal lobe GM is green, while the underlying WM is blue. This image was previously published in the American Journal of Neuroradiology. (Tanpitukpongse et al24).
A new possible surrogate marker is iron (Fe), because amyloid-β causes oliogodendrocyte toxicity, preventing myelin repair.28,29 Subsequently, Fe released during myelin breakdown creates phosphorylated-τ/τ.29,30 Additionally, rsfMRI and task-based MR imaging show potential, demonstrating impaired default mode network connectivity correlating with amyloid-β deposition,4,27,31,32 and frontoparietal and visual network hypoactivation in MCI relative to controls as well as visual, default, limbic, and dorsal and ventral attention network hypoactivation in AD relative to controls.32 Dynamic susceptibility contrast-enhanced and arterial spin-labeling MR imaging assessment is another focus of MR imaging research.3,27 New nuclear medicine tracers targeting dopamine and serotonin/cholinergic/GABAergic systems and microglial neuroinflammation (translocator protein agents correlate with amyloid) and astrocyte agents are under investigation.3,8,27,33 Unfortunately, translocator protein agents exhibit 3 genetic-related nucleotide polymorphisms affecting uptake, poor resolution, and more activity later rather than earlier in the disease process.3,8,27,33 [11C]-deuterium-l-deprenyl [11C]-DED and [11C]-deprenyl-D2 are less well-studied.3,8,25,27,33 Hopefully, the ongoing Alzheimer's Disease Neuroimaging Initiative 3 trial will yield answers with regard to these new methods.
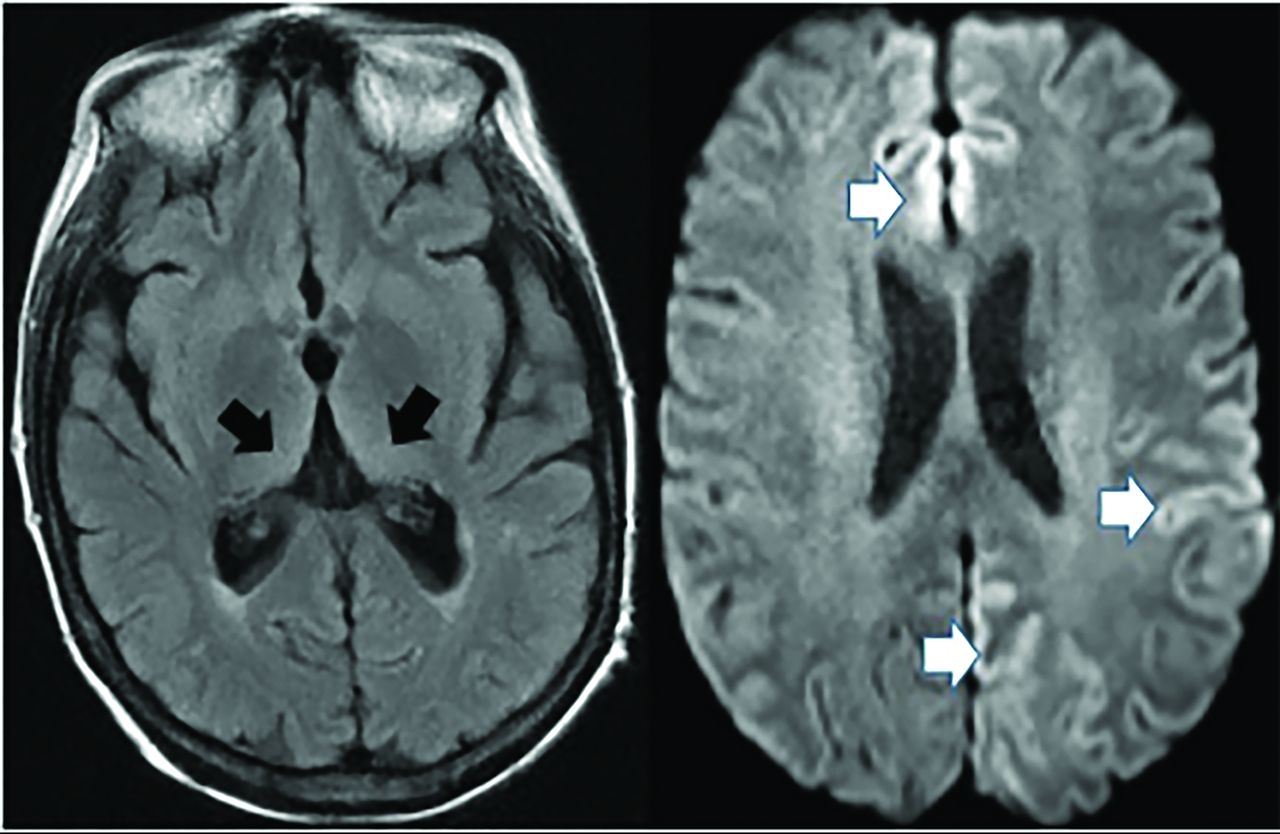
Posterior Cortical Atrophy.
Posterior cortical atrophy (an AD variant) presents with declining visual association skills affecting the lateral occipital lobes (unlike classic AD), while preserving the frontal lobes and caudate (unlike LBD), often with subtle MR imaging findings (Fig 5).34

Posterior cortical atrophy (AD variant) demonstrates preserved frontal and caudate but decreased lateral occipital and parietotemporal uptake (left, 2 color images), while an axial FLAIR (black and white), right MRI image demonstrates focal posterior parietal (arrows) and parieto-occipital atrophy (arrows). This patient demonstrated temporal sparing (not shown).
Frontotemporal Dementia
FTD demonstrates 3 variants: behavioral, semantic, and nonfluent agrammatic aphasia. Related syndromes include FTD motor neuron disease, PSP, and CBD, discussed separately. FTD neuropathology is variable, with τ, TAR DNA-binding protein 43/FET proteins, and sometimes amyloid (Online Supplemental Data).8,31,35
Behavioral variant FTD (the most common variant) shows progressive behavior and cognition deterioration; perseverative, stereotyped, compulsive and ritualistic behavior; and hyperorality and dietary changes, but it spares memory and visuospatial functions. MR imaging demonstrates frontal and anterior-temporal atrophy, while FDG-PET reveals decreased cortical medial-frontal, orbital-frontal, anterior cingulate, and frontoinsular uptake,35 with expected differences between frontal, behavioral (Fig 6), temporal, and semantic (Fig 7) variants.36 Anterior cingulate, temporal, caudate, and thalamic involvement is a key difference from AD and correlates with disease progression.33,37,38 FTD typically does not show amyloid uptake, but τ uptake has been seen.33

FTD. Frontal and behavioral variant demonstrates reduced bifrontal FDG-PET uptake (arrows). Also note the enlargement of the frontal horns of the lateral ventricles, a common finding.

FTD. Semantic and temporal variant demonstrates significant reduced bitemporal uptake (arrows) without reduced frontal FDG-PET uptake as seen in Fig 6.
Patients with the semantic variant demonstrate impaired confrontation naming, single-word comprehension, object knowledge, and surface dyslexia and dysgraphia, sparing speech production. MR imaging reveals anterior-temporal atrophy, correlating with FDG-PET and SPECT hypoperfusion and hypometabolism.35 Finally, patients with the nonfluent and agrammatic variant lack grammar and speech apraxia but have impaired complex-sentence comprehension, sparing single-word comprehension/object knowledge. MR imaging demonstrates left posterior, frontoinsular atrophy, while FDG-PET and SPECT depict hypoperfusion and hypometabolism in the same region.35
Newer MR imaging techniques demonstrate thalamic atrophy39 and DTI tract differences between the behavioral variant (uncinate fasciculus, genu, and cingulum) and Primary Progressive Aphasia, while AD shows increased fractional isotropy and mean diffusivity.40 Behavioral variant subtypes demonstrate regional prefrontal-cortical, anterior-temporal, insular, anterior cingulate, and striatum volume loss.40 Meanwhile, rsfMRI reveals re-duced salience network connectivity in the behavioral variant, abnormal executive dorsal attention-control and auditory networks, and increased default mode network connectivity, positively correlating with symptom severity.31 Additionally, Fe deposition assessment differentiates those with the behavioral variant from controls and those with the Primary Progressive Aphasia variant from those with the behavioral variant.41
Cerebral Amyloid Angiopathy
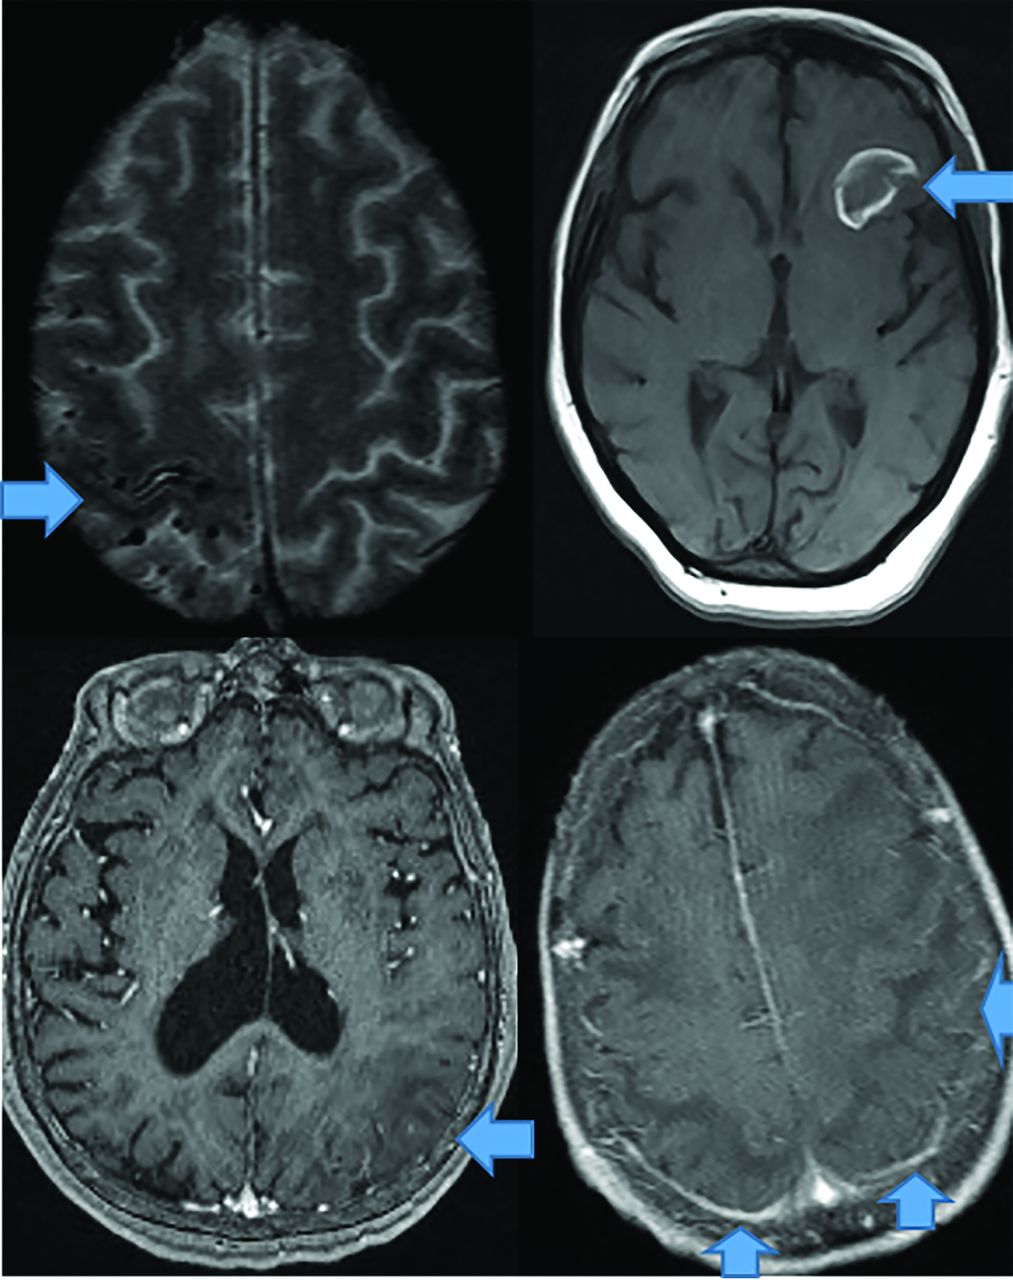
CAA dementia occurs in elderly normotensive individuals. Pathophysiologically, amyloid deposits in cortical and meningeal arterioles and capillary walls.42 Patients present with basal ganglia–sparing subcortical lobar MHs. There are 3 forms: classic, inflammatory, and amyloid-related angiitis.42,43 Patients with classic amyloid can demonstrate superficial siderosis, subarachnoid hemorrhage, and multiple MHs with posterior-predisposition T2 FLAIR changes (Fig 8) due to higher lipoprotein concentration.44 Inflammatory amyloid (poorest prognosis) exhibits clustered MHs, minimal enhancement, and significant mass effect (Fig 8). Amyloid-β-related angiitis, however, lacks mass effect but often has meningeal enhancement (Fig 8). Cerebral MHs correlate with neurologic deficits.45,46

CAA presents as multiple forms. In the classic CAA form (top left, axial T2), subarachnoid hemorrhage is common as seen at the arrow, on susceptibility weighted imaging with clustered right fronto-parietal MHs in the adjacent brain parenchyma. Large frontal parenchymal hemorrhages can also be seen in classic CAA (top right image, axial T1). The inflammatory cerebral amyloidosis type will demonstrate edema as seen in this case with left parietal edema/mass effect (bottom left, axial +C T1 at arrow). While the Amyloid-β related angitis variant commonly demonstrates dural/ leptomeningeal enhancement seen posteriorly (arrows), (bottom left image, axial +C T1 at arrow). Note the lack of mass effect in the Amyloid- β angitis variant.
Given the presence of amyloid, amyloid PET findings are often positive, but being negative excludes CAA42,45 (sensitivity = 77%–92% and specificity = 66%–88% versus controls);46 however, the more common AD may coexist.42 Hence, some authors propose an occipital-to-global amyloid ratio to differentiate CAA with regard to AD (AD spares the occipital lobes).46 Definitive FDG-PET CAA diagnosis awaits future research.
Parkinson Disease and Related Syndromes
PD presents with resting tremor and cognitive decline secondary to decreased pigmented, substantia nigra/pars compacta dopaminergic neurons, and α-synuclein protein intraneuronal Lewy body inclusions.47 T2 MR imaging shows an absent substantia nigra swallowtail sign, indistinctness, and Fe deposition.48
FDG-PET differentiates Parkinson disease from related dementias via decreased basal ganglia uptake,49 while 18F fluorodopa demonstrates de-creased striatal uptake.50 Parkinson disease appears similar to AD on FDG-PET, but with greater visual cortex involvement and relative medial-temporal cortex preservation.50 Amyloid and (less frequently) τ imaging is positive.51 The principal nuclear medicine study used to evaluate PD is 123I-ioflupane/DaTSCAN (GE Healthcare) SPECT (Fig 9) showing decreased putamen and caudate uptake.51

PD decreased putaminal > caudate head uptake results in the classic change from a “comma” (right image arrows) to a “period” (left image arrows) appearance. Note abnormal (left) and normal (right) findings on DaTSCANs.
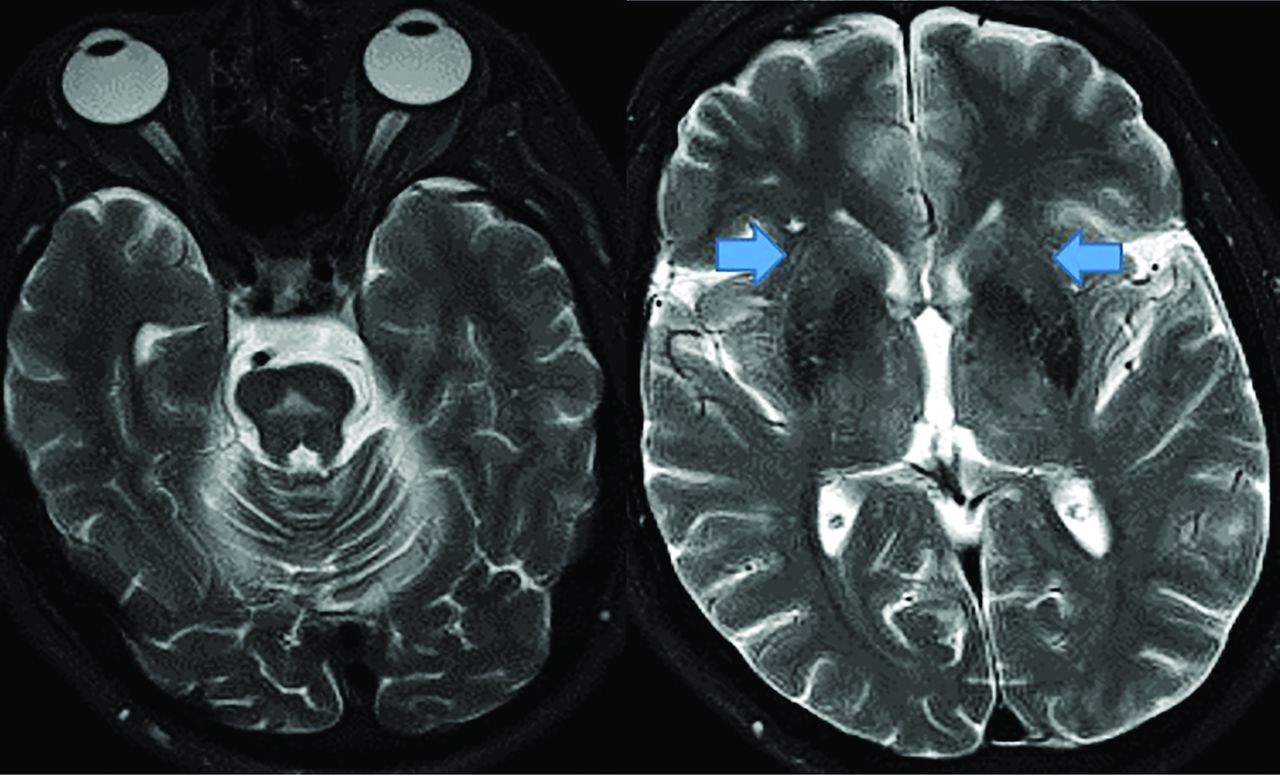
There are 3 PD variants: PSP, amyotrophic lateral sclerosis, and MSA. PSP (possibly an FTD variant) demonstrates anterior-midbrain convexity loss on sagittal views (hummingbird sign) with interpeduncular cistern widening, and patients demonstrate upward gaze paralysis.52 Amyotrophic lateral sclerosis demonstrates motor strip and corticospinal tract hyperintense T2 FLAIR signal secondary to Fe deposition (Fig 10). MSA presents with autonomic failure and a T2 brain stem “hot cross buns” configuration (Fig 11).52

Amyotrophic lateral sclerosis demonstrates significant bilateral precentral sulcus increased corticospinal tract FLAIR signal (arrows, axial image, left) and decreased axial T2 precentral sulcus signal, “motor band sign” (right, arrows) on MR imaging.
MSA demonstrates a pontine hot cross bun sign (left, axial T2 hyperintensity) with putaminal atrophy (right, arrows, axial T2).
Parkinsonian syndromes reveal decreased FDG-PET uptake; PSP in the medial frontal, premotor, prefrontal, brain stem, and thalamic regions; and MSA in the putamen, cerebellum, and brain stem regions (Fig 12).33,47,49 Finally, CBD demonstrates asymmetric decreased parietal and primary sensorimotor cortex, medial and lateral premotor, striatum, and thalamic uptake contralateral to clinical findings.33 PD may show cortical and striatal amyloid uptake.33 Tau tracers may accumulate in the inferior-temporal cortex in PD, while they are in the frontal-temporal, posterior-cingulate, subthalamic, midbrain, and cerebellar WM in PSP. In CBD, Tau uptake is seen in the frontal, and parietal cortex (not seen in MSA).33,52

MSA- Cerebellar FDG-PET reveals decreased medial frontal (left), thalamic (middle), and cerebellar (right) uptake (arrows).
With MR imaging, increased substantia nigra quantitative SWI suggests biomarker potential, as does prefrontal cortex and putamen Fe, which correlates with lower cognitive function.30,52,53 Likewise, rsfMRI default mode network assessment reveals altered striatum, motor, cerebellar, and basal ganglia connectivity, though disease heterogeneity inhibits biomarker progress.31,32
Lewy Body Dementia (DLB)
DLB α-synuclein pathology represents 15% of neurodegenerative disease, and like Parkinson disease, it sometimes exhibits amyloid and τ pathology.54 Indicative criteria (diagnostic if present) include radiologic biomarkers for DLB-reduced dopamine transport on DaTSCAN SPECT or fluorodopa PET, or low Metaiodobenzylguanidine (MIBG) cardiac uptake. Supportive criteria are relative CT/MR imaging medial temporal lobe preservation and low uptake on SPECT/PET perfusion and metabolism (FDG) imaging, with reduced generalized uptake, reduced occipital uptake, and cingulate preservation.55
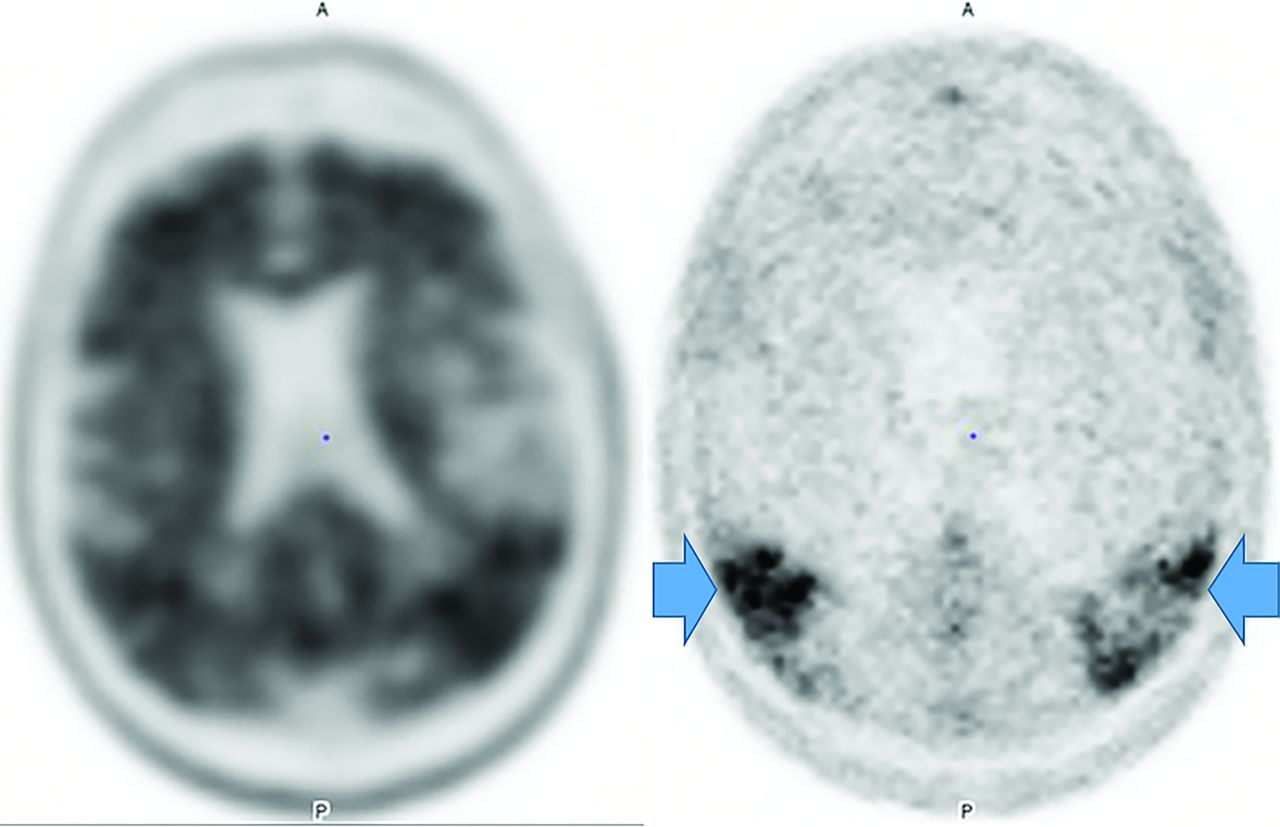
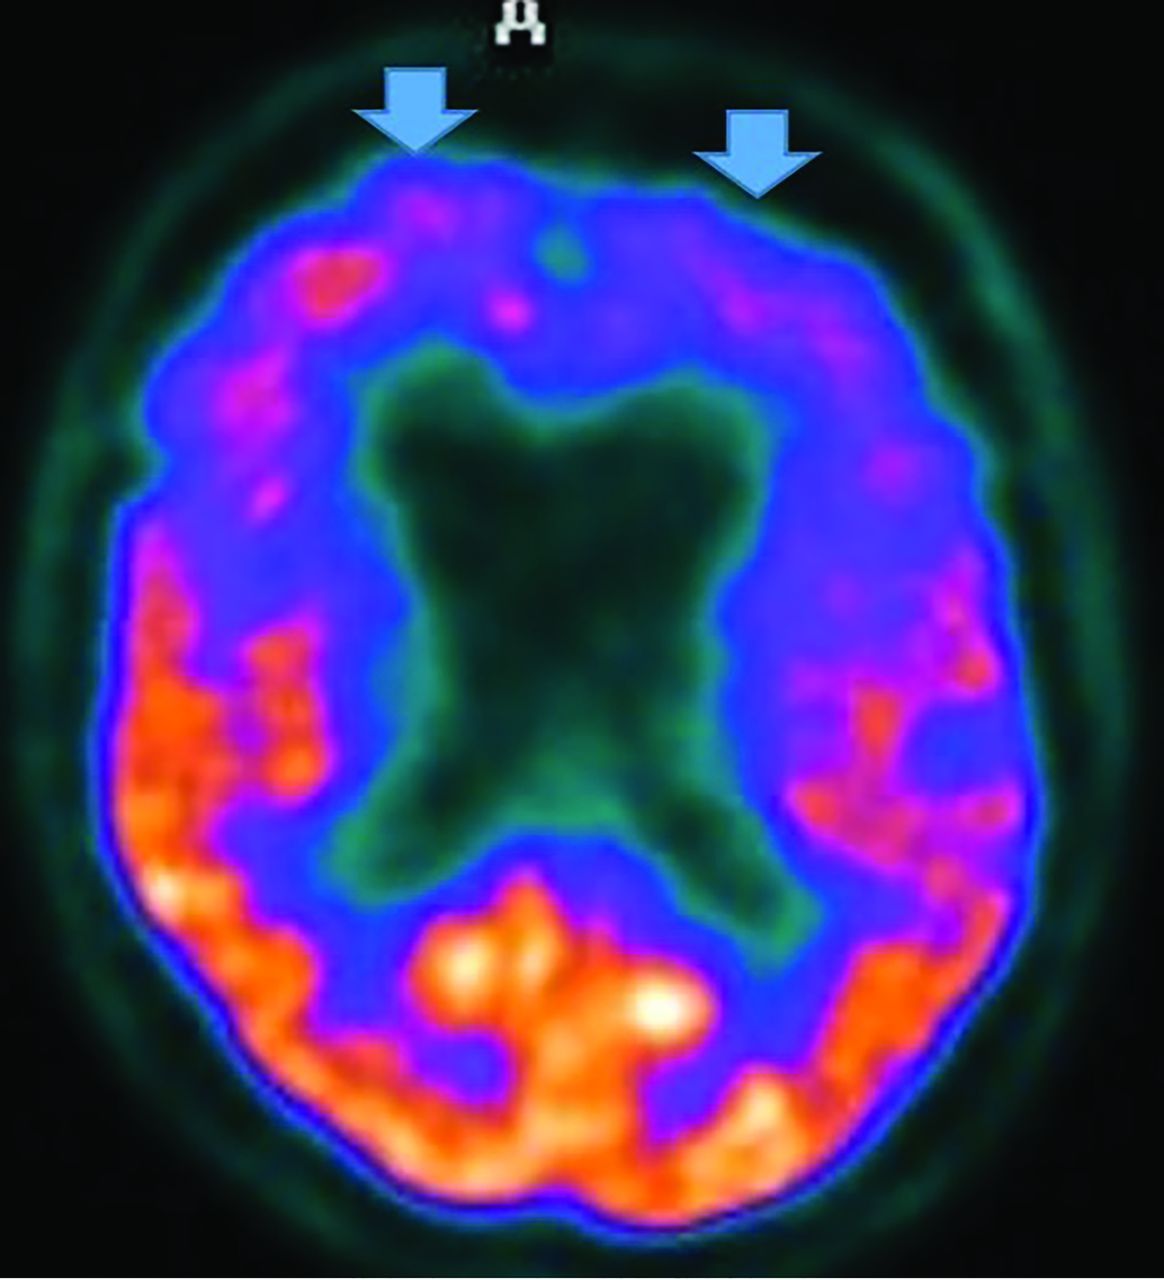
Regardless, FDG-PET demonstrates temporoparietal involvement. Unlike AD, the occipital lobes are not spared.56 The most sensitive PET finding is lateral-occipital cortex involvement (88%), while the most specific finding is posterior cingulate preservation (Fig 13).33 DaTSCAN SPECT (80% accurate for AD differetiation) shows decreased putamen > caudate uptake.54 123I Metaiodobenzylguanidine (MIBG) (catecholamine-receptor tracer) assessment shows decreased cardiac activity secondary to postganglionic-sympathetic cardiac innervation degeneration.54 Tau tracers show posterior-temporoparietal, occipital-cortical, and precuneus uptake.29 On MR imaging, medial-temporal preservation (regarding AD) is supportive but nonspecific, as is occipital hypometabolism and preserved posterior and midcingulate metabolism on FDG-PET (decreased posterior cingulate uptake is AD-specific).
DLB. FDG-PET reveals reduced posterior parietal and occipital activity (arrows), but preserved posterior cingulate uptake (images courtesy Dr. Daniel Silverman, University of California, Los Angeles).
Novel rsfMRI demonstrates widespread connectivity alterations without a current extent and disease localization consensus.31 Recently, the swallow tail sign was described in DLB.48
Huntington Disease
Huntington disease is a rare autosomal dominant disease demonstrating increased chromosome 4pCAG-trinucleotide repeats, increased gamma-aminobutyric acid, and neuronal loss. The more common adult form presents with chorea and dystonia, swallowing difficulty, abnormal and slow eye movements, and impaired gait and posture and balance. By the fourth-to-fifth decades, cognitive decline and word-finding difficulty and emotional lability are seen. Patients presenting at younger than 20 years of age have the rarer juvenile form.57
MR imaging demonstrates frontal horn box-shaped dilation and caudate atrophy. There are no nuclear medicine diagnostic findings, though FDG-PET demonstrates striatal and cortical hypometabolism with increased thalamus and occipital and cerebellar uptake.57⇓-60 rsfMRI exhibits visual, motor, and basal ganglia network abnormalities.32,40
Vascular Dementia
While strokes are more common than any other neurodegenerative disease, they rarely present in FDG-PET. MR imaging and PET reveal a sharp demarcation of involved arterial territories. If the frontal or internal capsule is affected, there may be loss of uptake and atrophy in the contralateral cerebellum (crossed-cerebellar diaschisis).34
Creutzfeldt-Jakob Disease
Creutzfeldt-Jakob disease causes rapid cognitive decline from altered prion protein accumulation, producing neurotoxicity and cortical/subcortical spongiform necrosis. On MR imaging, striatum and neocortex increased T2 FLAIR (medial-thalamic hockey-stick configuration) is noted, often also affecting the cortex (Fig 14). SPECT reveals widely inconsistent perfusion variations, and FDG-PET shows cortical and basal ganglia involvement in later stages.61

Creutzfeldt-Jakob disease demonstrates hockey stick configuration (black arrows), medial thalamic increased FLAIR (left axial image) as well as medial frontal, left parietal and occipital cortical increased signal (white arrows) (cortical ribbon sign, right axial image).
CONCLUSIONS
This article addresses clinical, pathologic, MR imaging, and PET findings, including new techniques, to educate the readership. Major differentiating MR imaging and PET and pathologic facts are summarized (Online Supplemental Data) to assist with greater understanding. Complicating imaging diagnosis are concomitant pathologies with similar abnormal metabolites.3,5 Hence, MR imaging techniques like atrophy analysis; MR spectroscopy; DTI;4,20,24 quantitative SWI Fe analysis in AD, FTD, PD, and LBD;2,9,30,41,48,53,54 and task-based/rsfMRI in AD, LBD, FTD, and PD4,24,27,31,32,37,40 are under investigation. Currently, direct comparisons of SWI and fMRI techniques with molecular imaging and clinical markers are lacking, possibly slowing diagnosis and understanding of disease progression. Also lacking are multitracer comparative studies, possibly cost-related and due to poor reimbursement by payors. However, newer techniques and radiotracers (τ [PI-2620], a cholinergic, dopaminergic, translocator protein) show needed great promise. Additionally, quantitative atrophy and WM burden analysis as a standard part of examinations with multifactorial analysis of molecular imaging (PET and MR imaging)3,24 and Lumbar Puncture findings like the “DuBois criteria” promise better accuracy and treatment development, both urgently needed in our aging society.4
ACKNOWLEDGMENTS
We thank Olga James, James Burkek, and Daniel Silverman for contribution of images.
Footnotes
Paper previously presented, in part, at: Annual AOCR Convention 2019, Merging Mind and Muscle, April 8-12, 2019, San Antonio, Texas.
Disclosures: Valerie L. Jewells—UNRELATED: Payment for Development of Educational Presentations: American Osteopathic College of Radiology, Comments: I gave a lecture on this topic and received a $250 stipend. Terence Z. Wong—RELATED: Consulting Fee or Honorarium: Lilly USA, LLC, Comments: In 2012, I served as a consultant to develop educational training materials for the interpretation of florbetapir scans (amyloid imaging for dementia).
Indicates open access to non-subscribers at www.ajnr.org
References
- Received April 4, 2020.
- Accepted after revision November 14, 2020.
- © 2021 by American Journal of Neuroradiology


