
Abstract
BACKGROUND AND PURPOSE: Quantitative volumetric segmentation of gliomas has important implications for diagnosis, treatment, and prognosis. We present a deep-learning model that accommodates automated preoperative and postoperative glioma segmentation with a pipeline for clinical implementation. Developed and engineered in concert, the work seeks to accelerate clinical realization of such tools.
MATERIALS AND METHODS: A deep learning model, autoencoder regularization–cascaded anisotropic, was developed, trained, and tested fusing key elements of autoencoder regularization with a cascaded anisotropic convolutional neural network. We constructed a dataset consisting of 437 cases with 40 cases reserved as a held-out test and the remainder split 80:20 for training and validation. We performed data augmentation and hyperparameter optimization and used a mean Dice score to evaluate against baseline models. To facilitate clinical adoption, we developed the model with an end-to-end pipeline including routing, preprocessing, and end-user interaction.
RESULTS: The autoencoder regularization–cascaded anisotropic model achieved median and mean Dice scores of 0.88/0.83 (SD, 0.09), 0.89/0.84 (SD, 0.08), and 0.81/0.72 (SD, 0.1) for whole-tumor, tumor core/resection cavity, and enhancing tumor subregions, respectively, including both preoperative and postoperative follow-up cases. The overall total processing time per case was ∼10 minutes, including data routing (∼1 minute), preprocessing (∼6 minute), segmentation (∼1–2 minute), and postprocessing (∼1 minute). Implementation challenges were discussed.
CONCLUSIONS: We show the feasibility and advantages of building a coordinated model with a clinical pipeline for the rapid and accurate deep learning segmentation of both preoperative and postoperative gliomas. The ability of the model to accommodate cases of postoperative glioma is clinically important for follow-up. An end-to-end approach, such as used here, may lead us toward successful clinical translation of tools for quantitative volume measures for glioma.
ABBREVIATIONS:
- AR
- autoencoder regularization
- BraTS
- Brain Tumor Segmentation
- CA
- cascaded anisotropic
- CNN
- convolutional neural network
- DL
- deep learning
- ET
- enhancing tumor
- HGG
- high-grade glioma
- LGG
- low-grade glioma
- NC
- necrotic core
- RC
- resection cavity
- T1ce
- T1 postcontrast
- TC
- tumor core
- WT
- whole tumor
There is a growing body of literature suggesting that machine learning may revolutionize the diagnosis, treatment, and follow-up of patients with gliomas, some of the most difficult malignancies to manage.1⇓-3 In the near-term, deep learning (DL) promises to facilitate rapid and user-independent quantitative tumor segmentation.4 There is evidence that accurate delineation of tumor subregions of enhancement and edema can form the basis for individualized, precision medicine such as predicting a response to therapy and survival,5 as well as aiding in streamlining radiation therapy planning.6
Thus far, the literature demonstrates proof of concept, showing state-of-the-art DL models using convolutional neural networks (CNNs) with moderately good median and mean Dice scores with respect to ground truth manual segmentations in the range of 0.74–0.85 and 0.61–0.77, respectively, for enhancing tumor.7⇓-9 Despite promising initial results, multisequence DL-based automatic glioma segmentation methods have yet to reach clinical practice, and several barriers to implementation exist.1,10⇓-12 Besides the requisite testing of models for accuracy and generalizability to local data,13 clinical implementation requires end-to-end solutions with streamlined preprocessing14 and integrated user interfaces as well as the ability to accommodate postoperative cases.7
All too often, machine learning models are developed isolated from the intended clinical environment, making it difficult to later engineer a clinical translation. Here, we present an end-to-end pipeline for development and implementation of an automatic segmentation tool for both preoperative and postoperative cases and discuss the strength and challenges of such an approach to development.
MATERIALS AND METHODS
Data Description
The study was approved by our institutional research ethics committee. Ground truth MR imaging data of manually segmented brain gliomas included 335 (259 high-grade glioma [HGG] and 76 low-grade glioma (LGG) preoperative cases from the Brain Tumor Segmentation (BraTS) 2019 open-access repository and an additional 102 cases from our local medical center, which included 62 postoperative (52 HGGs, 10 LGGs) and 40 preoperative (30 HGGs, 10 LGGs) cases. The postoperative cases consist of follow-up MRIs beginning typically at and beyond 3 months after initial resection that serve clinically as postoperative baselines and that are used to track disease progression/recurrence, respectively. Any scans performed in the immediate postsurgical (within 48 hours of surgery) period were not included. Since its inception in 2012, the BraTS, organized in conjunction with the Medical Image Computing and Computer-Assisted Interventions conferences, has been evaluating machine learning models for volumetric segmentation of gliomas on brain MRIs. The BraTS multi-institutional, international dataset, including data from 19 independent institutions, is widely used as a benchmark, containing manually segmented preoperative HGG and LGG across multiple vendors and machines.7,15,16 The dataset from our local institution does not overlap the BraTS data (our institution was not among the sites that originally contributed to the BraTS dataset) and is composed of histologically confirmed grade II–IV gliomas according to World Health Organization criteria (2007 or 2016 criteria, depending on whether the case occurred before or after 2016). Because these data are separate from the original BraTS data, we refer here to these data as the local dataset. Each glioma case consists of 4 different sequences (T1 precontrast, T1 postcontrast [T1ce], T2, and T2-FLAIR). Twenty preoperative and 20 postoperative cases were randomly selected from the local dataset for testing. The remainder of 397 cases were randomly split between training and validation datasets using an 80:20 ratio.
MR Imaging Protocol
Data belonging to the local dataset consisted of imaging performed on 3T scanners from 3 different scanner types (Magnetom Skyra, Magnetom Vida, and Magnetom Prisma; Siemens) and 5 imaging sites from a single vendor (Siemens) using our local, standard clinical brain tumor preoperative and postoperative MR imaging protocols consisting of the following pulse sequence parameters: 1) axial precontrast 2D T1-weighted: TE = 12 ms, TR = 715 ms, FOV = 256 × 256 mm2, flip angle = 8°, resolution = 1 × 1 mm, section thickness = 5 mm; 2) postcontrast 3D MPRAGE (∼5-minute interval between contrast injection and postcontrast acquisition): TE = 4 ms, TR = 2200 ms, FOV = 256 × 256 mm2, flip angle = 15°, isotropic resolution = 1 × 1 × 1 mm; 3) 3D T2 FLAIR sampling perfection with application-optimized contrasts by using different flip angle evolution (SPACE sequence; Siemens): TE = 325 ms, TR = 6000 ms, FOV = 256 × 232 mm2, flip angle = 120° using isotropic 1 × 1 × 1 mm voxels; and 4) T2-weighted imaging, preoperative studies including a 3D T2 SPACE: TE = 420 ms, TR = 3200 ms, FOV = 256 × 232 mm2, flip angle = 120°, isotropic 1 × 1 × 1 mm resolution. For postoperative, follow-up cases, we performed an axial 2D T2-weighted series: TE = 81 ms, TR = 5460 ms, FOV = 320 × 260 mm2, and flip angle = 120° using a nonisotropic voxel size of 1 × 1 × 5 mm. This difference was to practically accommodate existing clinical follow-up brain tumor protocols.
Manual Segmentation
Ground truth manual segmentation data from BraTS were established and verified by clinical experts and are described elsewhere.7,15,16 Ground truth manual segmentation of the 102 cases comprising the local dataset was performed using ITK-SNAP, Version 3.6.0 (http://itksnap.org).17 For manual segmentation, the following subregions were outlined following the established BraTS protocol: whole tumor (WT), tumor core (TC, which includes enhancing and nonenhancing portions of tumor as well as central cystic or necrotic regions), and enhancing tumor (ET).7 Note that for regions defined above, each subsequent region is a subregion of the previous one, with the following relationships: WT–TC = volume of peritumoral edema; TC–ET = the sum of nonenhancing tumor and any necrotic or cystic core (NC). In addition, we adapted this previously published BraTS segmentation paradigm to accommodate postoperative scans illustrated by the equation: TC–ET = nonenhancing tumor + NC + resection cavity (RC). Thus, the model was trained to derive the following 3 segments: WT, TC, and ET from which peritumoral edema, TC–ET, and ET can be calculated and presented to the end user. For manual segmentation, T1 MPRAGE was used for ET, and T2-FLAIR sequences were used for peritumoral edema as was done for the BraTS data. Coregistered T1 and T1ce images are used to differentiate ET from nonenhancing subacute blood products. Manual segmentations from all 102 cases were reviewed in consensus by 2 board-certified neuroradiologists with Certificates of Added Qualification and having 10 and 15 years of experience. The average time for manual segmentation of the tumor subregions per each case was approximately 1 hour.
Data Preprocessing
MR imaging volumes were converted to NIfTI format using “dcm2niix” (https://github.com/rordenlab/dcm2niix).18 DICOM is not typically used directly in machine learning training and conversion to a NIfTI format is a fairly standard and accepted method for handling image data because the conversion is lossless and there are good existing Python libraries for handling NIfTI. Precontrast T1, T2, and FLAIR MR images were coregistered to T1ce volume via rigid transformation with 6 df from FMRIB’s Linear Image Registration Tool (FLIRT; http://www.fmrib.ox.ac.uk/fsl/fslwiki/FLIRT). When 3D T2 SPACE was not available, we used only 2D T2. Skull-stripping in the patient’s space was performed using the Advanced Normalization Tools software package (ANTS; http://stnava.github.io/ANTs/) with a template from the LONI Probabilistic Brain Atlas (LPBA40) to eliminate superfluous data.19 The LPBA40 two dataset is composed of 40 healthy subjects and their corresponding manually labeled brain masks.20 Image intensities were normalized to a standard normal distribution (μ = 0, σ = 1).
Model Architecture and Postprocessing
Our model architecture fuses key elements from 2 of the top-ranked BraTS models that have made their source code publicly available: 1) a cascaded anisotropic CNN (CA-CNN), ranked number 2 in the 2017 BraTS Challenge;8 and 2) an autoencoder regularization (AR), ranked number 1 in the 2018 BraTS Challenge.9 These works are attributed originally to research groups from University College London, United Kingdom, and NVIDIA Corporation, respectively. We fused the autoencoder regularization with the cascaded CNN (AR-CA); a summary overview of the architecture is shown in Fig 1.

Summary of network architecture showing the combined use of triple CA-CNN8 and autoencoder regularization.9 Three networks hierarchically segment whole tumor (WNet), tumor core (TNet), and enhancing tumor (ENet) sequentially. These are structurally similar, and each network has a dilated ResNetlike block with the GroupNorm normalization, multiscale fusion, downsampling, and upsampling. ENet uses only 1 downsampling layer. The output of the segmentation decoder has 2 channels followed by a sigmoid for segmentation maps. The AC branch reconstructs the input image into itself and is used only during training to regularize the shared encoder.
The first step in the fused model involves using a framework combining CA-CNN and an additional branch of variational autoencoder to reconstruct the input image of a brain glioma for regularization consistent with the architecture described by Myronenko.9 In addition to the CA-CNN encoder backbone, there are 2 decoders: 1) a segmentation decoder that generates the segmentation maps for the 3 subregions: WT, TC, and ET; and 2) a variation decoder trained to reconstruct the input MR image used only during the training step. The encoder backbone is composed of 10 residual blocks with different dilations and 4 fused blocks. Each of these blocks contains 2 intraslice convolution layers with an intraslice 3 × 3 × 1 kernel. The input of a residual block is directly added to the output, encouraging the block to learn residual functions with reference to the input.8 The fused block has an interslice 1 × 1 × 3 kernel. Convolution layers with either of these kernels have C output channels, and each is followed by a batch normalization layer and a Parametric Rectified Linear Unit activation layer. The segmentation decoder upsamples the previous fused blocks, concatenates them, and produces a final block with 2 channels to generate the final binary prediction. The WT is first segmented (WNet); then the bounding box including the WT, which directly combines the 4 sequences (T1, T1ce, T2, and FLAIR), is used as multiview fusion input for the TC segmentation (TNet). On the basis of the obtained bounding box of the TC, the ET (ENet) is finally segmented. The segmentation results from 3 different orthogonal views (axial, coronal, and sagittal) are fused by averaging the softmax output to achieve higher accuracy for each individual network. Once the glioma was segmented, postprocessing steps for hole filling and island removal were performed followed by reconversion to DICOM. Hole filling fills holes smaller than 3 mm3 inside predicted tumors, while the island removal keeps only tumor components with volumes larger than 1/10 for WT, TC, and ET in each of the cascaded segmentation steps performed (WNet, TNet, and Enet, respectively). Reconversion to DICOM is performed on T1ce and FLAIR volumes in the axial plane using SimpleITK (https://simpleitk.org/). DICOM metadata are copied from the original corresponding series section by section.
Learning
All models, AR-CA and individual baseline models, were trained and tested using the same datasets as described above. We applied data augmentation by flipping and randomly applying volume center shifting and scaling (factor within 0.9–1.1). We tuned and optimized network hyperparameters: learning rate, optimization function, drop-out rate, batch size (number of images simultaneously processed during training), number of epochs (full training cycles), Adam optimizer for gradient descent optimization,21 and Δ and patience of the early stop. The early stop is a mechanism to preemptively stop training when the increase in performance on the validation set (Δ) becomes too small for a certain time (patience). To prevent overfitting, we applied the Parametric Rectified Linear Units activation function. All calculations were done on a single NVIDIA Tesla V100 SXM2 32 GB of memory (https://www.nvidia.com/en-gb/data-center/tesla-v100/). A hyperparameter tuning loop typically took ∼18 hours and was performed using the validation data. Three hundred epochs were trained by setting the learning rate to 0.001 and the decay rate to 0.01, with a 3-epoch interval to derive the optimal validation Dice scores. The code was implemented in Python 3.6 with Pytorch 1.2 (https://pypi.org/project/pytorch-pipeline/).
Model Assessment
The accuracy of the output of the DL segmentation model was compared with expert manual segmentation of subregions using the Dice score and the Jaccard index, and all cases were visually inspected. The Dice score and Jaccard index are mathematically related similarity indices [Jaccard index = Dice/(2-Dice)] ranging between 0 and 1, where 1 corresponds to perfect agreement. The distributions of the preoperative and postoperative tumor volumes are given in the Online Supplemental Data. Comparison is made of the AR-CA model performance on the test dataset against both original implementations of the CA-CNN and AR as baseline models.
Pipeline Implementation
For clinical implementation of automatic tumor segmentation, an end-to-end pipeline was constructed to identify and route the MR imaging DICOM of patients with glioma, perform the file conversion and necessary preprocessing steps, run the DL-based model, and push quantitative results to clinical viewing.
RESULTS
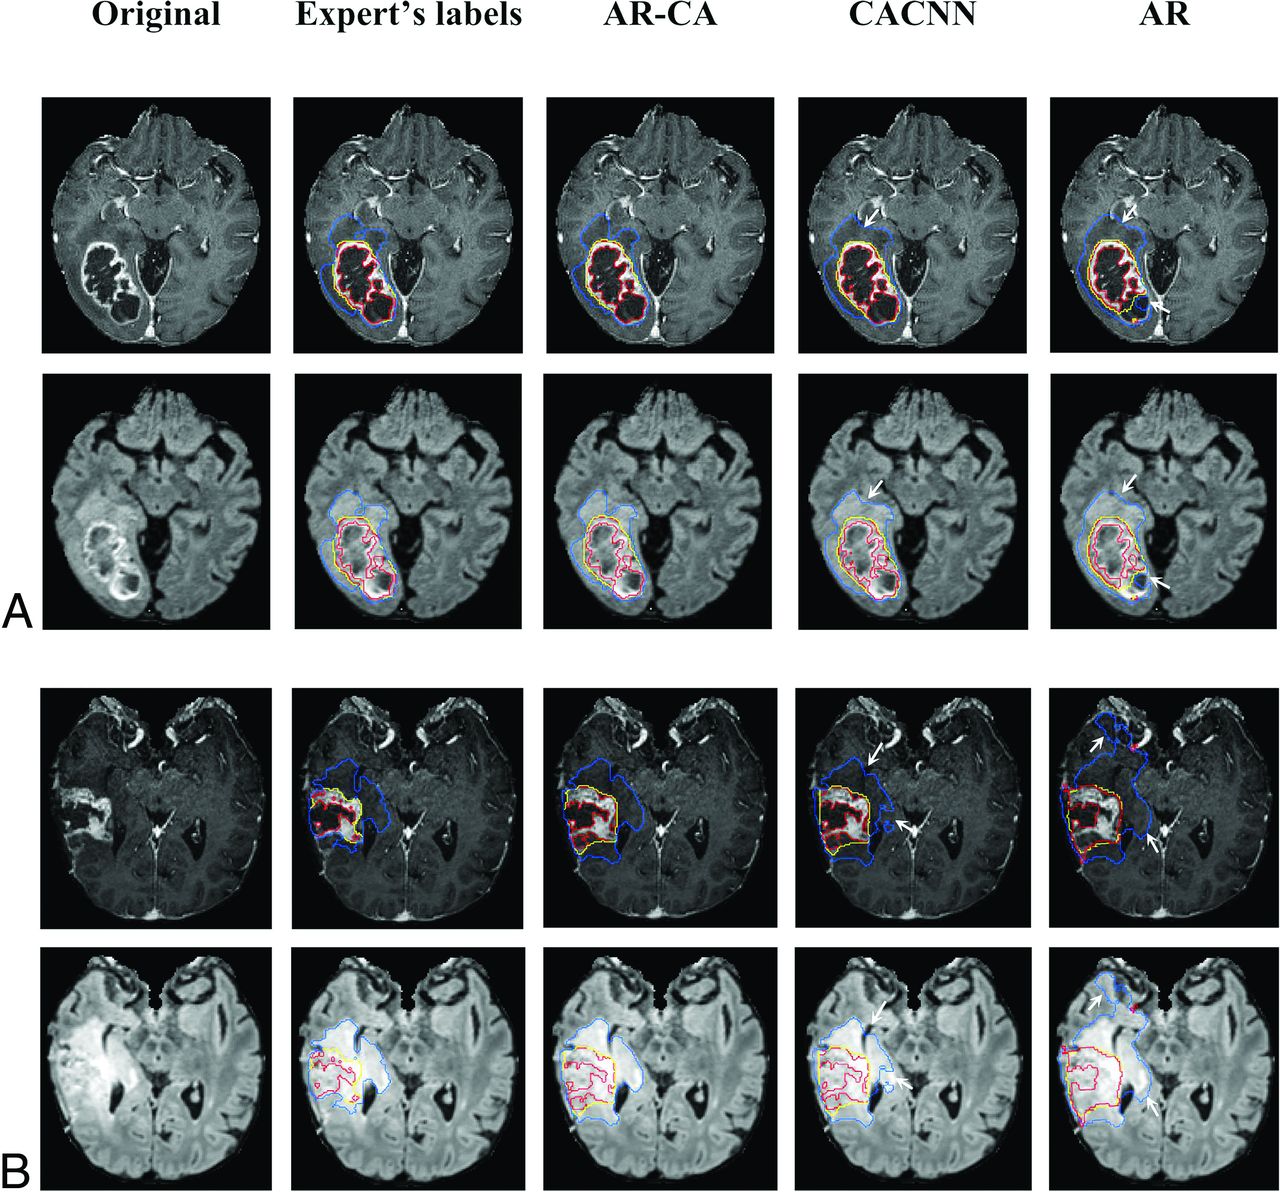
The Table and the Online Supplemental Data outline mean and median Dice scores and Jaccard indices, respectively, in 40 test cases for the fusion model, AR-CA, and the baseline models CA-CNN and AR, compared against the expert manual segmentations for WT, TC, and ET subregions. Preoperative and postoperative cases are reported separately. In general, there is an overlap in performance among these approaches in terms of Dice scores for both pre- and postoperative cases, with the highest mean and median values achieved using the combination approach in the fusion model compared with the 2 individual baseline models, which inform its main architecture (Table).8,9 Most important, our results were achieved across different machines across multiple imaging sites (Online Supplemental Data). Segmentation labels computed by baseline and AR-CA models compared against ground truth manual segmentation are shown on representative preoperative and postoperative test cases in Fig 2.
| Model | Dice Score, Preoperative Cases (Median/Mean [SD]) | Dice Score, Postoperative Cases (Median/Mean [SD]) | ||||
|---|---|---|---|---|---|---|
| WT | TC | ET | WT | TC | ET | |
| AR-CA | 0.91/0.88/0.09a | 0.91/0.79/0.23a | 0.87/0.75/0.27a | 0.84/0.83/0.08a | 0.86/0.84/0.06a | 0.74/0.72/0.12a |
| CA-CNN8 | 0.90/0.85/0.11 | 0.91/0.83/0.17 | 0.84/0.70/0.31 | 0.80/0.80/0.14 | 0.84/0.81/0.07 | 0.69/0.67/0.14 |
| AR9 | 0.87/0.84/0.09 | 0.82/0.72/0.12 | 0.71/0.68/0.21 | 0.82/0.75/0.14 | 0.63/0.63/0.2 | 0.66/0.61/0.16 |
Note:—TC indicates tumor core, including nonenhancing tumor, necrotic or cystic central regions and, in the case of postoperative cases, the resection cavity.
↵a Best-performing model in terms of median Dice scores.
Median and mean Dice scores for AR-CA model and 2 baseline models compared against expert manual segmentations for preoperative and postoperative test glioma cases

Segmentation labels computed using the AR-CA model and 2 baseline models for comparison, shown here with the ground truth expert manual segmentation on representative preoperative (A) and postoperative (B) glioma (at 5-months’ follow-up) test cases. Segmented tumor regions overlaid on postcontrast 3D MPRAGE and 3D SPACE FLAIR. The blue mask denotes the whole tumor (peritumoral edema and tumor core); the yellow mask denotes the tumor core (nonenhancing, necrotic tumor/resection cavity, and enhancing portions of the tumor); and the red mask denotes the enhancing tumor. Arrows mark areas of overestimation or underestimation of peritumoral edema by the baseline models compared with the AR-CA model and the ground truth segmentations.
Pipeline Implementation
An overview of the implementation pipeline framework is shown in Fig 3. The pipeline operates by using 2 servers: one for data transmission and the other for inference. The former is responsible for routing of images to the inference server and pushing its output back to the PACS. The inference server contains 3 modules: 1) the preprocessor for image conversion to NIfTI, skull-stripping, and coregistration among series; 2) segmentation using the fusion model, AR-CA, to produce segmentation for ET, TC, and WT;7 and 3) the postprocessor for tumor ROI volume quantification including island removal and hole-filling operations, followed by reverse conversion back to DICOM. The overall total processing time for 1 case was ∼10 minutes including data routing (∼1 minute), preprocessing (∼6 minutes), segmentation (∼1–2 minutes), and postprocessing (∼1 minute).
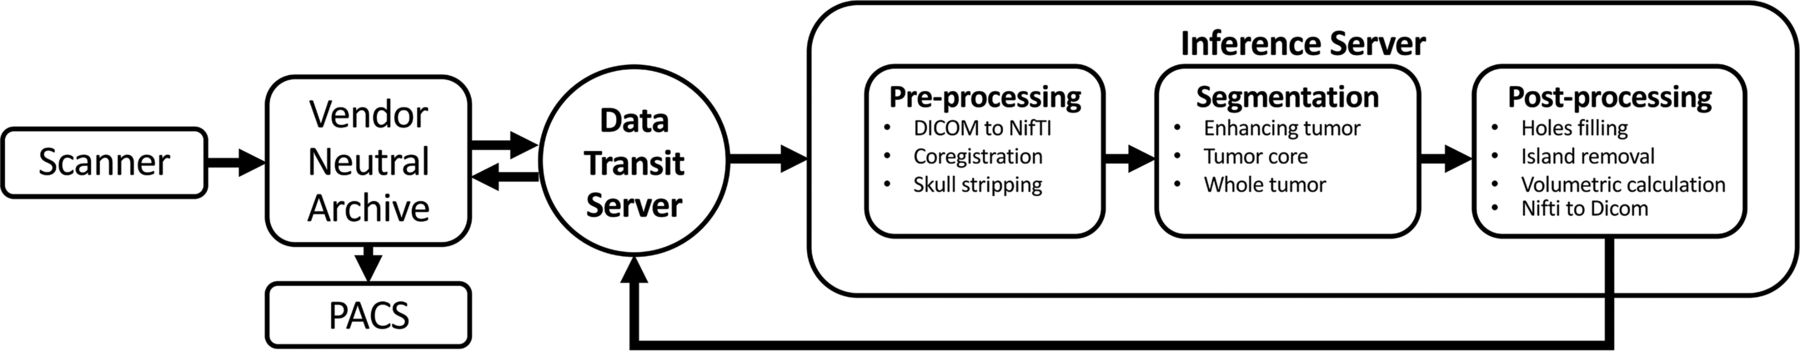
Schematic visualization of the implementation pipeline. An end-to-end pipeline was built to automate routing of relevant DICOM series from the MR imaging scanner through a vendor-neutral archive server to the inference server where preprocessing, automatic segmentation, and postprocessing tasks are executed. Thereafter, output results are sent back to the PACS for viewing using the data-transmit server again. Overall total processing time for 1 case is about 10 minutes including data routing (∼1 minute), preprocessing (∼6 minutes), segmentation (∼1–2 minutes), and postprocessing (∼1 minute).
DISCUSSION
We present an open source, end-to-end pipeline for fully automatic volumetric segmentation of both pre- and postoperative gliomas and describe the required measures for practical integrated implementation to routine clinical workflow. The AR-CA model described here is inspired by a fusion of key model elements from 2 publicly available top-ranked BraTS models that were designed to segment preoperative gliomas. We retrained on an enlarged cohort that also included postoperative follow-up imaging, achieving high performance on both preoperative and postoperative cases. In fact, this fused model enhanced via hyperparameter optimization and data augmentation resulted in higher Dice scores overall compared with results obtained by individual original top-ranked BraTS models.8,9
An automatic volumetric approach to measuring tumor burden may offer notable advantages over 1D and 2D methods commonly used for glioma measurement and ultimately may even achieve better performance than manual segmentations. Indeed, a recent randomized and blinded comparison study using a data base of 741 glioma cases reported a better qualitative performance of the DL-based segmentation algorithm compared with human raters, with a mean Dice score of 0.87 for the whole tumor.22 There is evidence that volumetric measures provide more accurate and consistent estimation with better prediction of overall survival, especially for HGGs in light of their often complex shape.23⇓⇓-26 Specifically, postoperative contrast-enhancing tumor volume is strongly associated with overall survival and progression-free survival in patients with glioblastoma.23,27
Until to now, there have been few attempts to use DL to segment postoperative MR images of patients with gliomas.10⇓-12,15 Most of these works do not address identification of the surgical cavity and achieve maximal Dice scores of 0.65–0.7 for postoperative cases. More recently, Ermiş et al,6 developed a dedicated DL-based model for automatic segmentation of the RC in a cohort of 30 postoperative patients with HGGs. They noted that the model may be helpful for postoperative radiation therapy with effective time-savings, though the results were still suboptimal compared with human raters. Chang et al10 developed a DL automatic algorithm based on 3D U-Net architecture for volumetric segmentation of brain gliomas, which includes 2 subregions: FLAIR hyperintensity and T1 contrast-enhancing, omitting NC and RC subregions. They used a cohort of preoperative (n = 293) and postoperative (n = 54) patients with gliomas and found high agreement between manual raters and automatic volumetric segmentation with reported Dice scores of 0.696 and 0.701 for the enhancing tumor and peritumoral edema, respectively. In that work, the surgical cavity was not segmented. The results of our AR-CA model outperformed these previously reported Dice scores and further provide labeled segmentation of the NC/RC subregions, which are important for radiation therapy planning.6 Zeng et al11 used a hybrid generative-discriminative model (GLISTRboost) for segmentation of pre- and postoperative MR images of patients with gliomas (186 preoperative and 32 postoperative MR images were included). Their results showed median Dice scores of 0.75 and 0.65 for the preoperative and postoperative cases, respectively, compared with the reference segmentation.
Meier et al12 aimed to evaluate the use of a fully automatic segmentation method, Brain Tumor Image Analysis (BraTumIA; http://mia-software.artorg.unibe.ch/BraTumIA/) for estimating the extent of resection and residual tumor volume of contrast-enhancing tumor after an operation, reporting the segmentation of the enhancing component without segmentation of the RC. Although our results overall are promising, we did observe a few postoperative segmentations with low accuracy, perhaps as a result of limited resilience of the model to operative artifacts, such as brain distortion, blood products, and air in the RC. There were also some cases of periventricular tumors in which portions of the ventricular system and choroid plexus were mislabelled as TC and ET, respectively.
Once a pipeline is fully integrated into the PACS and clinical workflows, any model improvements and updates can be made quite readily on the server without requiring changes in other components of the pipeline.
Challenges of Model Development
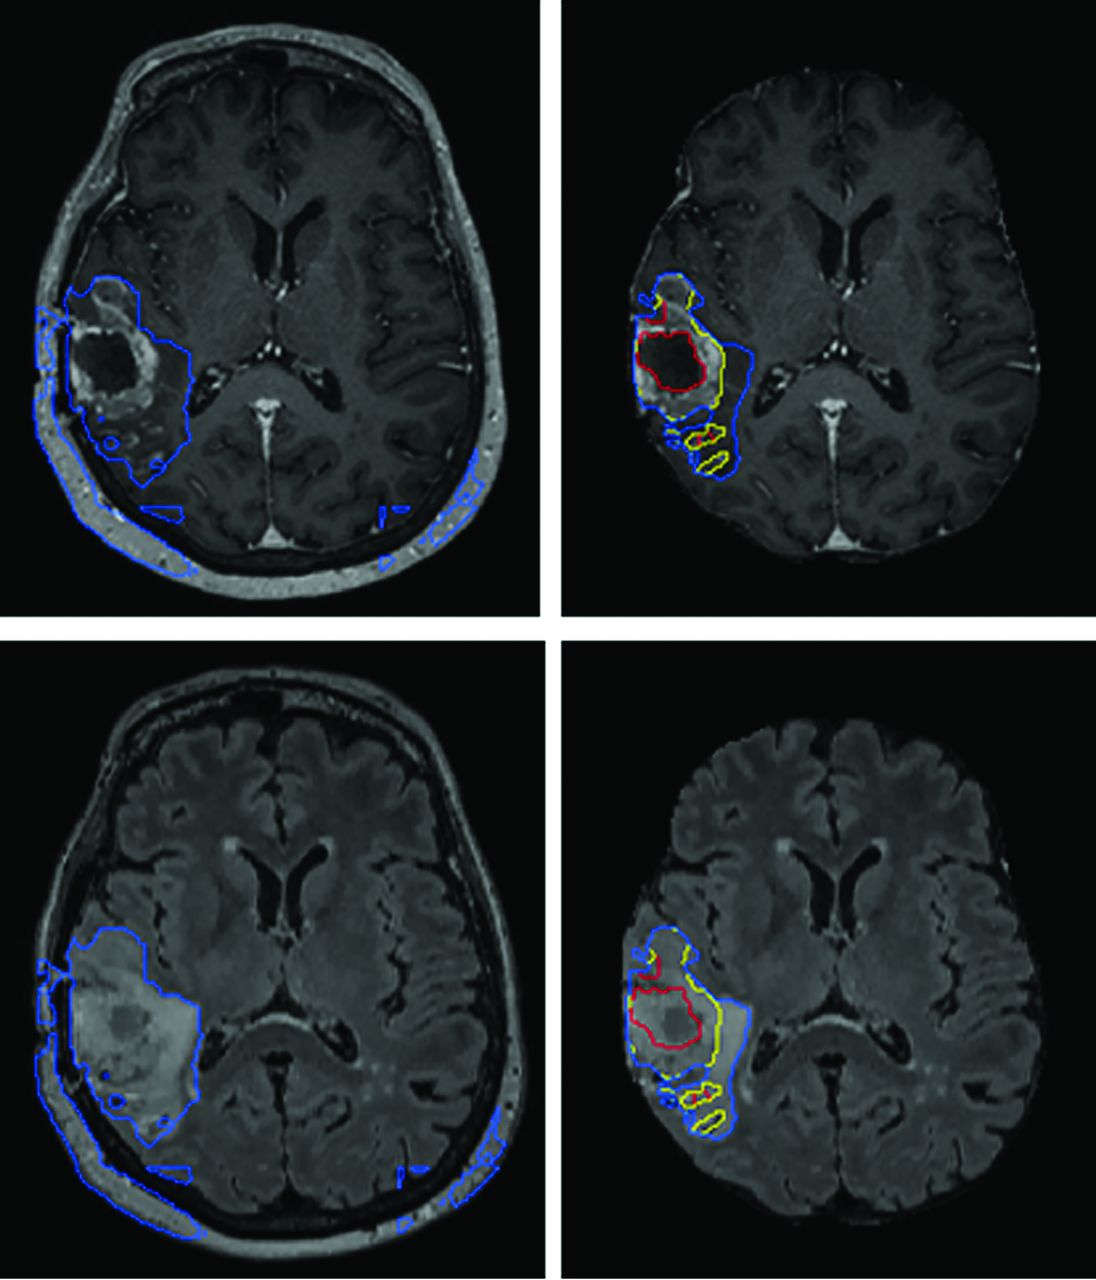
Preprocessing steps exactly analogous to how data from the BraTS datasets are processed are used here because the model is inspired from top performers on prior BraTS Challenges and the BraTS dataset in model development. In addition, preprocessing of DICOM is almost always necessary for input into machine learning models because the current common software libraries accommodate different image formats, though generally not DICOM. Such preprocessing steps are, of course, not part of any routine clinical image handling. Such preprocessing steps are nontrivial, typically rule-based, and account for ∼60% of the total processing time, given the relative speed of inference. Model performance is also dependent on meticulously reproducing these steps or their equivalent (Fig 4).

AR-CA segmentation model performance for high-grade gliomas with (right) and without (left) skull-stripping. T1 MPRAGE postcontrast (upper) and FLAIR (lower) images are shown. This example demonstrates how preprocessing steps are necessary to facilitate proper segmentation with obvious errors in estimating the whole tumor and entirely failing to segment the tumor core and enhancing tumor subregions.
Another challenge is that publicly available code repositories variably include optimization parameters. The lack of optimization parameters certainly limits cross-institution adoption. As we move forward, sharing of optimization parameters is also critical to facilitate effective sharing of models.
While the BraTS Challenge has contributed significantly to moving the field forward, ultimately for clinical use, a model is needed that can handle both preoperative and postoperative cases because longitudinal follow-up and assessment of postoperative residua are desired. Thus, training models to handle postoperative cases is necessary to achieve higher clinical relevance. For postoperative cases, to the best of our knowledge, there are no publicly available ground truth datasets. In performing our own manual segmentations, we also found inherent difficulties in discrimination between NC versus RC and ET versus postoperative enhancement. For consistency, our approach was to label the RC and NC together and also label the ET and postoperative enhancement together, a method that has been used previously.1 While clearly incompletely precise, these pairs of areas have overlapping intensity characteristics and are simply not reproducibly segmented manually or otherwise; similar observations have also been noted by others in the field.11,28,29
Not only is it important to test and potentially retrain on local data due to differences in sequence parameters, in attempting to do so, we also found that sequences used for our local clinical MR imaging protocols (and likely also true for other imaging centers) do not necessarily match BraTS imaging sequences. For example, at our institution, it is not customary to acquire all three 3D pulse sequences (T1-weighted, T2-weighted, and T2 FLAIR) in every follow-up tumor case due to the long acquisition times associated with such a protocol, mainly reserved for operative cases for stereotaxis. Thus, effective clinical segmentation models need be able to handle differences in preoperative and postoperative protocols. The model performance may well have been higher for postoperative cases if we had access to 3D T2 SPACE for training in all cases; however, with the aim of developing a tool adaptive to its clinical environment rather than the other way around, we retrained using our existing clinical protocols achieving 4%–6% improvement in Dice scores for the different subregions. Most important, once the pipeline is worked out, model improvements or substitutions or both are easy to implement. Therefore, continued clinical evaluations of segmentation models should be performed.
Challenges of Implementation
A number of practical challenges were present when mapping out implementation. Correct routing of studies and series to the model is required, necessitating mapping from multiple scanners and sites. Studies were routed on the basis of the type of protocol. Unfortunately, we have a single protocol for preoperative neurosurgical cases that include pathologies different from gliomas (eg, meningioma, metastasis, arteriovenous malformation). When these were input into the model, some of the output was reasonable (Fig 5), though the model is not reliable for these other pathologies because it has not been trained or tested on any such examples. To address this issue, we had to create a discrete protocol for presurgical MR imaging with glioma segmentation. Of note, there is a clinical precedent for specialized protocols such as this, for example, for the indication of dementia and referrer requests for quantitative volumetrics of the brain. For series routing, filtering rules were set up on the basis of series description, though due to description drift with time and inconsistent naming convention, this currently requires manual periodic evaluation for updating of rules, and irregularities were encountered more frequently initially.

AR-CN segmentation model performance in a patient with left convexity meningioma. Despite reasonably good performance of the model is this case, the model has not been trained or tested on this type of pathology and would not be reliably expected to perform on such cases.
Left/right mirror-image flipping occurred in some cases with one of the 3D sequences. This may have resulted from scanner differences in terms of setup, defaults, and direction of scanning. This occasionally prevented proper coregistration, resulting in nonsense output. Another barrier encountered was sudden failure of the pipeline, resulting in no studies being processed. After investigation, it appeared that the mount between the data transit server and the storage space disconnected due to a reboot of one of the servers. Thus, we set up a notification mechanism when the mount/server was down. Finally, in ∼5% of cases, we encountered inconsistent delays in routing to the inference node because there was no notification of completion of image routing and, thus, no clear trigger for the model to run. Typically, routing to the inference node took 1–2 minutes; however, in about 20% of the cases typically due to delays on the scanner itself, the delay could be as much as 15–30 minutes. We set a wait-time window on the inference node of 2 minutes for a new study, looping over all previously received studies during that day. In aggregate, across all modes of failure described, approximately 90% of cases yielded useful segmentation masks. Most important, routing solutions are likely to benefit from machine learning, possibly DL.30
Toward successful deployment, the need to educate end users including radiologists, neurosurgeons, and neuro-oncologists about the strengths and limitations of the tool is paramount. Tumor segmentations must be reviewed and volume calculations must not be blindly followed. Over- and underestimation of tumor will occur, and the calculation of a 95% confidence interval for all measurements is further recommended. One should consider what the output looks like, whether to output directly to the clinical PACS environment or a separate application. For workflow purposes, more often than not, viewing in the PACS is preferred by clinical radiologists and obviates the need for navigating complex additional software; however, not all PACS vendors can accommodate specific output (color, overlays, and so forth), and sending too many unnecessary, additional series to the PACS can overwhelm and possibly confuse viewers. In this case, we sent output segmentations directly to the PACS superimposed on SPACE FLAIR and MPRAGE postcontrast in the axial plane. We avoided complex interactions between the end user and the segmentation, though a templated macro is added to the report regarding the accuracy of the segmentation and poor segmentations can be marked in the PACS as such.
Limitations
The postoperative segmentation definitions used here are defined on the basis of imaging characteristics and do not necessarily imply that these should dictate specific treatments. We realize that postsurgical tumors are challenging to detect and parse. Ground truth manual segmentations are generally considered the criterion standard for this task; however, they are also known to have interobserver variability.31 This tool is not intended as a classification tool for recurrent tumor and notably does not incorporate information from diffusion and perfusion MR imaging. We believe that a tool such as the one described here can help inform follow-up in patients with gliomas by providing quantitative 3D measures based on the standard imaging pulse sequences described, though clearly these must be interpreted in conjunction with the images themselves in addition to any other available pulse sequences, prior imaging, and, as always, by a trained radiologist and oncologic care team with knowledge of the clinical history, treatment regimen, and current presentation. In addition, postoperative cases are not represented in the BraTS dataset, so these are derived exclusively from our local dataset, which is relatively small. Although there are images obtained from 3 different scanner types (Magnetom Skyra, Magnetom Prisma, and Magnetom Vida) and 5 imaging sites, these are from a single institution, represent images from a single vendor, and are all acquired at 3T. Adoption for use in a different institution would require testing and possible fine-tuning the model on local data. In the future, the model would likely benefit from a greater number of training datasets.
CONCLUSIONS
This study serves as proof of concept of model development coordinated with pipeline implementation for a DL-based model for automatic volumetric segmentation that can handle both pre- and postoperative gliomas. Such a unified approach facilitates model design and training compatible with routine clinical workflow. We present a model that most importantly accommodates postoperative cases that are clinically important to assess for disease progression and recurrence. The model fuses key innovations from available top-ranked source codes with favorable performance achieved after hyperparameter optimization and discusses the challenges and limitations of the tool. Such a tool may help finally realize clinical translation of quantitative measures for brain tumors.
Source code can be found at https://github.com/abenpy/ARCNet.
Footnotes
E. Lotan and B. Zhang contributed equally to this work.
This work was supported in part by NSF Award #1928614.
Disclosures: Eric K. Oermann—UNRELATED: Consultancy: Google Inc; Employment: Merck & Co; Stock/Stock Options: Artisight LLC. Yvonne W. Lui—UNRELATED: Grants/Grants Pending: National Institutes of Health, The Leon Lowenstein Foundation, Department of Defense, National Science Foundation.* *Money paid to the institution.
References
- Received May 5, 2021.
- Accepted after revision September 22, 2021.
- © 2022 by American Journal of Neuroradiology


Jump to section
Related Articles
Cited By...
- No citing articles found.