
Abstract
BACKGROUND AND PURPOSE: The microenvironment of lymphomas is known to be highly variable and closely associated with treatment resistance and survival. We tried to develop a physiologic MR imaging–based spatial habitat analysis to identify regions associated with treatment resistance to facilitate the prediction of tumor response after initial chemotherapy in patients with primary central nervous system lymphoma.
MATERIALS AND METHODS: Eighty-one patients with pathologically confirmed primary central nervous system lymphoma were enrolled. Pretreatment physiologic MR imaging was performed, and K-means clustering was used to separate voxels into 3 spatial habitats according to ADC and CBV values. Associations of spatial habitats and clinical and conventional imaging predictors with time to progression were analyzed using Cox proportional hazards modeling. The performance of statistically significant predictors for time to progression was assessed using the concordance probability index.
RESULTS: The 3 spatial habitats of hypervascular cellular tumor, hypovascular cellular tumor, and hypovascular hypocellular tumor were identified. A large hypovascular cellular habitat was most significantly associated with short time to progression (hazard ratio, 2.83; P = . 017). The presence of an atypical finding (hazard ratio, 4.41; P = . 016), high performance score (hazard ratio, 5.82; P = . 04), and high serum lactate dehydrogenase level (hazard ratio, 1.01; P = .013) was significantly associated with time to progression. A predictive model constructed using the habitat score and other imaging parameters showed a concordance probability index for prediction of time to progression of 0.70 (95% CI, 0.54–0.87).
CONCLUSIONS: A hypovascular cellular tumor habitat is associated with treatment resistance in primary central nervous system lymphoma, and its assessment may refine prechemotherapy imaging–based response prediction for patients with primary central nervous system lymphoma.
ABBREVIATIONS:
- CE
- contrast-enhanced
- C-index
- concordance probability index
- ECOG
- Eastern Cooperative Oncology Group
- LDH
- lactate dehydrogenase
- MTX
- methotrexate
- nCBV
- normalized cerebral blood volume
- PCNSL
- primary central nervous system lymphoma
- TTP
- time to progression
Primary central nervous system lymphoma (PCNSL) represents a histologically and immunohistochemically homogeneous type of lymphoma.1 However, the microenvironment of B-cell lymphomas was recently shown to be highly variable2 with regard to both the spatial arrangement and composition of cells, including immune and inflammatory cells, blood and lymphatic vascular networks, and the extracellular matrix. The tumor microenvironment is closely associated with treatment resistance and survival2⇓-4 and partly reflects the tumor cell content and genetic aberrations. The mainstay of treatment for PCNSL is high-dose methotrexate (MTX) in combination with other chemotherapeutic agents.5,6 Because drug delivery, distribution, and interaction with the tumor are determined by the tumor microenvironment,7,8 depiction of the spatial arrangement of tumor cellularity and vascularity may provide valuable information for predicting treatment response.
The tumor microenvironment can be depicted using imaging parameters derived from physiologic MR imaging such as ADC mapping, CBV mapping, and permeability parameters.9,10 In PCNSL, high cellularity with a low ADC is associated with poor prognosis,11 whereas a low permeability pattern 7,8 is associated with shorter progression-free survival. However, these previous studies were limited in their depiction of the spatial arrangement, with a single parameter providing unidirectional information on high or low parametric values. Physiologic MR imaging–based spatial habitat analysis refers to the parcellation of voxels on the basis of imaging parameters obtained from physiologic MR imaging of ADC and CBV to explain the habitat-based tumor environment. The parcellation of voxels using physiologic parameters enables depiction of regions of relative hyper- or hypocellularity and relative hyper- or hypovascularity. The combined spatial information from cellularity- and vascularity-reflecting physiologic MR imaging parameters will enable more precise prediction of treatment response,12 especially identification of any tumor fraction with treatment resistance, which may exhibit high cellularity and low vascularity.
Clustering methods can be applied to measurements of multiple parameters to separate different tumor habitats through parcellation.12 We hypothesized that physiologic MR imaging–based tumor parcellation could potentially provide spatial information on pretreatment PCNSL and identify regions of treatment resistance in patients with PCNSL. The purpose of this study was to develop spatial habitat analysis based on multiparametric physiologic MR imaging and identify regions associated with treatment resistance to facilitate the prediction of tumor response after initial chemotherapy in patients with PCNSL.
MATERIALS AND METHODS
Study Population
This retrospective study was reviewed and approved by the institutional review board of Asan Medical Center (institutional review board No. 2021–0265), and the requirement for informed consent was waived. A review of the database of Asan Medical Center identified 103 patients who were diagnosed with PCNSL between July 2011 and September 2018. The inclusion criteria were as follows: 1) pretreatment acquisition of 3T MR imaging with a brain tumor protocol including anatomic MR imaging and physiologic MR imaging (DWI and DSC perfusion imaging); 2) histopathologic confirmation of PCNSL by stereotactic biopsy; and 3) adequate follow-up examinations (no longer than 2 weeks after completion of all planned therapy) to determine the treatment response according to clinicoradiologic consensus after MTX-based chemotherapy. Patients were excluded if they were lost to follow-up visits (n = 6), the tumor was surgically resected (n = 15), or any imaging was unreadable (because of artifacts, n = 1). Therefore, 81 patients were included in this study (age range, 29–80 years; mean age, 61.6 [SD, 11.8] years; 43 women). A flow chart of patient selection is shown in Fig 1.
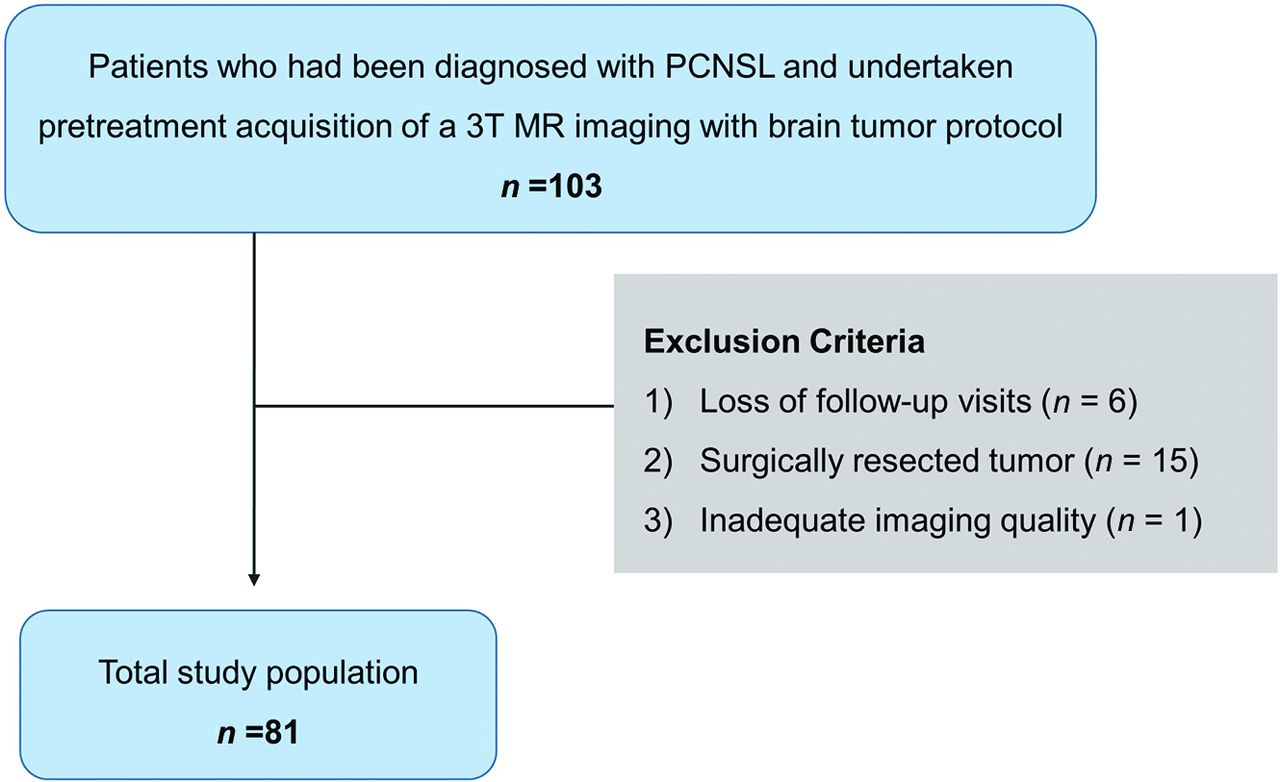
Flow chart of patient recruitment.
Clinical Variables and Treatment
Clinical and pathologic data were retrieved from the medical records. Baseline characteristics including age, sex, Eastern Cooperative Oncology Group (ECOG) performance status at diagnosis,13 initial tumor volume, mean serum lactate dehydrogenase (LDH) level, mean CSF total protein, pretreatment imaging characteristics (location and presence of atypical findings), and initial posttreatment response based on a clinicoradiologic examination were collected.
All included patients had a pathologic diagnosis of diffuse large B-cell PCNSL and received MTX-based induction chemotherapy following 1 of 3 protocols: 1) MTX only (3–8 g/m2/day; n = 54); 2) a combination therapy with MTX and procarbazine, lomustine (CCNU), and vincristine regimen (PCV): procarbazine (0.1–0.2 g/m2/day)/vincristine (1.4 mg/m2/week; n = 15); or 3) a combination therapy with MTX, PCV, and rituximab (375 mg/m2/week; n = 12). After the patient was diagnosed with diffuse large B-cell PCNSL, dexamethasone was used in all patients for supportive care to minimize symptoms due to vasogenic edema or tumor mass effect.
Response Assessment and Outcome Definition
The posttreatment tumor response was assessed according to the International Primary CNS Lymphoma Collaborative Group criteria14 based on MR imaging, corticosteroid use, CSF cytology, and slit lamp examination. A complete response was defined as resolution of contrast-enhancing lesions on follow-up MR imaging and, if indicated, by CSF cytologic analysis (performed if CSF cytology was positive for malignant cells at the time of diagnostic staging). A partial response was defined as an interval decrease in contrast-enhancing lesion volume, and progressive disease was defined as an interval increase in contrast-enhancing lesion volume or development of new enhancing lesions on follow-up contrast-enhanced MR imaging or involvement of the eye or CSF. All follow-up imaging to assess the overall treatment response was performed within 2 weeks after completion of all planned chemotherapy of the first or second cycle. Clinicoradiologic diagnoses of posttreatment responses were made by consensus between a neurooncologist (Shin-kyo Yoon, with 10 years of experience in neuro-oncology practice) and a neuroradiologist (Ho Sung Kim, with 18 years of experience in neuro-oncologic imaging) after complete imaging and medical chart review.15 Both complete response and partial response were used as a composite end point to define “treatment response,” and both stable disease and progressive disease were used as a composite end point to define “treatment resistance.” Time to progression (TTP) was defined5 as the interval between the initiation of induction therapy until documentation of resistance to induction therapy (MR imaging after 6 cycles or stable disease after at least 2 cycles and progression or death from any cause), relapse, or death from any cause after having achieved a partial or complete response.
MR Imaging Acquisitions
The brain tumor imaging protocol was acquired on a 3T scanner (Ingenia 3.0 CX; Philips Healthcare) and included conventional and advanced sequences, including T2WI, T2-weighted FLAIR, T1WI, DWI, DSC perfusion imaging, and contrast-enhanced (CE)-T1WI. The detailed imaging protocols are provided in the Online Supplemental Data, and the preprocessing procedures for the DWI and DSC imaging are summarized in the Online Supplemental Data.
Conventional Image Analysis
All MR images were read by an experienced neuroradiologist (S.Y. Jeong with 6 years of experience) who was blinded to the clinical outcomes. Conventional MR imaging parameters included deep or superficial location and the presence of atypical features of necrosis or a hemorrhagic component.16,17 A deep location meant involvement of the basal ganglia, corpus callosum, periventricular areas, brainstem, and cerebellum. A superficial location meant involvement of the cerebral hemisphere with the exception of deep brain structures. The Online Supplemental Data show cases demonstrating atypical findings of PCNSL on conventional imaging.
Deep Learning Segmentation
The overall process of the deep learning segmentation and tumor habitat analysis is shown in Fig 2. The 3D CE-T1WI of each patient was registered and resampled into 1 × 1 × 1 mm isometric voxel sizes. T2WI, ADC, and normalized CBV (nCBV) maps were then coregistered and resampled to the isovoxel 3D enhanced T1WI using rigid transformations with 6 df in the SPM package (Version 12; http://www.fil.ion.ucl.ac.uk/spm/).

The overall process of the deep learning segmentation and tumor habitat analysis. A, Image acquisition, registration, and deep learning segmentation for a contrast-enhancing lesion (CEL). B, Extraction of ADC and nCBV values from the CEL and voxel classifications based on ADC and nCBV values. The individual voxels in each cluster are grouped according to their similarities and differences using a K-means clustering algorithm. C, The cluster number is set to 3 to depict 3 different habitats according to the combinations of ADC and nCBV parameters: hypervascular cellular, hypovascular cellular, and hypovascular hypocellular. D, Voxels are shown as spatial habitats in the original image space. Associations of pretreatment tumor habitats with TTP were analyzed.
Deep learning segmentation was performed using an implementation of a 3D UNet-based method (https://github.com/MIC-DKFZ/nnUNet)18 applied to the FLAIR and 3D CE-T1WI using the PyTorch package, Version 1.1 in Python 3.7 (http://www.python.org). This deep learning segmentation package is optimized for processing heterogeneous MR imaging results with various pathologic characteristics. The segmentation process included identification of contrast-enhancing lesions, necrosis, and peritumoral edema, with the contrast-enhancing lesions being chosen for subsequent investigation.
Tumor Habitat Analysis
The final voxel classifications based on ADC and nCBV values were implemented using a K-means clustering module in the scikit-learn Python package (https://scikit-learn.org/stable/index.html). The individual voxels in each cluster were grouped according to their similarities and differences using a K-means clustering algorithm with squared Euclidean distances between voxel intensities as the similarity metric. The cluster number was set to 3 to depict 3 different habitats according to the combinations of ADC and nCBV parameters, with the intention of avoiding overparameterized models19 and producing a model that was easily explainable. For example, low or high ADC and CBV values reflected “hyper-/hypovascularity” and “cellularity/hypocellularity,” respectively, and 3 clusters was the lowest number to demonstrate the biologic differences.
Population-Level Clustering.
Three clusters were set using ADC and nCBV values: Cluster 1 represented hypervascular cellular tumor with high CBV values and low ADC values; cluster 2 represented hypovascular cellular tumor with low CBV values and low ADC values; and cluster 3 represented hypovascular hypocellular tumor with low CBV values and high ADC values. All voxels were allocated to 1 of the 3 clusters and were displayed as spatial habitats in the original image space. The parameter value ranges for the boundary of the spatial habitats were 4.37–4.9×10⁻⁶ mm2/s for nCBV and 103–121×10−6 mm2/s for ADC.
Statistical Analysis
All results are reported as median with range or 95% CI for continuous variables and as frequency or percentage for categoric variables. All statistical tests were 2-sided, and a P value < .05 was considered to indicate statistical significance. Statistical analyses were performed by using R software, Version 3.4.3 (https://www.r-project.org).
The associations between TTP and clinical and conventional imaging predictors were determined by univariable Cox analysis. Univariate analyses were performed to analyze the associations of tumor habitats with TTP using Cox regression or the Kaplan-Meier method (log-rank test). Hazard ratios indicate the relative change in hazard incurred by a unit increase in each parameter, and 20,000 voxels were considered as 1 U in this study.
The Pearson correlation was used to further analyze the correlation of each tumor habitat with the overall tumor burden of the contrast-enhancing lesion.
To compare clinical predictors, conventional imaging findings, and tumor habitats, random survival forest analysis was performed. The variable importance of predictors for TTP was calculated with 10-fold cross-validation using the randomForestSRC (https://cran.r-project.org/web/packages/randomForestSRC/index.html) module in R.
Habitat Risk Score.
For the significant predictors identified in the univariate Cox regression, an optimal cutoff for stratifying high- and low-risk groups was estimated using the maxstat algorithm in R with 10-fold cross-validation, which ensured unbiased prediction within the sample.20 Using this cutoff from the exploratory analysis, we developed a habitat risk score to stratify patients according to risk, with each predictor being assigned a discrete score of 1 if it was above its cutoff and zero if it was below it.
Prediction Performance for TTP.
A model combining the habitat risk score and clinical and conventional imaging predictors was created, and its concordance probability index (C-index) was calculated. The performance of the model was quantified with respect to discrimination and calibration.21 Discrimination was measured with the Harrell C-index, and calibration was tested using the version of the Hosmer-Lemeshow test by D’Agostino and Nam.22
RESULTS
Patient and Imaging Characteristics of the Study Population
The baseline demographics, clinical characteristics, and conventional imaging characteristics of the study patients and tumors are summarized in Table 1. All the study patients underwent initial treatment with MTX-based chemotherapy. The mean duration between pretreatment MR imaging and the initial chemotherapy was 4.8 (SD, 5.1 ) days. The mean follow-up duration between pretreatment MR imaging and the first posttreatment MR imaging was 50.8 (SD, 27.1) days. No patient died from treatment-related toxicity.
Patients and imaging characteristics of the PCNSLs included in this study
Clinical and Conventional Imaging Predictors for TTP
The results of the univariate analysis to evaluate clinical and conventional imaging predictors are summarized in Table 2. Among the potential clinical and imaging predictors, the presence of an atypical finding (hazard ratio, 4.41; 95% CI, 1.32–14.71; P = .016), a high ECOG score of 3 or 4 (hazard ratio, 5.82; 95% CI, 1.07–31.66; P = .04), and a high serum LDH level (hazard ratio, 1.01; 95% CI, 1.00–1.02; P = .013) were significantly associated with TTP in PCNSL.
Clinical and imaging predictors associated with TTP in PCNSL
Tumor Habitats Associated with TTP
The results of the univariate analysis to evaluate the associations of the 3 tumor habitats with TTP are summarized in Table 3. Among the tumor habitats, a large hypovascular cellular habitat (20,000 voxels) was significantly associated with a short TTP (hazard ratio, 2.83; 95% CI, 1.20–6.65; P = .017; Fig 3). No other tumor habitats or percentages of the tumor habitats were associated with TTP.
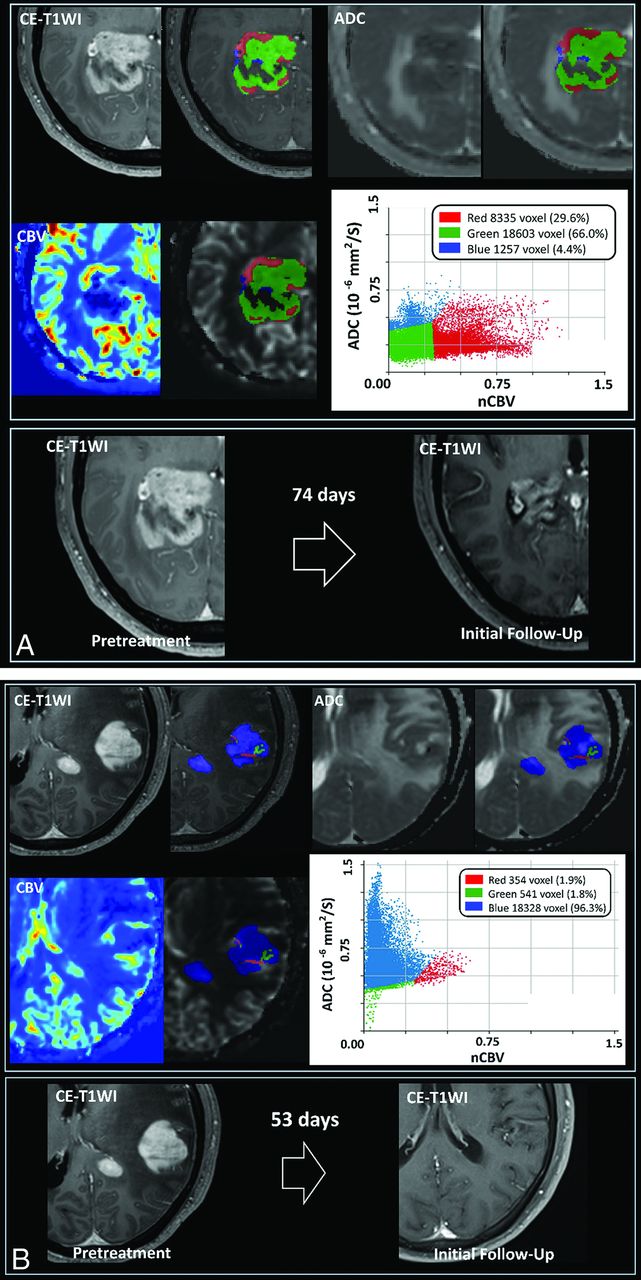
A, Demonstration of the 3 spatial habitats defined by clustering of voxels using normalized ADC and nCBV maps in a 53-year-old male patient. The hypervascular cellular habitat (red) shows high nCBV and low ADC, the hypovascular cellular habitat (green) shows low nCBV and low ADC, and the hypovascular hypocellular habitat (blue) shows low nCBV and high ADC. The tumor exhibits a large hypovascular cellular habitat (green), and a persistent enhancing mass was associated with a short TTP after initial chemotherapy. B, Demonstration of the 3 spatial habitats defined by clustering of voxels using normalized ADC and nCBV maps in a 57-year-old male patient. The hypervascular cellular habitat (red) shows high nCBV and low ADC, the hypovascular cellular habitat (green) shows low nCBV and low ADC, and the hypovascular hypocellular habitat (blue) shows low nCBV and high ADC. The tumor has a small hypovascular cellular habitat (green) and showed a complete response at 53 days after initial chemotherapy.
Exploratory analysis of spatial habitats for predicting TTP in patients with PCNSL
The single physiologic parameters of ADC and CBV showed no significant association with TTP (P > .05).
The correlations between the overall tumor burden and each habitat were moderate (hypervascular cellular habitat, r = 0.51, P < .001; and hypovascular hypocellular habitat, r = 0.55, P < .001) to strong (hypovascular cellular habitat, r = 0.81; P < .001).
The variable importance values of the clinical predictors, conventional imaging findings, and tumor habitats are shown in the Online Supplemental Data. The variable importance of tumor habitats of the hypovascular cellular habitat (variable importance, 0.0049) was higher than that of age (variable importance, 0.0037) and lower than that of atypical findings (variable importance, 0.0185).
Risk Stratification Using the Tumor Habitat Score
The optimal tumor habitat cutoff for stratifying patients according to treatment response and treatment resistance was >9000 voxels in the hypovascular cellular habitat. This cutoff value stratified patients according to treatment response and treatment resistance with a significant difference in the log-rank test (P = .001). Figure 4 shows the Kaplan-Meier survival curve and the risk table generated on the basis of the hypovascular cellular habitat. A habitat risk score based on discrete increments in the hypovascular cellular habitat was assigned for the patients.
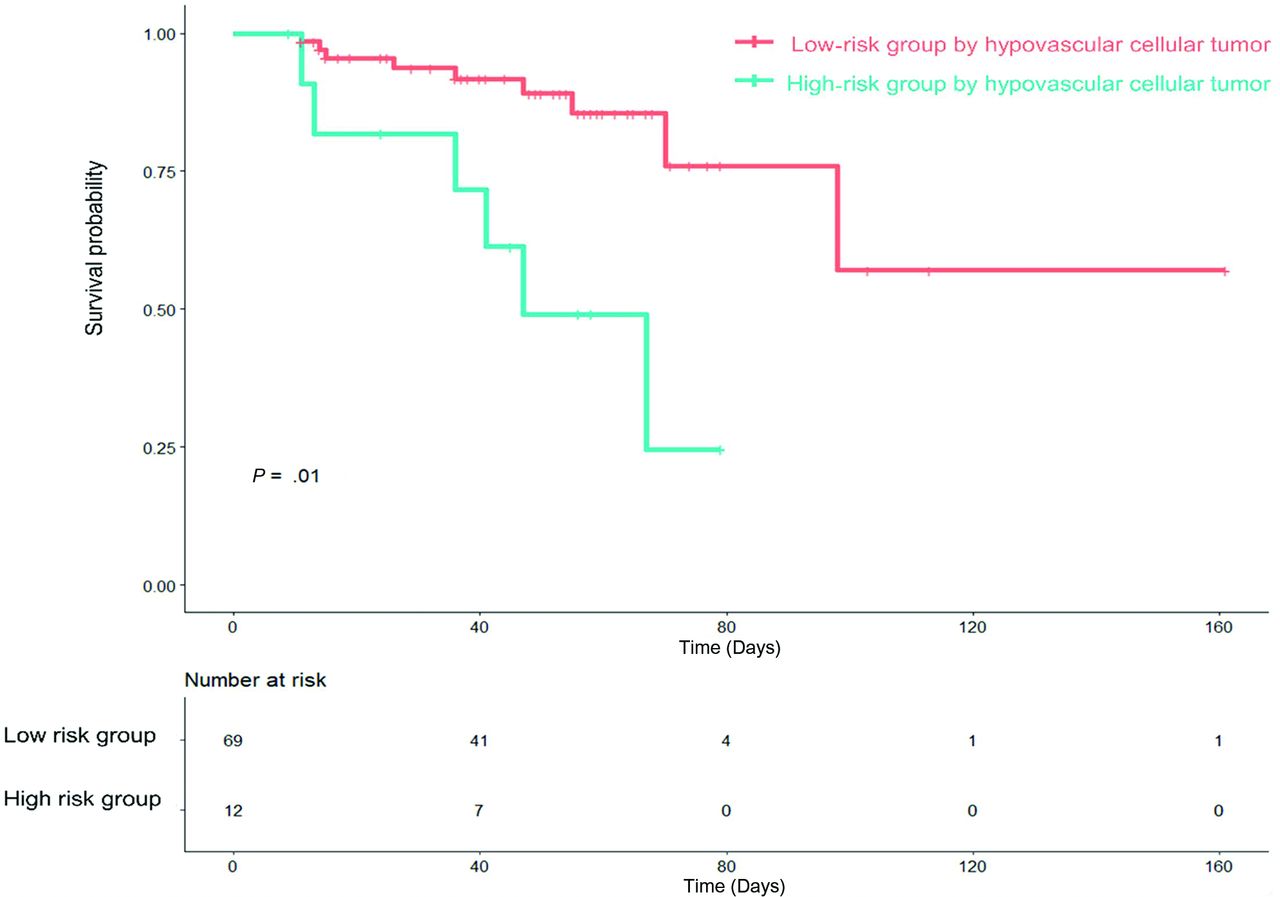
Kaplan-Meier analysis of TTP in patients with PCNSL stratified by hypovascular cellular habitat (log-rank, P = .01).
Performance of the Prediction Model for TTP
The results of the prediction of TTP in PCNSL using tumor habitat and single physiologic MR imaging parameters are summarized in Table 4. The C-index for prediction of TTP using tumor habitats was 0.65 (95% CI, 0.52–0.78), which was significantly higher than that of the single physiologic MR imaging parameters.
| Combination of Clinical, Conventional Imaging Predictors, and Tumor Habitats | Combined Clinical and Conventional Predictors | Tumor Habitats | Clinical Predictors Only | Conventional Imaging Predictors Only | |
|---|---|---|---|---|---|
| C-index | 0.73 | 0.71 | 0.65 | 0.68 | 0.63 |
| 95% CI | 0.67–0.80 | 0.54–0.78 | 0.52–0.78 | 0.54–0.82 | 0.50–0.76 |
| P value | Reference | .01 | .012 | .81 | .62 |
↵a Combined clinical predictors were age, ECOG score, and mean serum LDH level; the conventional imaging predictor was the presence of atypical image findings. P value refers to the significance in the difference of the C-indices between the combined model and the single model assessed using “CompareC” (https://cran.r-project.org/web/packages/compareC/index.html) in the R statistical and computing software.
Prediction of TTP in PCNSLs according to tumor habitat, ADC, and CBVa
A predictive model was constructed using the habitat score, the presence of an atypical finding, the ECOG score, and the serum LDH level. The C-index of this model combining selected clinical predictors, conventional imaging predictors, and tumor habitat for predicting TTP was 0.73 (95% CI, 0.67–0.80), which was higher than that of models based on clinical predictors only (C-index, 0.68; 95% CI, 0.54–0.82) or conventional imaging predictors only (C-index, 0.63; 95% CI, 0.50–0.76). The Hosmer-Lemeshow test indicated that the model had good calibration (P > .5). The C-index of the combined model of clinical predictors and conventional imaging predictors for predicting TTP was 0.71 (95% CI, 0.54–0.78), which was slightly lower than the combined habitat score model, but it did not reach statistical significance (P = .10).
DISCUSSION
In this study, we demonstrated that in PCNSL, the TTP after initial chemotherapy could be predicted by physiologic MR imaging–based tumor habitat analysis. A hypovascular cellular habitat with both low CBV and ADC values was significantly associated with treatment resistance, with a large extent of hypovascular cellular habitat being associated with a short TTP. Furthermore, a model combining selected clinical parameters, conventional imaging predictors, and tumor habitat analysis had great predictive power for identifying treatment resistance to initial chemotherapy.
The tumor microenvironment is composed of both cellular and molecular components that continuously interact. The tumor microenvironments in lymphomas are highly variable with regard to both the spatial arrangement and composition of cells. The tumor microenvironment plays critical roles in the regulation of tumor cell survival, proliferation, and immune escape, which leads to treatment resistance.2,4,8 Imaging techniques such as texture analysis, fractal analysis, and habitat analysis can quantify these spatial heterogeneities of microenvironments within tumors,12 and in this study, we used tumor habitat analysis to identify tumor subregions and then used them to predict treatment resistance. Tumor habitat analysis, which parcellates similar voxels using a clustering method, can reflect the heterogeneity of tumor cellularity and vascularity and identify subregions that can be used to predict the response to chemotherapy in PCNSL.
A significant inverse correlation exists between tumor cellularity and ADC values,23 suggesting that ADC values can be used as a surrogate marker of tumor proliferation.24⇓-26 ADC values have shown potential as a prognostic imaging biomarker for the response to treatment of non-Hodgkin lymphoma.27 In our study, low ADC values in PCNSL with a cellular habitat indicating a high tumor burden correlated with adverse clinical outcomes.
CBV measurements obtained using DSC MR imaging are one of the indirect modalities used to evaluate the functional vascularity of the tumor and its oxygenation status,28,29 which are closely related to the response to chemotherapy or radiation therapy.30 The hypovascular habitat identified in our study may reflect a hypoxic microenvironment that is resistant to treatment, with changes in gene and molecular expression and evolution toward increased malignancy and an increasingly aggressive phenotype.30 Furthermore, low CBV values may represent a decrease in the patent vessels that deliver the chemotherapeutic agent to the tumor bed, which, therefore, induces resistance to treatment. This is supported in a previous study31 that found that high CBV values were associated with a good prognosis with longer overall survival and progression-free survival in PCNSL. The hypovascular cellular habitat showed the strongest correlation with overall tumor burden, and it may indicate the region of tumor core to be treated rather than the region responding well to therapy.
Five clinical parameters are well-known to correlate with a worse prognosis in PCNSL: elevated LDH, age older than 60 years, poor performance status, elevated CSF protein, and location of tumor within the deep regions of the brain such as periventricular regions, basal ganglia, brainstem, and/or cerebellum.16 The presence of atypical imaging findings that reflect necrosis or a hemorrhagic component is associated with short TTP.16,17 These findings also indicate poor tumor perfusion and decreased perfusion-related drug delivery because of necrosis and hemorrhage within the tumor.32,33
This study has several limitations. The first is the small sample size resulting from the rarity of the disease and the lack of external validation. Second, the chemotherapy regimens used in this study were not unified. Because there is no consensus regarding the other agents to be used in combination with MTX, several combinations of MTX-based chemotherapy were tried. We did not perform subgroup analysis per regimen because there were only a small number of patients in each combination regimen. Also, although high-dose radiation therapy plus consolidation chemotherapy or radiation therapy or both are used, there is no consensus on their combination with MTX.34 Our results should be confirmed by other studies with strict control of the chemotherapy regimen. Finally, the prediction performance was not high, with a C-index of only 0.70. Nonetheless, our study may be meaningful because it demonstrates the heterogeneity of PCNSL using physiologic MR imaging and the possibility of a future imaging biomarker–directed therapeutic plan. A well-designed prospective study is warranted.
CONCLUSIONS
The analysis of spatial habitats derived from multiparametric physiologic MR imaging may provide added value for predicting treatment response after initial chemotherapy. A hypovascular cellular tumor habitat was associated with treatment resistance in PCNSL and may be useful for refining imaging-based prediction for patients with PCNSL before they undergo chemotherapy.
ACKNOWLEDGMENT
We would like to thank Shin-Kyo Yoon, MD, for helping us in assessment of treatment response in this study.
Footnotes
This work was supported by the Basic Science Research Program through the National Research Foundation of Korea (NRF) funded by the Ministry of Education, Science and Technology (grant number: NRF-2020R1A2B5B01001707 and NRF-2020R1A2C4001748) and by a grant (2020IP0097) from the Asan Institute for Life Sciences, Asan Medical Center, Seoul, Korea.
Disclosure forms provided by the authors are available with the full text and PDF of this article at www.ajnr.org.
References
- Received May 10, 2021.
- Accepted after revision September 20, 2021.
- © 2022 by American Journal of Neuroradiology


Jump to section
Related Articles
Cited By...
- No citing articles found.