
Abstract
BACKGROUND AND PURPOSE: Conventional CT often cannot distinguish hemorrhage from iodine extravasation following reperfusion therapy for acute ischemic stroke. We investigated the potential of spectral detector CT in differentiating these lesions.
MATERIALS AND METHODS: Centrifuged blood with increasing hematocrit (5%–85%) was used to model hemorrhage. Pure blood, blood-iodine mixtures (75/25, 50/50, and 25/75 ratios), and iodine solutions (0–14 mg I/mL) were scanned in a phantom with attenuation ranging from 12 to 75 HU on conventional imaging. Conventional and virtual noncontrast attenuation was compared and investigated for correlation with calculation of relative virtual noncontrast attenuation. Values for all investigated categories were compared using the Mann-Whitney U test. Sensitivity and specificity of virtual noncontrast, relative virtual noncontrast, conventional CT attenuation, and iodine quantification for hemorrhage detection were determined with receiver operating characteristic analysis.
RESULTS: Conventional image attenuation was not significantly different among all samples containing blood (P > .05), while virtual noncontrast attenuation showed a significant decrease with a decreasing blood component (P < .01) in all blood-iodine mixtures. Relative virtual noncontrast values were significantly different among all investigated categories (P < .01), with correct hemorrhagic component size estimation for all categories within a 95% confidence interval. Areas under the curve for hemorrhage detection were 0.97, 0.87, 0.29, and 0.16 for virtual noncontrast, relative virtual noncontrast, conventional CT attenuation, and iodine quantification, respectively. A ≥10-HU virtual noncontrast, ≥20-HU virtual noncontrast, ≥40% relative virtual noncontrast, and combined ≥10-HU virtual noncontrast and ≥40% relative virtual noncontrast attenuation threshold had a sensitivity/specificity for detecting hemorrhage of 100%/23%, 89%/95%, 100%/82%, and 100%/100%, respectively.
CONCLUSIONS: Spectral detector CT can accurately differentiate blood from iodinated contrast in a phantom setting.
ABBREVIATIONS:
- ICH
- intracranial hemorrhage
- R-VNC
- relative virtual noncontrast
- SDCT
- spectral detector CT
- VNC
- virtual noncontrast
Material with similar attenuation can be difficult to distinguish on conventional CT. A common clinical illustration of this problem is the differentiation of iodine from hemorrhage because both are hyperdense on conventional unenhanced CT. In patients with acute ischemic stroke, intra-arterial thrombolytic therapy has been shown to decrease morbidity and mortality.1 However, it has also been reported that this increases the risk of intracranial hemorrhage (ICH), with reported frequencies of 10%–15% and mortality up to 83% for symptomatic ICH.2⇓⇓⇓⇓–7 Because of the disruption of the blood-brain barrier, contrast extravasation can occur during the procedure in 30%–50% of cases, impairing the detection of or the differentiation from ICH due to the overlap in density.5,8⇓⇓–11 As of this writing, unenhanced conventional CT is performed within 24 hours after treatment for the detection of complications. In case of unclear findings (eg, if differentiation between ICH and iodine extravasation is not possible), follow-up imaging may be performed. Hence, the ability to differentiate these 2 is highly desirable to avoid additional examinations and to ensure appropriate management.2
Two major discriminators of attenuation within a voxel are the energy of the x-ray beam and the concentration of attenuating material in that voxel. The presence or concentration of each discriminator in that voxel therefore cannot be determined by performing a single attenuation measurement from a broad photon energy spectrum. However, in dual-energy CT, attenuation at different energies is registered. In single- and dual-source dual-energy Revolution CT, this is achieved using a fast-kilovolt(peak) switching x-ray source (GE Healthcare, Milwaukee, Wisconsin) or 2 x-ray sources and 2 detectors (Somatom Force, Siemens Healthineers, Forchheim, Germany), respectively. Spectral detector CT (SDCT) (IQon; Philips Healthcare, Best, the Netherlands) distinguishes low- and high-energy data at the level of the detector using a dual-layer detector. The bottom and top layer absorb high- and low-energy photons, respectively. The main advantage of the latter approach is that spectral data are collected without the need to prospectively choose a spectral scanning protocol or mode, as needed in other dual-energy CT approaches.
Previous studies have shown the potential of dual-energy CT for differentiating iodine from hemorrhage in clinical settings10,12⇓⇓⇓–16; however, no study has been performed using SDCT for this application nor has the sensitivity or specificity been determined in a phantom system.
In our study, we investigated the ability of SDCT to differentiate ICH from iodinated contrast in a phantom model.
Materials and Methods
Image Acquisition
All scans were performed with a 464 Phantom (Gammex, Madison, Wisconsin) with a plastic 50-mL tube in its air cavity, filled with samples simulating hemorrhage (blood), diluted iodine, and a hemorrhage-iodine (blood-iodine) mixture. Each sample was scanned in the phantom with the following settings on the IQon SDCT scanner: 200 mAs, 120 kVp, pitch = 1, gantry rotation time = 330 ms, detector collimation = 64 × 0.625 mm, volume CT dose index = 18 mGy. Conventional CT images were reconstructed using an iterative reconstruction algorithm (iDose 4, Level 3; Philips Healthcare), while the spectral images were reconstructed using a spectral reconstruction algorithm (Spectral B, level 0). Reconstructed slice thickness was 3 mm. All scans were performed 3 times to account for interscan variability.
Sample Preparation
Previous studies have shown that the density of blood is primarily determined by the hemoglobin concentration.17 In turn, changes in hematocrit are reflected in the density of a hemorrhage seen on conventional CT.18 We collected discarded packed red blood cells and prepared samples to a range of 0%, 5%, 15%, 25%, 35%, 45%, 55%, 65%, 75%, and 85% hematocrit. The packed red blood cells were prepared using phosphate buffered saline to prevent cytolysis. Each sample was scanned with the protocol described above. Diluted iodine (Optiray 350, Ioversol; Mallinckrodt, St. Louis, Missouri) samples in phosphate buffered saline, with concentrations ranging from 0 to 14 mg I/mL (0.00, 0.70, 1.40, 2.10, 2.80, 3.50, 4.20, 4.90, 5.60, 7.00, 14.00 mg I/mL) were scanned using the same protocol. We matched the iodine attenuation with the densities found for 85%, 75%, 65%, 55%, 45%, and 35% hematocrit to create iodine dilutions with matching densities (2.50, 2.10, 1.80, 1.40, 1.10, and 0.70 mg I/mL, respectively) at those hematocrit levels.
Blood-iodine mixtures with matching densities were scanned with following proportions: [2/3] blood + [1/3] iodine; + [1/2] blood + [1/2] iodine; [1/3] blood + [2/3] iodine.
Image Analysis
All image analysis was performed using the proprietary image viewer (Spectral Diagnostic Suite; Philips Healthcare) of the vendor. Each diluted blood, diluted iodine, and blood-iodine mixture sample was analyzed by placing a circular 2-cm2 ROI centrally in the inserts. The attenuation on the conventional and virtual noncontrast (VNC) image (using VNC image) and iodine concentration (using the iodine density map) were measured within each ROI (Fig 1). Relative VNC (R-VNC) attenuation (%) is calculated using the following equation:

Comparison of the attenuation of diluted blood, iodine, and blood-iodine mixtures on conventional and virtual noncontrast images. There is an incremental decrease of VNC attenuation values with decreasing blood content, compared with conventional CT attenuation values.
Statistical Analysis
Statistical analysis was performed using SPSS 21.0 (IBM, Armonk, New York). Iodine-quantification measurements were compared with true iodine concentrations for correlation. Mean iodine quantification error (milligram/milliliter) was calculated and presented with a 95% confidence interval and Bland-Altman plot analysis. Attenuation in the conventional and VNC images was compared for correlation using the Pearson correlation. Attenuation on conventional images, VNC attenuation, and R-VNC are reported with 95% CIs for the investigated sample compositions (blood, [2/3] blood + [1/3] iodine; [1/2] blood + [1/2] iodine; [1/3] blood + [2/3] iodine, iodine) and compared by means of the Mann-Whitney U test. VNC attenuation for the samples containing blood was compared with the hematocrit in the samples for correlation. VNC attenuation, R-VNC attenuation, and attenuation on the conventional images were analyzed for sensitivity and specificity in detecting a hemorrhagic component. Receiver operating characteristic analysis was performed for conventional CT, VNC, R-VNC attenuation, and iodine quantification, and the corresponding areas under the curve with 95% CIs are reported. The difference among areas under the curve was assessed by the method of Hanley and McNeil.19 A P value < .05 was considered statistically significant.
Results
Mean attenuation on the conventional and VNC images (± 95% CI) for the pure blood samples was similar: respectively, 39.1 ± 31.5–46.7 HU and 39.1 ± 31.5–46.7 HU (Fig 2 and the Table). The blood-iodine mixtures, consisting of [2/3] blood + [1/3] iodine; [1/2] blood + [1/2] iodine; [1/3] blood + [2/3] iodine had almost identical attenuation values on conventional images: 49.48 ± 42.8–56.2 HU, 49.2 ± 41.7–56.7 HU, and 49.4 ± 42.2–56.6 HU, respectively. Meanwhile, the corresponding VNC attenuation values incrementally decreased with an increasing iodine fraction, measuring 40.4 ± 35.9–44.9 HU, 32.6 ± 28.6–36.6 HU, and 26.0 ± 23.3–28.6 HU, respectively.
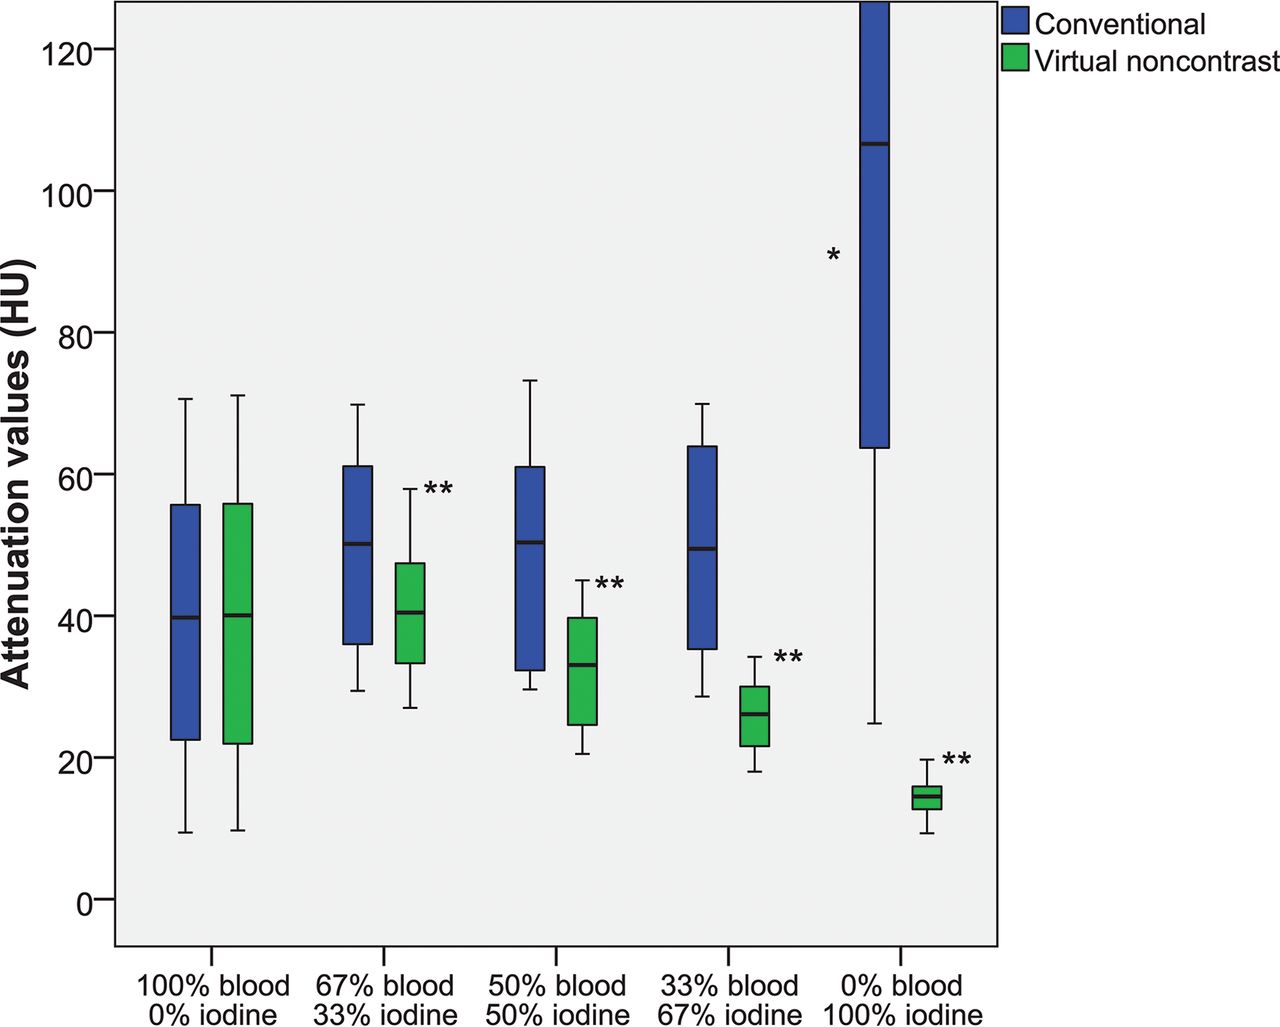
Attenuation values (HU) of diluted blood, blood-iodine mixtures, and diluted iodine on spectral detector CT conventional and virtual noncontrast images. There is a significant incremental decrease of VNC attenuation values with decreasing blood content. The asterisk indicates a significant difference of conventional CT attenuation compared with other compositions (P < .01); double asterisks, significant differences of VNC attenuation among these compositions (P < .01).
Attenuation values (HU) of diluted blood, blood-iodine mixtures, and diluted iodine on SDCT conventional and VNC imagesa
Differences in attenuation on the conventional images among the different investigated compositions containing a blood component were not significant (P > .05). Conversely, VNC attenuation values were significantly different among samples containing 67% blood, 50% blood, and 33% blood, but not among samples consisting of 100% and 67% blood (P = .70).
Conventional and VNC attenuation correlated significantly for all samples containing a blood component (R2 > 0.97, P < .01). Correlation was highest for pure blood dilutions (R2 = 1.00), followed by [2/3] blood + [1/3] iodine, [1/2] blood + [1/2] iodine mixtures, and it was lowest for samples containing [1/3] blood + [2/3] iodine (R2 = 0.97).
Correlation between the hematocrit level in our samples and VNC attenuation was excellent (R2 = 0.97, P < .01), while correlation with the attenuation on the conventional images was moderate, but still significant (R2 = 0.50, P < .01) (Fig 3).

Correlation between the hematocrit in our dilutions and the attenuation in the conventional and VNC images.
For the samples consisting only of diluted iodine, mean attenuation on conventional and VNC images (± 95% CI) was 129.5± 99.4–159.6 HU and 14.5 ± 13.4–15.6 HU, respectively, which were both significantly different from other samples containing a blood component (P < .01) (Fig 2 and the Table). When one interprets these results, it is important to note that phosphate buffered saline has different attenuation properties from normal saline. The average attenuation of samples filled with only phosphate buffered saline was 8.5 and 8.3 HU on conventional and VNC images, respectively. Correlation between conventional and VNC attenuation for samples with pure iodine dilutions was not significant (R2 = 0.77, P = .08).
The differences between R-VNC attenuation values of all compositions were significant (P < .01), as shown in Fig 4 and the Table. Mean R-VNC attenuation (± 95% CI) for the pure blood, [2/3] blood − [1/3] iodine, [1/2] blood − [1/2] iodine, [1/3] blood − [2/3] iodine, and pure iodine was 99.59% ± 98.8%–100.4%, 82.8% ± 79.5%–86.1%, 67.6% ± 64.4%–70.9%, 54.3% ± 50.6%–58.0%, and 15.7% ±12.4%–19.1%. There was no overlap within the 95% CI between R-VNC values for all compositions, contrary to VNC values in which all samples containing blood showed overlap.

Relative VNC attenuation (%), by comparing VNC attenuation with the attenuation on conventional CT for all investigated categories (diluted blood, blood-iodine mixtures, and diluted iodine). R-VNC values among all compositions were significantly different (P < .01).
There was a significant correlation between measured and true iodine concentrations (R2 > 0.99, P < .01), with a mean iodine quantification error of −0.41 ± 0.31–0.50 mg/mL) (Fig 5).

Results of the iodine quantification measurements by comparison of measured-to-true iodine concentrations (A) and errors in iodine quantification measurements by a Bland-Altman plot (B). A, Correlation between measured and true iodine concentrations is excellent (R2 > 0.99, P < .01). B, Mean iodine quantification error (± 95% CI) was −0.41 ± 0.31–0.50 mg/mL).
Receiver operating characteristic curve analysis for hemorrhagic-component detection showed a significant difference among areas under the curve (P < .01), being highest for VNC attenuation (0.97 ± 0.94–0.99 HU), followed by R-VNC attenuation (0.87 ± 0.77–0.97 HU) and attenuation in the conventional CT images (0.29 ± 0.16–0.41 HU), and lowest for iodine quantification (0.16 ± 0.06–0.25 HU) (Fig 6A); these differences were significant (P < .01). Using a threshold of ≥10 and ≥20 HU for VNC had a sensitivity/specificity of 100%/23% and 89%/95%, respectively. An R-VNC attenuation of ≥40% had a sensitivity/specificity of 100%/82%. Conversely, using a threshold of ≥10 and ≥20 HU on the conventional CT images had a sensitivity/specificity of 100%/13% and 94%/15%, respectively (Fig 6).
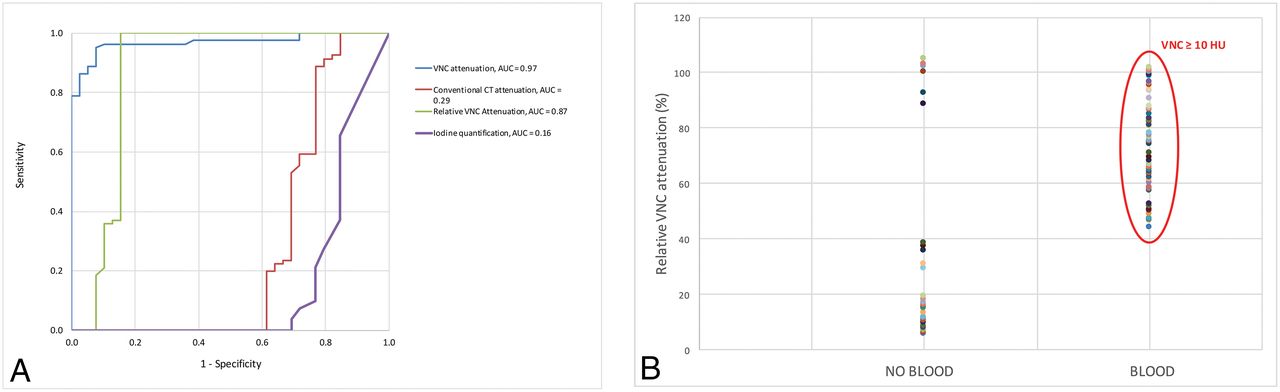
Performance of conventional CT attenuation, virtual noncontrast attenuation, and relative VNC attenuation for the detection of blood. A, Receiver operating characteristic curve analysis shows the highest area under the curve for VNC (0.97 ± 0.94–0.99), followed by R-VNC attenuation (0.87 ± 0.77–0.97) and attenuation in the conventional CT images (0.29 ± 0.16–0.41), and the area under the curve was lowest for iodine quantification (0.16 ± 0.06–0.25). B, When we combined a ≥40% R-VNC (dashed line) and ≥10 HU VNC cutoff, there is 100% differentiation between blood-containing (diluted blood and blood-iodine mixtures) and diluted iodine samples.
Discussion
Our results show that SDCT has excellent diagnostic accuracy for differentiating blood from iodinated contrast in a phantom. We observed similar sensitivity and specificity (both >90%) for hemorrhage detection using spectral dual-layer VNC images, compared with previous clinical studies that used single- or dual-source dual-energy CT.10,13,15 These studies used visual assessment by radiologists for classifying hyperdensities on “simulated” conventional head CT images as hemorrhage or iodine; hyperdensities visible on VNC images were classified as having a hemorrhagic component. Although typical ICHs are hyperdense (>50 HU), they can be associated with a lower density due to anticoagulation, the presence of CSF with arachnoid laceration, or severe anemia (eg, sickle cell anemia), which can complicate subjective assessment.20⇓⇓⇓⇓⇓⇓⇓⇓–29 Our results show high accuracy by quantitative VNC assessment for blood detection, including low densities on conventional images (as low as 10 HU). By combining a ≥10 HU VNC and ≥40% R-VNC cutoff, we observed a sensitivity and specificity of 100% for blood, including low densities and mixtures with iodine on conventional images (Fig 6).
Several authors have investigated the accuracy of SDCT for material decomposition, which allows iodine to be subtracted from an image. These studies have shown high accuracy for iodine-quantification and VNC attenuation values, though results vary. Our results show slightly lower iodine-quantification accuracy than recent publications, which can be explained by the extremely low iodine concentrations needed in our study, though results are still excellent. We had results comparable with those of Pelgrim et al,30 which showed a median error of −0.6 mg/mL, while more recent studies showed differences ranging from −0.46 to 0.1 mg/mL.31 Regarding VNC, Duan et al31 showed good agreement between measured spectral detector VNC attenuation values and reference standards (−9.95–6.41 HU), confirmed by our study. Still, VNC inaccuracies can occur. When we incorporated a comparison of the attenuation between VNC and conventional images, small inaccuracies of true VNC values can be negated, which can explain the excellent results of R-VNC in our study for hemorrhage detection (100% sensitivity and 82% specificity) and size estimation (Figs 4 and 5).
Clinical studies using SDCT differentiating iodine from blood in skull imaging have been rare. As of this writing, the authors found only a pilot study from Cho et al,32 showing that spectral data analysis can be helpful in discriminating ICH from contrast enhancement in intracranial malignancies. Regarding the detection of hemorrhage, a recent study of Nute et al33 used single-source dual-energy CT for distinguishing ICH from calcification in a phantom model with densities from 40 to 100 HU, resulting in an accuracy of >90%.
There are several limitations to our study. First, our results are without clinical data because this was not within the scope of our investigation. Our goal was to investigate in a phantom setting. Second, our hemorrhage dilutions were prepared with phosphate buffered saline to prevent red blood cell hemolysis, but this could potentially bias the attenuation characteristics of blood and iodine in our results: Phosphate buffered saline is not representative of brain tissue in a clinical setting. Third, our mixtures were homogeneously mixed for optimal spectral analysis, which may not always be the case in a clinical setting. Last, we used a relatively large 2-cm2 ROI for our measurements, so our results could not be affected by spatial resolution and partial volume limitations. This might not always be feasible in patients if the size of the clinical ROI is small.
Conclusions
Our results show that the added spectral information of SDCT has high sensitivity and specificity in detecting blood and can accurately estimate hemorrhagic component size, including when mixed with iodine. This information could be of potential benefit in brain imaging for patients following reperfusion therapy in acute stroke.
Footnotes
Disclosures: Steven Van Hedent—RELATED: Grant: Philips Healthcare, Comments: Partial funding support was provided by Philips Healthcare under a research agreement with University Hospitals Cleveland Medical Center and Case Western Reserve University.* Nils Grosse Hokamp—RELATED: Grant: University Hospitals Cleveland Medical Center/Case Western Reserve University/Philips Healthcare, Comments: Part of this Research was funded under a research agreement among University Hospitals Cleveland Medical Center, Case Western Reserve University, and Philips Healthcare*; UNRELATED: Payment for Lectures Including Service on Speakers Bureaus: Philips Healthcare, Comments: Speakers Bureau; Payment for Development of Educational Presentations: Philips Healthcare. Nico Buls—UNRELATED: Payment for Lectures Including Service on Speakers Bureaus: GE Healthcare, Comments: lectures on dual-energy CT.* Pablo Ros—UNRELATED: Other: Philips Healthcare, Comments: The CT unit where this research was performed is provided by Philips Healthcare to our hospital to test clinical applications. This project was an exhibit in our existing Master Research Agreement. No direct funds were received*; OTHER RELATIONSHIPS: hospital grant from Philips regulated by Master Research Agreement, consisting of a Spectral Detector CT unit. David Jordan—RELATED: Grant: Philips Healthcare, Comments: The IQon CT scanner was provided to University Hospitals Cleveland Medical Center under a research agreement*; UNRELATED: Payment for Lectures Including Service on Speakers Bureaus: Medical Technology Management Institute/Herzing University, Comments: paid speaker for continuing education programs for medical physicists. Kai Roman Laukamp—RELATED: Grant: Philips Healthcare, Comments: Philips Healthcare provided partial funding*. *Money paid to the institution.
Preliminary results previously presented as an electronic poster at: Annual Meeting of the European Congress of Radiology, February 28 to March 4, 2018;Vienna, Austria.
This work was partially supported by Philips Healthcare under a research agreement with University Hospitals Cleveland Medical Center and Case Western Reserve University.
References
- Received June 3, 2018.
- Accepted after revision August 28, 2018.
- © 2018 by American Journal of Neuroradiology


Jump to section
Related Articles
Cited By...
- Determinants and Clinical Relevance of Iodine Contrast Extravasation after Endovascular Thrombectomy: A Dual-Energy CT Study
- Utilizing dual energy CT to distinguish blood from contrast leakage following middle meningeal artery embolization for chronic subdural hematomas
- Prediction of Hemorrhage after Successful Recanalization in Patients with Acute Ischemic Stroke: Improved Risk Stratification Using Dual-Energy CT Parenchymal Iodine Concentration Ratio Relative to the Superior Sagittal Sinus
- Virtual Monoenergetic Images from Spectral Detector CT Enable Radiation Dose Reduction in Unenhanced Cranial CT