
Abstract
BACKGROUND AND PURPOSE: For the postoperative follow-up in pediatric patients with Moyamoya disease, it is essential to evaluate the degree of neovascularization status. Our aim was to quantitatively assess the neovascularization status after bypass surgery in pediatric Moyamoya disease by using color-coded digital subtraction angiography.
MATERIALS AND METHODS: Time-attenuation intensity curves were generated at ROIs corresponding to surgical flap sites from color-coded DSA images of the common carotid artery, internal carotid artery, and external carotid artery angiograms obtained pre- and postoperatively in 32 children with Moyamoya disease. Time-to-peak and area under the curve values were obtained. Postoperative changes in adjusted time-to-peak (ΔTTP) and ratios of adjusted area under the curve changes (ΔAUC ratio) of common carotid artery, ICA, and external carotid artery angiograms were compared across clinical and angiographic outcome groups. To analyze diagnostic performance, we categorized clinical outcomes into favorable and unfavorable groups.
RESULTS: The ΔTTP at the common carotid artery increased among clinical and angiographic outcomes, in that order, with significant differences (P = .003 and .005, respectively). The ΔAUC ratio at the common carotid artery and external carotid artery also increased, in that order, among clinical and angiographic outcomes with a significant difference (all, P = .000). The ΔAUC ratio of ICA showed no significant difference among clinical and angiographic outcomes (P = .418 and .424, respectively). The ΔTTP for the common carotid artery of >1.27 seconds and the ΔAUC ratio of >33.5% for the common carotid artery and 504% for the external carotid artery are revealed as optimal cutoff values between favorable and unfavorable groups.
CONCLUSIONS: Postoperative changes in quantitative values obtained with color-coded DSA software showed a significant correlation with outcome scores and can be used as objective parameters for predicting the outcome in pediatric Moyamoya disease, with an additional cutoff value calculated through the receiver operating characteristic curve.
ABBREVIATIONS:
- AUC
- area under the curve
- CCA
- common carotid artery
- ΔAUC ratio
- adjusted area under the curve changes
- ΔTTP
- difference between preoperative and postoperative time-to-peak
- ECA
- external carotid artery
- EDAS
- encephaloduroarteriosynangiosis
- MMD
- Moyamoya disease
Moyamoya disease (MMD) is a cerebrovascular disease causing progressive steno-occlusive changes at the terminal portion of the ICAs or proximal areas of the anterior or middle cerebral arteries with compensatory development of a fine vascular network, the so-called “Moyamoya” vessels.1⇓⇓–4 Surgical neovascularization is considered the most successful means of improving cerebral hemodynamics and resolving clinical symptoms.1,2,4⇓⇓–7 These surgical procedures can be categorized into 3 types: direct, indirect, or combined bypass.1,2,5⇓⇓⇓–9 Indirect bypass surgery using the parietal branch of the superficial temporal artery, encephaloduroarteriosynangiosis (EDAS), is preferred in pediatric patients with MMD because of the simple technique and the lower risk of temporary ischemia during the operation.5,10⇓–12 Additional bifrontal encephalogaleo(periosteal)synangiosis can be performed to reinforce the anterior circulation.
After bypass surgery, it is essential to evaluate the degree of neovascularization via the external carotid artery (ECA) system and subsequent changes occurring in the ICAs. DSA is thought to be the most reliable imaging technique for these purposes and has been used for initial diagnosis and evaluation of neovascularization. However, evaluation of neovascularization after bypass surgery with DSA is usually subjective and could not provide the objective information for the postoperative revascularization status.
Recently, a color-coded postprocessing software program for the quantitative analysis of DSA was introduced13 and used as guidance for thrombolytic therapy or embolization and for perfusion analysis in adult patients with MMD.14⇓–16 The purpose of this study was to quantitatively assess the neovascularization status after indirect bypass surgery in children with MMD by using postprocessing software.
Materials and Methods
Patients
The institutional review board of Seoul National University Hospital approved this retrospective study; informed consent was waived. From August 2012 to March 2014, 198 patients underwent DSA for underlying MMD in our institution. We included patients with both preoperative and postoperative DSA after an initial unilateral EDAS. Ninety-one patients were excluded because there were no available preoperative (n = 23) or postoperative (n = 68) DSA images. Seventy-five patients were excluded because DSA images were obtained with a different protocol between the pre- and postoperative DSAs (no available common carotid artery [CCA] angiogram, n = 28; different contrast media injection rate and volume, n = 35; different magnification, n = 12).
Finally, 32 patients (13 male and 19 female; mean age, 8.0 years; range, 3∼18 years) were included. Initial symptoms included motor TIA in 22 patients (68.8%), seizures in 6 patients (18.8%), headache in 2 patients (6.3%), and sensory TIA in 2 patients (6.3%). Among these, 23 patients (71.9%) underwent EDAS and 9 patients (28.1%) underwent unilateral EDAS and bifrontal encephalogaleo(periosteal)synangiosis simultaneously. Selection of the side for the initial operation was determined on the basis of the dominant hemisphere of the patient, symptom severity, and perfusion alteration based on MR imaging. None suffered from postoperative complications, including hemorrhage or infarction involving the ipsilateral brain hemisphere, seen on the postoperative imaging studies such as CT or MR imaging.
Conventional DSA
All enrolled patients underwent both preoperative and postoperative cerebral angiography in a dual-plane angiographic machine (Axiom Artis; Siemens, Erlangen, Germany) performed by 3 pediatric radiologists (Y.H.C, H.-H.C., and S.-M.L., with 10, 6, and 6 years of experience, respectively). A 4F or 5F Davis angiographic catheter (A&A Medical Device, Gyeonggi-do, Korea) was used according to the patient's femoral artery diameter. All procedures were performed with same catheter diameter for both preoperative and postoperative cerebral angiography. Conventional DSA images included anteroposterior and lateral ICA, ECA, and CCA angiograms. Diluted contrast media (iobitridol; Xenetix 350; Guerbet, Aulnay-sous-Bois, France) with a contrast-to-normal-saline ratio of 1:1 was used with an automatic injector (Angiomat Illumena; Liebel-Flarsheim, Cincinnati, Ohio). The injection rate and amount were determined by the operator on the basis of the size of each vessel. The mean injection rates for patients younger than 5 years of age were 2 mL/s for the CCA, 1 mL/s for the ICA, and 1.5 mL/s for the ECA. The rates for patients older than 5 years were approximately 3 mL/s for the CCA, 1.5 mL/s for the ICA, and 2 mL/s for ECA angiography, and they were adjusted for each patient's circumstances. The injection duration of contrast material was fixed for 2 seconds. The same contrast injection rate and amount were used for pre- and postoperative DSA in each patient. The mean time interval between pre- and postoperative DSA was approximately 82.9 days (range, 72∼103 days), and the mean time interval between the operation and postoperative DSA was approximately 76.2 days (range, 64∼96).The stages of preoperative DSA were classified by using the criteria of Suzuki and Kodama17: stage 1 (n = 4), stage 2 (n = 9), and stage 3 (n = 19).
Postprocessing of DSA
Postprocessing of DSA images was performed by using syngo iFlow (Siemens). With this program, we could obtain a color-coded (range from red to blue) single image showing the history of contrast material passage through vessels, which reflected the time from injection. This color map provided flow velocity and total amount of injected contrast material passing through the vessels. We also obtained signal-intensity curves of the selected ROIs, adjusted with a reference ROI. Two pediatric radiologists (H.-H.C. and S.-M.L. with 6 years of experience each) drew a rectangular ROI (approximately 2500 mm2) to cover the EDAS flap in consensus. A round reference ROI was drawn within the proximal input artery (approximately 10 mm2) at the level of the atlas for maintenance of the identical location between the pre- and postinterventional DSAs (Fig 1A). A time-attenuation intensity curve was obtained automatically and summarized the maximum concentration of contrast passing through the ROI at that point (Fig 1B). Using the curve, the program automatically calculated the “peak time of contrast concentration,” which corresponds to time-to-peak of perfusion MR imaging. The calculated area under the curve (AUC) is the total amount of contrast material passed, which corresponds to the cerebral blood volume of the perfusion MR imaging. The TTP difference (ΔTTP) in seconds was calculated by subtracting the TTP of the preoperative DSA from the TTP of the postoperative DSA. For the AUC, the adjusted area under the curve changes (ΔAUC ratio) in percentages were calculated by dividing the difference between post- and preoperative AUCs by the preoperative AUC values (Fig 1C):
 In this study, postprocessing of DSA was performed by using only a lateral projection because detection of the EDAS flap site was easier than in anteroposterior images. Likewise, the widely used angiographic staging method for MMD, the Matsushima classification, also used lateral images for evaluating neovascularization degree.18

Postprocessing cascade of the DSA image. A, A color-coded single image is obtained from DSA images of CCA angiography; then, we draw selected ROIs along the estimated EDAS flap site. A reference ROI is drawn within the proximal input artery. B, The time-attenuation intensity curve is obtained automatically. The superior green line represents the time-attenuation intensity curve within the selected ROI, and the inferior red line represents that of the reference ROI. C, Using the time-attenuation intensity curve, we calculated the TTP and AUC within the selected ROI, adjusted by the reference ROI.
Angiographic Outcome Group
To classify postoperative neovascularization status, we used the Matsushima 3-grade method.18 The “good group” was defined as more than two-thirds of the MCA distribution supplied by neovascularization after surgery. The “fair group” was defined as a neovascularization area covering between two-thirds and one-third of the MCA distribution. The “poor group” was defined as only 1 cortical branch of the MCA covered through the bypass or no collateral circulation observed. Angiographic outcomes were classified by a radiologist after each procedure.
Clinical Outcome Group
Postoperative clinical outcomes were classified according to ipsilateral MCA symptoms (such as TIAs or seizures) by the clinician at the time of admission for the postoperative angiography, blinded to the results of imaging studies, including MR imaging, perfusion MR imaging, or DSA.6,19 The “excellent group” represented total disappearance of symptoms (such as TIAs or seizures) without fixed neurologic deficits. The “good group” represented total disappearance of symptoms, but with neurologic deficits remaining. The “fair group” represented persistent symptoms, albeit less frequently. The “poor group” represented remaining unchanged or worsened symptoms. The excellent and good groups were considered favorable outcomes, and the fair and poor groups were considered unfavorable outcomes in receiver operating characteristic curve analysis. Anterior cerebral artery symptoms, such as paraparesis or urinary incontinence, were not considered in this study because it was designed for the evaluation of the neovascularization status of EDAS sites.
Statistical Analysis
Comparisons between AUC differences in CCA, ECA, and ICA angiograms and mean TTP differences in the CCA between pre- and postoperative studies in each clinical and angiographic outcome group were analyzed by using the Jonckheere-Terpstra test by using PASW software for Windows (Version 18.0; IBM, Armonk, New York). To determine the diagnostic performance of parameters in each angiogram, we performed receiver operating characteristic analysis by using MedCalc for Windows (MedCalc Software, Mariakerke, Belgium). P values < .05 were statistically significant.
Results
DSA Parameters and Clinical Outcome
Sixteen patients showed excellent; 4 patients, good; 8 patients, fair; and 4 patients, poor clinical outcomes. After neovascularization surgery, postoperative TTP decreased compared with preoperative TTP in CCA angiography in the excellent, good, and fair clinical outcome groups. In the poor clinical outcome group, postoperative TTP increased compared with preoperative TTP. The ΔTTP values in CCA angiography were significantly different among clinical outcome groups (P = .003), and a gradual decrease of ΔTTP was noted from the excellent-to-poor groups.
Calculated ΔAUC ratios in CCA angiography showed a significant increase among clinical outcome groups in sequence from poor to excellent (P = .000). Mean ΔAUC ratios in CCA angiography were 68.1% for excellent, 31.5% for good, 9.1% for fair, and −11.3% for poor. The ΔAUC ratios of ECA angiography also showed a significant increase among clinical outcome groups in sequence from poor to excellent (P = .000). The ΔAUC ratios in ECA angiography were 1119.8% for excellent, 768.2% for good, 279.5% for fair, and 248.7% for poor. Figures 2 and 3 show representative cases with pre- and postoperative DSA images in the excellent and poor clinical outcome groups. The ΔAUC ratios in ICA angiography showed no significant difference among the clinical outcome groups (P = .418). The ΔAUC ratios in ICA angiography were −41.0% for excellent, −35.6% for good, −44.2% for fair, and −22.3% for poor (Table 1).

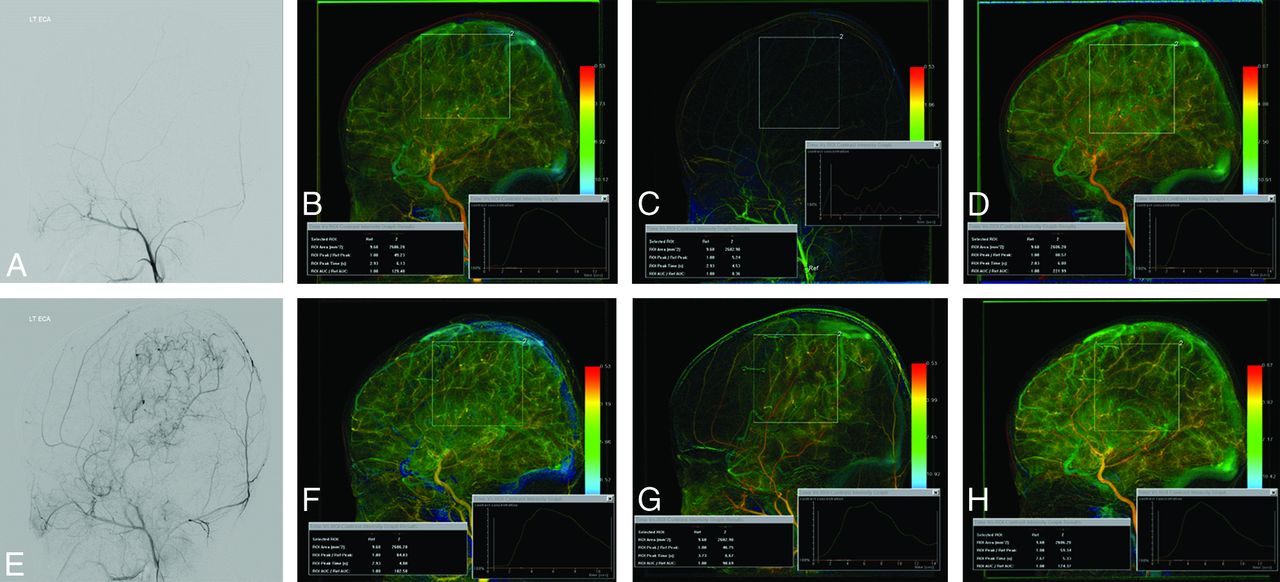
A 4-year-old boy with excellent clinical outcome after EDAS neovascularization. Comparing pre- (A) and post- (E) operative ECA angiograms shows good neovascularization after EDAS. Postprocessed pre- (B) and post- (F) operative CCA angiograms show shortening of TTP of approximately 2.3 seconds and an increase of the percentage of AUC difference of about 51.0% after the operation. Approximately a 1080.5% increment of the percentage of AUC difference after surgery is noted when comparing pre- (C) and post- (G) operative ECA angiograms, and an approximate 44.0% of AUC difference decrease is noted when comparing pre- (D) and post- (H) operative ICA angiograms.

A 5-year-old boy with poor clinical outcome after EDAS neovascularization. Comparing pre- (A) and post- (E) operative ECA angiograms shows poor neovascularization after EDAS. Postprocessed pre- (B) and post- (F) operative CCA angiograms show no definite shortening of the TTP (0.0 seconds), with a decrease of the percentage of AUC difference of approximately 2.0% after the operation. About a 41.2% increase of the percentage of AUC difference after the operation is noted when comparing pre- (C) and post- (G) operative ECA angiograms, and about a 13.7% of AUC difference increase is noted when comparing pre- (D) and post- (H) operative ICA angiograms.
Relationships between DSA parameters and clinical outcomes
DSA Parameters and Angiographic Outcome
Angiographic outcome by using the Matsushima grade was good in 16, fair in 7, and poor in 9 patients. ΔTTP showed a statistically significant difference among angiographic outcome groups in CCA angiography (P = .005), and a gradual decrease of ΔTTP was noted from good to poor.
The ΔAUC ratios in CCA angiography showed a statistically significant difference among angiographic outcome groups in sequence from poor to excellent (P = .000), being approximately 64.5% for good, 29.8% for fair, and 0.4% for poor. The ΔAUC ratios of ECA angiography also showed a statistically significant difference among the angiographic outcome groups in sequence from poor to excellent (P = .000). The ΔAUC ratios in ECA angiography were noted as approximately 1065.9% for good, 753.1% for fair, and 210.5% for poor. The ΔAUC ratios of ICA angiography showed no significant difference among the angiographic outcome groups (P = .424). The ΔAUC ratios in ICA angiography were approximately −41.0% for good, −42.4% for fair, and −32.2% for poor groups (Table 2).
Relationships between DSA parameters and angiographic outcomes
The ΔTTP and ΔAUC ratio showed no significant difference between EDAS only and unilateral EDAS in the bifrontal encephalogaleo(periosteal)synangiosis groups (P = .76).
Cutoff Value between Favorable and Unfavorable Groups
According to receiver operating characteristic analysis, an optimal cutoff value of 1.27 seconds was obtained for the difference between pre- and postoperative adjusted TTP in CCA angiography, with 81.4% sensitivity and 91.7% specificity between favorable and unfavorable groups. The optimal cutoff value for the difference ratio of the AUC in CCA angiography was 33.5%, with 81% sensitivity and 100% specificity, while that in ECA angiography was 504%, with 85.3% sensitivity and 92% specificity (Table 3).
Cutoff values between favorable and unfavorable groups
Discussion
The optimal goal for EDAS in pediatric patients with MMD is to re-establish cerebral blood flow to hypoperfused areas by using angiogenesis from parietal branches of the superficial temporal artery.20 After the operation, collateral vessels from the superficial temporal artery develop at the flap site, along with simultaneous and sequential progression of steno-occlusive changes of the ICA and disappearance or diminishing of Moyamoya vessels.18,21 Hemodynamic changes after the operation might be difficult to understand; likewise, estimating postoperative neovascularization status is challenging. Noninvasive imaging modalities such as perfusion MR imaging, single-photon emission CT, and positron-emission tomography can demonstrate secondary hemodynamic changes.1⇓⇓–4,12,21⇓⇓⇓⇓⇓–27 However, these methods show only overall cerebral perfusion changes and cannot directly visualize fine parenchymal neovascularization itself following the operation.
Concerning the evaluation of postoperative neovascularization status, DSA is still the most reliable imaging technique and is widely used for the initial diagnosis and follow-up of MMD.1,9,19 DSA also provides anatomic information of vessels and direct visualization of steno-occlusive changes and visualizes neovascularization status after the operation. However, it cannot provide the objective perfusion parameters. It might be difficult to compare the change in the DSA during longitudinal or postoperative follow-up. The decision for the postoperative stage might be made only by the operator.
In this study, to supplement these shortcomings of DSA, we used the postprocessing software syngo iFlow. This software calculates opacity changes within each pixel at each moment and then summates these to make a color-coded map of contrast flow. With this software, additional hemodynamic information can be obtained from serial DSA images without additional radiation exposure or contrast material, with a simplified method with little effort.
Although this study included only hemodynamic changes within the operative bed, we predicted that the increase of AUC with shortening TTP might be noted on CCA and ECA angiography. We also predicted that a decrease of AUC in ICA angiography might be noted after neovascularization surgery because ICA flows, including basal collaterals (Moyamoya vessels), are no longer required to function as collateral pathways. The actual results showed patterns similar to our estimations, except in the poor clinical outcome group. The largest ΔTTP, which represents the degree of shortening-delayed TTP due to neovascularization, was noted in the excellent clinical outcome group on CCA angiography. The largest increment of the ΔAUC ratio, which represents increased CBV through neovascularization, was also noted in the excellent clinical outcome group in CCA and ECA angiography. We suggest that the values obtained from CCA angiography provide real hemodynamic changes because those values might include both increased blood flow through neovascularization of the superficial temporal artery and diminished blood flow through the ipsilateral ICA.
With receiver operating characteristic analysis, improved TTP delay of >1.27 seconds and improved percentage AUC difference of >33.5% for CCA and 504% for ECA angiography are optimal cutoff values between favorable and unfavorable groups with reliable sensitivity and specificity. Using these cutoff values, we could provide additional information to predict patient outcomes; and for the unfavorable group, an additional operation for the contralateral side or bifrontal encephalogaleo(periosteal)synangiosis was considered earlier than in the favorable group. In addition, in these cases, shorter imaging and clinical follow-up were recommended.
The mean time interval between the operation and postoperative DSA was approximately 76.2 days (range, 64∼96). Moreover, neovascularization after indirect bypass surgery was known to become well-developed after 3∼6 months postoperatively.20,28⇓⇓–31
There are several study limitations. In some cases, postoperative DSA data might not be enough to provide real hemodynamic status after neovascularization. However, previous studies explained that the neovascularization begins 2 weeks after surgery,21,32,33 so the obtained data in this study could provide the near-complete status of the neovascularization. In addition, although the data obtained from the postoperative DSA might provide the earlier neovascularization status before completion, we thought they might provide the later outcome because the data showed good correlation with the outcomes in this study.
Although neovascularization after indirect bypass surgery develops along the flap site, accurate flap site drawing was difficult; thus, another limitation is that some neovascularization developing outside the flap site was not included in this study. However, the portion of neovascularization developing outside the flap site might be small and therefore negligible. We used a manufactured head fixator for maintenance of the head position during the study, so another limitation of the study could be that there was little difference between the pre- and postoperative DSA. We suggest that the standardized positioning might be helpful for a more exact comparison.
Conclusions
Using simple postprocessing software might provide objective quantitative perfusion values based on obtained DSA images with significant correlation with clinical and angiographic outcomes for pediatric patients with MMD without additional radiation. Furthermore, the cutoff values obtained with receiver operating characteristic analysis may help in predicting patient outcomes after the operation and could affect the establishment of further additional treatment or follow-up plans.
Acknowledgments
We thank Hyung Bin Yu, the project manager of Siemens, Korea, for technical support.
References
- Received July 27, 2015.
- Accepted after revision September 15, 2015.
- © 2016 by American Journal of Neuroradiology


