
Abstract
BACKGROUND AND PURPOSE: White matter hyperintensities of presumed vascular origin in elderly patients with hypertension may be part of a general cerebral perfusion deficit, involving not only the white matter hyperintensities but also the surrounding normal-appearing white matter and gray matter. We aimed to study the relation between white matter hyperintensity volume and CBF and assess whether white matter hyperintensities are related to a general perfusion deficit.
MATERIALS AND METHODS: In 185 participants of the Prevention of Dementia by Intensive Vascular Care trial between 72 and 80 years of age with systolic hypertension, white matter hyperintensity volume and CBF were derived from 3D FLAIR and arterial spin-labeling MR imaging, respectively. We compared white matter hyperintensity CBF, normal-appearing white matter CBF, and GM CBF across quartiles of white matter hyperintensity volume and assessed the continuous relation between these CBF estimates and white matter hyperintensity volume by using linear regression.
RESULTS: Mean white matter hyperintensity CBF was markedly lower in higher quartiles of white matter hyperintensity volume, and white matter hyperintensity volume and white matter hyperintensity CBF were negatively related (standardized β = −0.248, P = .001) in linear regression. We found no difference in normal-appearing white matter or GM CBF across quartiles of white matter hyperintensity volume or any relation between white matter hyperintensity volume and normal-appearing white matter CBF (standardized β = −0.065, P = .643) or GM CBF (standardized β = −0.035, P = .382) in linear regression.
CONCLUSIONS: Higher white matter hyperintensity volume in elderly individuals with hypertension was associated with lower perfusion within white matter hyperintensities, but not with lower perfusion in the surrounding normal-appearing white matter or GM. These findings suggest that white matter hyperintensities in elderly individuals with hypertension relate to local microvascular alterations rather than a general cerebral perfusion deficit.
ABBREVIATIONS:
- ATT
- arterial transit time
- β
- standardized β
- NAWM
- normal-appearing white matter
- preDIVA
- Prevention of Dementia by Intensive Vascular Care trial
- preDIVA-M
- MRI substudy of the preDIVA trial
- WMH
- white matter hyperintensity
White matter hyperintensities (WMHs) of presumed vascular origin are a common finding on brain MR imaging in elderly individuals. WMH prevalence estimates in asymptomatic older individuals range from 45% to >90%, depending on age and severity.1 Clinically, WMHs are associated with cognitive decline, neuropsychiatric symptoms, loss of functional independence, and increased mortality.2,3 Advanced age and hypertension are the strongest risk factors for WMHs, especially for the confluent subtype.1⇓⇓–4
The pathophysiology of WMHs has not yet been fully elucidated. They often appear together with other signs of cerebral small-vessel disease, an umbrella term for neuroradiologic anomalies often found in asymptomatic elderly individuals.4,5 Histologically, confluent WMHs appear as a continuum of increasing tissue damage resembling chronic low-grade ischemia.1,5 Therefore, WMHs may be the result of chronic low-grade white matter hypoperfusion.1,5,6 In agreement, CBF within WMHs is lower compared with normal-appearing WM (NAWM).7⇓⇓⇓⇓⇓⇓–14
Whether WMHs are associated with a lower cerebral perfusion in general, also involving the surrounding NAWM and gray matter, is unclear. Some findings suggest that WMHs may relate to lower whole-brain or GM perfusion,7,11,15,16 and WMHs have been associated with reduced blood flow velocity in the large intracranial arteries, outside the WM.17⇓–19 On a broader level, the association between WMHs and chronic cardiac disease also hints at a relation with general perfusion.20 WMHs primarily originate in physiologically poorly perfused areas (ie, the periventricular and deep WM), explaining how even a slight cerebral perfusion deficit could provoke low-grade ischemia in those regions associated with WMHs.21,22 Low perfusion in NAWM has also been associated with subsequent WMH development.23 While these findings seem to suggest that WMHs are related to a perfusion deficit extending beyond the WMHs, current evidence remains circumstantial.
In this study, we address the hypothesis that WMHs are associated with lower cerebral perfusion, not only within the WMHs but also in the surrounding NAWM and GM. If so, this could be a first step in determining why WMHs form in elderly individuals and toward preventive treatment. Because age and hypertension are the strongest risk factors for asymptomatic WMHs, we tested this hypothesis in a large cohort of community-dwelling elderly with hypertension, by using noninvasive arterial spin-labeling MR imaging. Arterial spin-labeling was chosen because this method of perfusion measurement allows noninvasive (ie, without contrast) MR imaging measurement of CBF within a scanning time of as little as 4 minutes, facilitating large-scale CBF measurement in research settings and eventually enabling clinical application.
Materials and Methods
Participants
This study was approved by the Academic Medical Centre institutional review board in accordance with the Declaration of Helsinki and the ethical standards of the institution. All participants provided written informed consent before MR imaging. Participants were recruited from the Prevention of Dementia by Intensive Vascular Care trial (preDIVA). This is an ongoing randomized controlled trial in community-dwelling elderly individuals without dementia to study the efficacy of a nurse-led intervention aimed at vascular risk factor modification to prevent dementia.24 A random subset of participants with systolic hypertension (>140 mm Hg) at baseline without dementia and any other severe medical conditions likely to impede 4-year follow-up (eg, terminal illness, late-stage heart failure, and chronic obstructive pulmonary disease) were invited to participate in the preDIVA-MR imaging (preDIVA-M) substudy. In total, 195 participated in preDIVA-M, equally distributed across intervention (n = 96) and control (n = 99) groups of the preDIVA trial. Because the preDIVA trial intervention, consisting of rigorous implementation of normal cardiovascular health guidelines, is unlikely to affect the relation between WMHs and CBF, for the current analyses, the group was considered as a single cohort irrespective of treatment allocation. MR imaging was performed after the second preDIVA clinical assessment took place, between 2 and 4 years after the preDIVA baseline assessment. Clinical data used in this study were derived from this second assessment. The median time between clinical assessment and MR imaging was 238 days (interquartile range, 147–429 days). Collected data included the presence of vascular risk factors (systolic and diastolic blood pressure, smoking status [current, former, never], and body mass index). Medical history was obtained through self-reporting, cross-referenced with the general practitioner's medical records, and included diabetes mellitus, stroke, TIA, and cardiovascular disease, comprising angina pectoris, myocardial infarction, and peripheral arterial disease.
MR Imaging Acquisition
All imaging was performed on a 3T Intera scanner (Philips Healthcare, Best, the Netherlands) with a sensitivity encoding 8-channel head coil. Foam padding was used to restrict head motion. An isotropic 1-mm3 3D T1-weighted sequence (TR, 6.6 ms; TE, 3.1 ms; flip angle, 9°; FOV, 270 × 270 mm2; 170 sagittal sections; 1.2-mm section thickness; 1.1 × 1.1 mm2 in-plane resolution) and an isotropic 1-mm3 3D FLAIR sequence (TR/TE, 4800/355 ms; TI, 1650 ms; FOV, 250 × 250 mm2; 160 sagittal sections; 1.12-mm thickness, interpolated to 0.56-mm thick [overcontiguous] sections during reconstruction; 1.1 × 1.1 mm2 in-plane resolution) were performed. Consecutively, 2 gradient-echo single-shot echo-planar imaging pseudocontinuous arterial spin-labeling sequences (matrix, 64 × 64; TR/TE, 4000/17 ms; flip angle, 90°; FOV, 240 × 240 mm; 17 axial sections; no gap; 7-mm section thickness; sensitivity encoding, 2.5; postlabel delay, 1525–2120 ms; labeling duration, 1650 ms) were obtained: one with flow-crushing diffusion gradients in 3 directions (CBF crushed, b-value = 0.6 s/mm2, velocity-encoding 50 mm/s) and one without (CBF noncrushed, b-value = 0 s/mm2). Twenty dynamics were acquired for each scan, resulting in a total scan duration of 2 × 160 = 320 seconds. Background suppression was implemented with 2 inversion pulses, respectively, 1710 and 2860 ms after a prelabeling saturation pulse. The labeling plane was positioned parallel to the imaging volume, 9 cm inferior to the center of the imaging volume.25
Image Processing
An overview of image processing is provided in On-line Fig 1. WMH segmentation was performed by using a k-Nearest-Neighbors algorithm with tissue-type priors, described and validated previously.26 In total, 194 scans were automatically segmented.
MR imaging data were further processed by using the Statistical Parametric Mapping 8 toolbox (SPM8; http://www.fil.ion.ucl.ac.uk/spm/software/) and custom scripts in Matlab 7.12.0 (MathWorks, Natick, Massachusetts). Arterial spin-labeling data processing and quantification were performed by H.J.M.M.M. (postdoctoral researcher, 6 years of experience) and are described in more detail elsewhere.27 In short, T1-weighted images were segmented into GM and WM probability maps. After motion correction, 2 × 20 pairs of arterial spin-labeled and control images were pair-wise subtracted and subsequently averaged to generate perfusion-weighted maps, which were converted to milliliter/100 g/min by using a single compartment model.28,29 No distinction was made between the quantification of GM and WM voxels. After quantification, the CBF crushed maps were rigid-body registered to the CBF noncrushed maps. For the main analyses, CBF was derived from the crushed CBF maps.
MR Imaging Outcome Measures
WMH volume was calculated from the automatic segmentation maps and was logarithmically transformed to approach a normal distribution. This logarithmically transformed WMH volume was used for all statistical analyses.
Median CBF estimates were taken for the segmented GM, WM, WMHs, and NAWM, operationalized as the WM outside the WMHs. Although extreme values, or outliers, of CBF measurements would be less representative of the study population, they could have a disproportionally large influence on linear regression results. To avoid the strong influence of outliers on the main analyses, we excluded participants with median GM, WM, NAWM, and WMH CBF values differing ≥3 SDs from the group mean.
Atrophy and arterial transit times were considered as MR imaging–derived parameters, potentially confounding the correlation between WMH and CBF. As a proxy for atrophy, which is a longitudinal measure and thus could not be measured, the brain parenchymal fraction was calculated as the ratio (GM + WM volume)/(intracranial volume). Arterial transit time (ATT), which represents the mean arterial transit time from the labeling plane at the level of the cervical arteries to the GM tissue arterioles (On-line Fig 2), was calculated from crushed and noncrushed CBF values by using the flow encoding arterial spin tagging equation,28 as published previously.27
Computations were performed by using Matlab 7.12.0; SPM8 8; the Oxford Centre for Functional MR Imaging of the Brain Software Library, Version 5.030 (FSL; http://www.fmrib.ox.ac.uk/fsl); and SPSS statistics, Versions 20 and 21 (IBM, Armonk, New York) by H.J.M.M.M. (postdoctoral researcher, 6 years of experience) and J.W.v.D. (researcher, 4 years of experience) with the support of M.W.A.C. (postdoctoral researcher, 10 years of experience).
Statistical Analysis
Significance for P values was set at <.05. Two-tailed paired sample t tests were used to compare GM CBF with WM CBF and NAWM CBF with WMH CBF. Differences in mean CBF between quartiles of WMH volume were compared by using 1-way analysis of variance followed by Tukey post hoc testing to identify which quartiles differed significantly from each other.
The relation between WMH volume and CBF in the WMHs, NAWM, and GM was assessed in separate linear regression analyses. In model 1, these analyses were adjusted for total brain volume. In model 2, analyses were additionally adjusted for potential confounders. To identify which confounders to include in model 2, we performed separate linear regression analyses for age, sex, brain parenchymal fraction, ATT, smoking status (current, former, never), history of stroke (including transient ischemic attack), history of other cardiovascular diseases (peripheral arterial disease, angina pectoris, myocardial infarction), diabetes mellitus, body mass index, antihypertensive drug use, systolic blood pressure, and diastolic blood pressure, because these could all potentially affect both CBF and WMH volumes.1,4,5,31,32 Any of these variables individually associated with WMH volume adjusted for total brain volume with a P value ≤ .1 were included as potential confounders in model 2.
Finally, 3 post hoc sensitivity analyses were performed. First, because previous findings suggested that CBF in WMHs, NAWM, and GM may only decrease from a certain minimum threshold of WMH volume,33 the above-mentioned analyses were repeated with exclusion of the participants in the lowest quartile of WMH volume. Second, to assess the influence of excluding participants with CBF values differing ≥3 SDs from the mean from the main analyses, we repeated the main analyses without excluding these participants. Third, because different mechanisms for WMH formations may occur in participants with and without cerebrovascular disease, we performed a sensitivity analysis in which we excluded participants with a history of cerebrovascular disease or lacunar infarcts on MR imaging. For the sensitivity analyses, the outcomes of the adjusted model (model 2) are shown in the “Results” section.
Results
Descriptives
The mean age of the population was 77 ± 2 years, and 53% were women. At the most recent clinical assessment before scanning, 26% of participants' hypertension was under control; 41% had grade I hypertension according to World Health Organization standards; 21%, grade II hypertension; and 11%, grade III hypertension. Other participant characteristics are listed in Table 1. Data of 10 participants were discarded because of processing errors in CBF (n = 9) or WMH (n = 1) assessment. Another 4 participants were excluded from the main analyses due to CBF estimates differing >3 SDs from the mean. Excluded participants (n = 14) did not significantly differ from the included participants (n = 181) regarding demographics and structural MR imaging parameters (On-line Table 1). The median WMH volume was 6.5 mL (interquartile range, 3.6–11.2 mL; range, 0.2–52.1 mL). The mean population CBF in the GM, WM, NAWM, and WMHs is depicted in Fig 1. The mean GM CBF was significantly higher than the WM CBF (43.8 ± 14.2 versus 21.9 ± 7.5 mL/100 g/min, P < .001), and the mean NAWM CBF was significantly higher than the mean WMH CBF (22.5 ± 7.7 versus 10.6 ± 6.3 mL/100 g/min, P < .001).
General characteristicsa
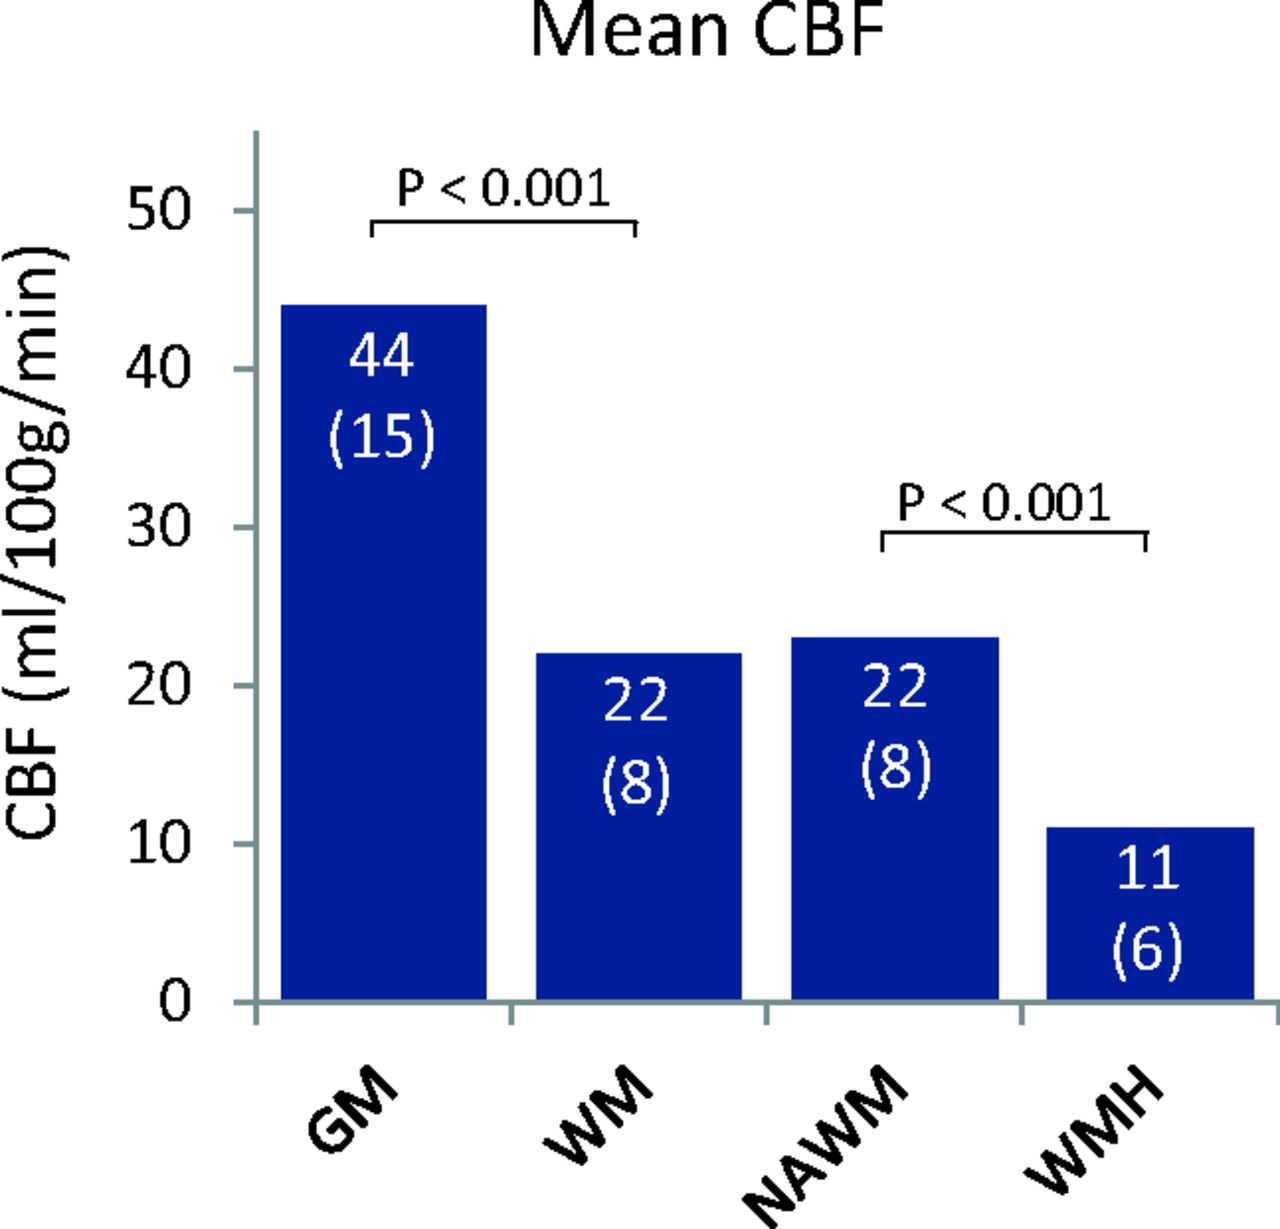
Regional cerebral blood flow. Cerebral blood in the gray matter, white matter, normal-appearing white matter unaffected by WMHs (NAWM), and white matter hyperintensities. Shown are means (SDs) and P values of paired sample t tests.
Analyses per Quartile of WMH Volume
Mean WMH, NAWM, and GM CBF values per quartile of WMH volume are depicted in Fig 2 and On-line Table 2. WMH load in the lowest quartile (n = 45, 24%) was ≤3.58 mL (low WMHs); in the second quartile (n = 48, 26%), 3.59–6.40 mL (mild WMHs); in the third quartile (n = 48, 26%), 6.41–11.18 mL (moderate WMHs); and in the highest quartile (n = 44, 24%), ≥11.18 mL (high WMHs). WMH and CBF maps per quartile of WMH volume are illustrated in On-line Fig 3. From the lower 2 quartiles upward, the mean WMH CBF declined with increasing WMH volume (Fig 2 and On-line Table 2). The mean NAWM and GM CBF did not show any clear relation with WMH volume (Fig 2 and On-line Table 2). One-way analysis of variance showed a significant difference between quartiles of WMH volume in WMH CBF (P = .002) but not in NAWM CBF (P = .244) or GM CBF (P = .059). Tukey post hoc testing revealed that WMH CBF in the quartile with the highest WMH load was significantly lower compared with the quartiles with the lowest (mean difference, 4.2 mL/100 g/min; P = .007) and the second lowest (mean difference, 4.41 mL/100 g/min; P = .007) WMH load.
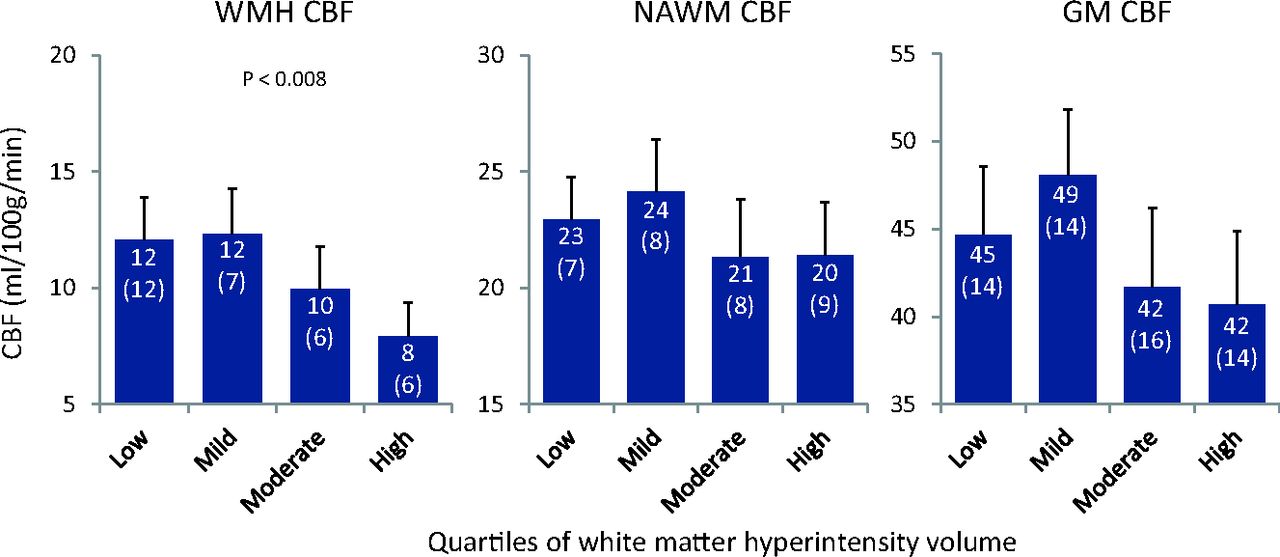
Cerebral blood flow per quartiles of WMH load. Cerebral blood flow in the gray matter, normal-appearing white matter unaffected by WMHs, and white matter hyperintensities in subgroups based on quartiles of WMH volume. Shown are means (SDs) and significant P values of 1-way analysis of variance.
Linear Regression
Results of the linear regression analyses are listed in Table 2. Adjusted for total brain volume (model 1), a higher WMH volume was associated with a lower CBF in WMHs (standardized beta [β] = −0.25, P = .001). No association was found between WMH volume and CBF in NAWM (β = −0.04, P = .643) or GM (β = −0.07, P = .382).
Association between cerebral perfusion and white matter hyperintensity volumea
Results of linear regression of potential confounders with WMH volume are listed in On-line Table 3. Age (β = 0.13, P = .09), brain parenchymal fraction (β = −0.13, P = .10), GM ATT (β = 0.15, P = .046), and antihypertensive use (β = 0.14, P = .07) were associated with WMH volume with a P value ≤ .1 and therefore were included as covariates in model 2. There was no association between WMH and female sex (β = 0.07, P = .47), systolic blood pressure (β = −0.04, P = .63), diastolic blood pressure (β = 0.01, P = .88), smoking status (current versus never, β = −0.06, P = .45; former versus never, β = −0.08, P = .29), history of stroke (β = 0.10, P = .23), history of other cardiovascular diseases (β = −0.06, P = .41), diabetes mellitus (β = 0.01, P = .89), or body mass index (β = −0.10, P = .19).
Adjusted for total brain volume, age, brain parenchymal fraction, and ATT (model 2), WMH volume remained significantly inversely associated with WMH CBF (β = −0.20, P = .029). The relation between WMH volume and GM or NAWM CBF was not significant (Table 2 and Fig 3). There were no statistical interactions between CBF and any of the covariates adjusted for in model 2, indicating that the statistical relation between CBF and WMH volume was independent of any of these covariates. The sensitivity analysis without participants in the lowest quartile of WMH volume (n = 132) yielded similar results for the relation between WMH volume and WMH CBF (β = −0.25, P = .02), NAWM CBF (β = 0.05, P = .69), and GM CBF (β = −0.02, P = .74). The sensitivity analysis, which included participants whose mean CBF values deviated >3 SDs from the mean, gave somewhat inflated results for the relation between WMH volume and WMH CBF (β = −0.34, P < .001), but similar results for NAWM CBF (β = 0.18, P = .09) and GM CBF (β = 0.18, P = .11). The sensitivity analysis in participants without a history of stroke or lacunar infarcts on the MR imaging (n = 150) attenuated results for the relation between WMH volume and WMH CBF (β = −0.178, P = .09) but yielded similar results for NAWM CBF (β = 0.20, P = .10) and GM CBF (β = 0.18, P = .16).

Scatterplots of relations between CBF and WMH volume, adjusted for total brain volume. Lines denote the regression line with 95% CI. Log WMH volume is logarithmically transformed.
Discussion
In a cohort of community-dwelling elderly individuals with hypertension, we found that CBF within WMHs is lower than CBF in NAWM and that WMH CBF decreases with increasing WMH volume. Contrary to our hypothesis, we did not find any indications that CBF in the NAWM or GM is also lower in patients with WMHs. These results suggest that WMHs in elderly individuals with hypertension are not related to a general decrease of cerebral perfusion. Higher GM ATT was also associated with higher WMH volume.
Because the surrounding NAWM does not seem to be affected, hypoperfusion within WMHs may be a direct consequence of local extensive tissue damage and obliteration of capillaries.5,6 Recent findings link WMHs to an accumulation of tiny infarctions,34 which could cause such tissue damage. However, WMHs primarily develop in regions with low perfusion, suggesting that low perfusion is involved in WMH conception.21,22 Conceivably, tiny infarctions interact with low-grade hypoperfusion, for example, originating when perfusion in a small area drops below a certain threshold. Such low-grade hypoperfusion could be too small to measure with current techniques and only becomes apparent after WMHs develop due to tissue damage.5,6,35 Microvascular alterations associated with aging and exacerbated by hypertension (luminal narrowing, vessel wall stiffening) may impede sufficient perfusion, especially distally in the WM where perfusion pressure is the lowest (On-line Fig 2).5,6 A similar mechanism could operate in diseases associated with cerebral perfusion deficits in which hypertension exacerbates WMH development, for example, heart failure and Alzheimer disease.14,20,36
GM perfusion does seem altered in patients with WMHs, in the sense that higher GM ATT was associated with higher WMH volume. Interpretation of this finding is not straightforward. ATT depends on the length of the blood flow trajectory from the cervical arteries to the cerebral capillaries and on the blood flow velocity along this trajectory.32 WMHs have been associated with reduced blood flow velocity in the large intracranial arteries, of which longer ATT could be a proxy.17⇓–19 This velocity reduction could be caused by increased resistance due to large-vessel atherosclerosis or small-vessel arteriolosclerosis, which are both associated with WMHs.6,37,38 The association between antihypertensive medication use and a higher WMH volume may be due to antihypertensive use being associated with more chronic and severe hypertension. Hypothetically antihypertensive drugs may lead to hypoperfusion, aggravating WMHs, but recent study findings make that possibility unlikely.39,40 Although our study was conducted in an elderly population with hypertension in the Netherlands, approximately 70% in this age range have hypertension,41 suggesting that our findings may apply to a large part of the general population. Findings of similar studies were in small or selected populations,7,10,11,15 and may be less readily translatable to the general elderly community.
Our finding that CBF values within WMHs are lower in participants with higher WMH volume is in line with previous findings.13 This lower CBF within WMH may be caused by the increase in tissue damage and disturbance of the microvascular blood supply to the center of WMHs as they increase in size.13 The absence of a relation between WMH volume and NAWM or GM CBF is somewhat surprising because results of other studies have hinted at such a relation.7,11,15 Our findings may be because CBF in GM and NAWM only diminishes with increasing WMH volume from a certain threshold of WMH volume.33 However, our sensitivity analysis in which this possibility was evaluated did not alter our findings. Another reason may lie in the differences between study populations. Studies linking WMHs to lower overall cerebral or GM perfusion were performed in mixed populations, including patients with mild cognitive impairment and Alzheimer disease.7,11,15 Mild cognitive impairment and Alzheimer disease are themselves associated with alterations in CBF.37 These perfusion alterations may be linked to WMH formation in these conditions by diminishing the blood supply to WM already susceptible to developing WMHs.14 Recent reports that a negative correlation between GM CBF and WMHs does exist in patients with Alzheimer disease but not in patients in a memory clinic without mild cognitive impairment or dementia support this explanation.15
This study has some limitations. The variance in CBF explained in our regression models was small, and the cross-sectional nature of our analysis prohibits inferences about any temporal or causal relation between CBF and WMHs. In addition, WMHs are associated with slight perfusion deficits in the NAWM and GM. The physiologic variability of CBF may be too great to reveal such small differences among participants. ATT may be less physiologically variable and thereby a more sensitive marker of these slight differences.27 Furthermore, because in arterial spin-labeling, longer ATT may cause lower CBF estimates, especially distally, the association between ATT and WMH volume may have affected our WMH CBF estimates.32 However, adjustment for ATT alone did not much affect the association between WMH CBF and WMH volume.
Another limitation is that it is uncertain whether the signal-to-noise ratio of WM perfusion by using arterial spin-labeling is sufficient to accurately estimate WM CBF within our short scanning time.42,43 However, although current arterial spin-labeling techniques may be unable to measure WM CBF with high accuracy on a voxel-level, on an ROI level, as used in this study, it has been shown that WM CBF can be measured within a scanning time of as little as 5 minutes.44⇓–46 Our measurements were precise enough to measure significant differences in CBF between the NAWM and WMH and between the whole WM and the NAWM only. Moreover, the reliability of our findings is supported by the ratios between the GM, WM, NAWM, and WMH CBF, which are similar to those reported in studies in which exogenous contrast agents were used.9,13,14 Finally, as a more general limitation, WMH volume may be linked to impaired autoregulation.47,48 Because in MR imaging, CBF is measured with the patient in the supine position, in patients with impaired cerebral autoregulation, regional CBF differences that occur while the patient is upright may be obscured.
Future studies using arterial spin-labeling to compare WMHs, NAWM, and GM CBF may benefit from new developments that increase signal-to-noise ratios and spatial resolution. In addition, they may be conducted in a more general population of elderly individuals with hypertension. Our population was a somewhat healthy selection because hypertension was under control in 26% and those with relatively severe medical conditions were excluded. In addition, it may be valuable to compare CBF estimates in patients with hypertension and WMHs with elderly individuals with asymptomatic WMHs without hypertension to discern potentially different etiologies and to chart the longitudinal relation between apparent perfusion deficits and WMH development.
Conclusions
Higher WMH volume in elderly patients with hypertension was associated with lower perfusion within WMHs, but not with lower perfusion in the surrounding NAWM or GM. These results suggest that WMH formation in these patients is associated with hypoperfusion locally in the WMHs, rejecting our hypothesis that WMHs in this population are the result of a general perfusion deficit. Our findings may contribute to the understanding of the pathophysiology of WMHs in advanced age and hypertension, potentially helping to develop better targeted prevention and treatment strategies for WMHs and their clinical correlates.
Acknowledgments
We are much indebted to C.E. Miedema and I.M. Steinman for planning and logistics and Dr F.E. de Leeuw for his critical review of the manuscript.
Footnotes
Disclosures: Hugo Vrenken—UNRELATED: Grants/Grants Pending: Novartis,* Teva,* Merck Serono,* Comments: research grants in multiple sclerosis brain imaging; Patents (planned, pending or issued): VU University Medical Center,* Comments: planned patent on brain atrophy measurement. Charles Majoie—UNRELATED: Payment for Lectures (including service on Speakers Bureaus): Stryker.* *Money paid to the institution.
None of the authors have any conflicts of interest.
This study was funded by the Dutch Ministry of Health, grant No. 50-50110-98-020; the Innovatiefonds Zorverzekeraars, grant No. 05-234; ZonMW grant No. 620000015; and the Internationale Stichting Alzheimer Onderzoek, grant No. 10157.
None of the funding sources had any involvement in the design of the study or in the collection, analysis, and interpretation of the data.
Indicates open access to non-subscribers at www.ajnr.org
References
- Received January 11, 2016.
- Accepted after revision March 31, 2016.
- © 2016 by American Journal of Neuroradiology


