
Abstract
BACKGROUND AND PURPOSE: The development of new MR imaging scanners with stronger gradients and improvement in coil technology, allied with emerging fast imaging techniques, has allowed a substantial reduction in MR imaging scan times. Our goal was to develop a 10-minute gadolinium-enhanced brain MR imaging protocol with accelerated sequences and to evaluate its diagnostic performance compared with the standard clinical protocol.
MATERIALS AND METHODS: Fifty-three patients referred for brain MR imaging with contrast were scanned with a 3T scanner. Each MR image consisted of 5 basic fast precontrast sequences plus standard and accelerated versions of the same postcontrast T1WI sequences. Two neuroradiologists assessed the image quality and the final diagnosis for each set of postcontrast sequences and compared their performances.
RESULTS: The acquisition time of the combined accelerated pre- and postcontrast sequences was 10 minutes and 15 seconds; and of the fast postcontrast sequences, 3 minutes and 36 seconds, 46% of the standard sequences. The 10-minute postcontrast axial T1WI had fewer image artifacts (P < .001) and better overall diagnostic quality (P < .001). Although the 10-minute MPRAGE sequence showed a tendency to have more artifacts than the standard sequence (P = .08), the overall diagnostic quality was similar (P = .66). Moreover, there was no statistically significant difference in the diagnostic performance between the protocols. The sensitivity, specificity, and accuracy values for the 10-minute protocol were 100.0%, 88.9%, and 98.1%.
CONCLUSIONS: The 10-minute brain MR imaging protocol with contrast is comparable in diagnostic performance with the standard protocol in an inpatient motion-prone population, with the additional benefits of reducing acquisition times and image artifacts.
ABBREVIATIONS:
- GRAPPA
- generalized autocalibrating partially parallel acquisition
- GRE
- gradient-echo
- SE
- spin-echo
The prolonged acquisition time of MR imaging is uncomfortable for patients, introduces the potential for motion-related artifacts (especially in critically ill patients), limits clinical availability, and increases cost. Consequently, in the past decade, there has been a concerted effort to develop fast and ultrafast MR imaging protocols.1⇓⇓⇓⇓⇓–7
For many years, continual development of new scanners with stronger gradients and the improvement of coil technology,8⇓–10 allied with a number of emerging fast imaging techniques, has allowed substantial reduction in MR imaging scan times.1,11⇓–13 More recently, the development of parallel imaging, a robust method for accelerating MR imaging data acquisitions based on obtaining simultaneous information from arrays of coils, allowing decreased filling of k-space lines, has been the preferred method for decreasing acquisition times.14⇓–16
This study is in accord with recent effort within the neuroradiology research community to accelerate the clinical MR imaging studies and expands on a 5-minute noncontrast brain MR imaging protocol previously validated by our group.11 We previously demonstrated similar image quality and diagnostic accuracy of a 5-minute brain MR imaging protocol compared with the conventional protocol in a motion-prone clinical population. The aim of this study was to develop a 10-minute gadolinium-enhanced brain MR imaging protocol with accelerated sequences and to evaluate its diagnostic performance compared with a standard clinical protocol in a similar clinical population.
Materials and Methods
Study Design
A prospective comparative study was performed in 69 consecutive neurologic/neurosurgical patients in the intensive care unit who underwent brain MR imaging with contrast, from February through June 2016. None of the patients were sedated. Sixteen patients were excluded because of incomplete datasets due to technical or compliance issues. The remaining 53 patients (25 men; mean age, 53.4 ± 16.1 years) were included. Demographic information, including age, sex, and clinical indication for undergoing MR imaging, is described in Table 1. This study was Health Insurance Portability and Accountability Act–compliant and was approved by the Massachusetts General Hospital institutional review board. Because all brain MR imaging studies included were acquired for clinical purposes and no significant time was added to the study, informed consent was waived by the institutional review board.
Clinical characteristics of patients
MR Imaging Protocol
All studies included 5 basic fast sequences that have been previously validated (5-minute brain)11 and standard and fast versions of 2 common clinically used postcontrast sequences: axial 5-mm T1-weighted and 3D MPRAGE. Because the acquisition time of the precontrast sequences in addition to the fast postcontrast sequences was close to 10 minutes, we decided to call this novel protocol the “10-minute brain MR imaging protocol.” All MR imaging studies were performed with a clinical 3T MR imaging scanner (Magnetom Skyra; Siemens, Erlangen, Germany) with maximum gradient strength of 45 mT/m, a slew rate of 200 T/m/s, and a 32-channel multiarray receiver head coil. All scans began with 4 sequences from the 5-minute brain protocol (fast sagittal T1-weighted, axial FLAIR, axial T2*-weighted, and axial diffusion-weighted images),11 followed by a fast gradient-echo (GRE) T1-weighted sequence. Following the intravenous injection of gadolinium, an axial T2-weighted sequence, also developed for the 5-minute protocol, was performed to allow a minimum time required for the contrast to properly enhance brain lesions.17 The standard axial TSE T1-weighted, 10-minute protocol fast axial GRE T1-weighted, and standard and accelerated MPRAGE sequences were then acquired in a randomized order. The fast axial GRE T1 and fast MPRAGE sequences were shortened with generalized autocalibrating partially parallel acquisition (GRAPPA).18 In addition, manual intersequence adjustments were eliminated with the automatic section positioning technique. This technique was developed by van der Kouwe et al,19 with a probabilistic method to align a 3D localizer to a statistical atlas, which contains the probability of a given tissue type occurring at a given location based on the MR imaging intensity values.
A detailed summary of sequence parameters is found in the On-line Table. The elapsed times before the beginning of each sequence were measured and compared between both protocols (standard and 10-minute). Elapsed time was defined as a time from the start of the MR imaging study (localizer scan) to the start of each sequence in each protocol.11
Qualitative Image Evaluation
The DICOM datasets were transferred to a predetermined workstation and anonymized before randomization. Blinded to patient information and protocol type, 2 neuroradiologists (O.R., S.Y.H.) with 16 and 6 years of experience independently reviewed all DICOM datasets with a DICOM viewer (OsiriX Imaging Software; http://www.osirix-viewer.com). To obtain optimal visualization, we allowed adjustments of window widths and levels. A research team member not involved in the data assessment was responsible for maintaining anonymization and randomization keys.
Individual Analysis
Regarding the individual analysis, each patient had 2 DICOM datasets: 1 containing the 10-minute postcontrast protocol and 1 containing the standard protocol images (both shared the same 5 basic sequences from the 5-minute brain protocol already mentioned and a standard precontrast 5-mm axial T1-weighted sequence). Both datasets were distributed in a randomized fashion throughout the reading sessions so that no patient had his or her standard and 10-minute protocols read at the same session.
Individual datasets for each protocol were assessed for diagnostic performance, and accuracy was calculated with the standard protocol as the criterion standard. The readers were asked to determine the number of lesions, the degree of enhancement, and the presumed diagnosis (without knowledge of clinical information) after they analyzed the entire protocol. Only pathological enhancing lesions were included. The degree of enhancement was determined on the basis of a predefined 4-point scale: 0 (none), not visualized on 1 (or both) of the postcontrast sequences; 1 (subtle), faintly visualized on 3D sequences but better visualized on axial images (or vice versa); 2 (adequate), moderate degree of enhancement, equally seen in both 3D and axial sequences; and 3 (excellent), strong and sharply demarcated enhancement on both sequences.20 Disagreements between readers were resolved by consensus review for presumed diagnoses and adjudicated by a third reader (P.S.) with 20 years of experience for the remaining variables.
Head-to-Head Analysis
A separate review session was performed to compare the presence of image artifacts, visualization of normal anatomic structures, and overall diagnostic quality. Each case had side-by-side comparison of the standard and 10-minute versions of the T1-weighted axial postcontrast sequences and side-by-side comparison of the standard and 10-minute versions of the MPRAGE postcontrast sequences. Both datasets (10-minute and standard) were presented simultaneously in a random left-right order and in a blinded fashion to the observers. The observers documented which sequence was superior (left or right) or whether they were equivalent. A different member of the research team, who was not blinded to the assignments, used these scores and rearranged them following a previously described scoring method.21 A third reader (P.S.) resolved any disagreements. Image quality was defined as image degradation by artifacts and was assessed by using a 5-point scale: −2, artifacts are seen only on the left sequence; −1, artifacts are worse on the left sequence; 0, comparable artifacts are seen in both protocols; +1, artifacts are worse on the right sequence; +2, artifacts are seen only on the right sequence. The overall diagnostic quality was defined as the ability to identify findings despite the presence of artifacts and was assessed by a similar comparative 5-point scale: −2, left sequences are nondiagnostic; −1, right sequences are superior to the left sequences, but both are diagnostic; 0, both protocols are diagnostic and equal in terms of overall quality; +1, left sequences are superior to the 10-minute sequences, but both are diagnostic; +2, right sequences are nondiagnostic.21
Statistical Analysis
The descriptive data were presented by means and SDs or medians and ranges for parametric and nonparametric variables, respectively. Fisher exact and Wilcoxon signed rank tests were used to analyze the results of elapsed time, head-to-head, and individual analyses, considering categoric and continuous variables, respectively, on the basis of the data from the described scores after the adjudication. The comparison of individual analyses regarding the diagnostic performance was evaluated with the McNemar test.
Proportions of agreement between readers regarding the individual analysis were reported with the Cohen κ coefficient. This coefficient was interpreted as follows: 0.00–0.20, slight agreement; 0.21–0.40, fair agreement; 0.41–0.60, moderate agreement; 0.61–0.80, substantial agreement; and >0.80, almost perfect agreement.22
P values < .05 were considered statistically significant. All statistical calculations were performed with STATA, Version 14.0 (StataCorp, College Station, Texas).
Results
Elapsed-Time Comparison
There was no statistically significant difference between the elapsed time of the standard and 10-minute sequences (P > .05). These results reinforce the order of the scanning being truly randomized, and they did not influence image quality.
Individual Analysis
The observers decided by consensus a presumed diagnosis based on the MR imaging features (Table 2). These diagnoses were concordant between the 10-minute and standard protocol groups in 52 cases (98.1%). The only case in which they disagreed was diagnosed as a vascular pathology in the standard protocol sequences, but it was considered normal vascular enhancement in the 10-minute protocol. Retrospectively, this lesion was present in the 10-minute protocol sequences and was compatible with a small capillary telangiectasia. The sensitivity, specificity, and accuracy of the 10-minute protocol were 100.0% (95% CI, 92%–100%), 88.9% (95% CI, 51.8%–99.7%), and 98.1% (95% CI, 89.9%–99.9%), respectively.
Presumed diagnosis based on imaging findings without clinical information
Regarding the enhancing lesions, the median number and statistical distribution of the lesions for each group were similar. The observers identified the same number of lesions in both protocols (162 lesions in 45 patients). From these 45 patients in whom the presence of at least 1 enhancing lesion was described, 18 (40%) underwent the standard protocol first, and 27 (60%), the 10-minute protocol first. Just 1 lesion was more conspicuous in the standard protocol but was also identified on the 10-minute protocol sequences. In this particular case, the standard postcontrast sequences were acquired after the 10-minute postcontrast sequences, and the increased leakage of gadolinium within the lesion may explain this difference. The κ for the interobserver agreement was 0.96 for the standard sequences and 1.0 for the 10-minute sequences. The observers classified slightly more lesions with a higher degree of enhancement in the 10-minute sequences; 97 lesions were classified as degree 3 in the standard protocol, while 111 lesions were classified as degree 3 in the 10-minute protocol (P < .001). The κ for the interobserver agreement for this variable was 0.71 for the standard sequences and 0.70 for the 10-minute sequences.
Head-to-Head Analysis
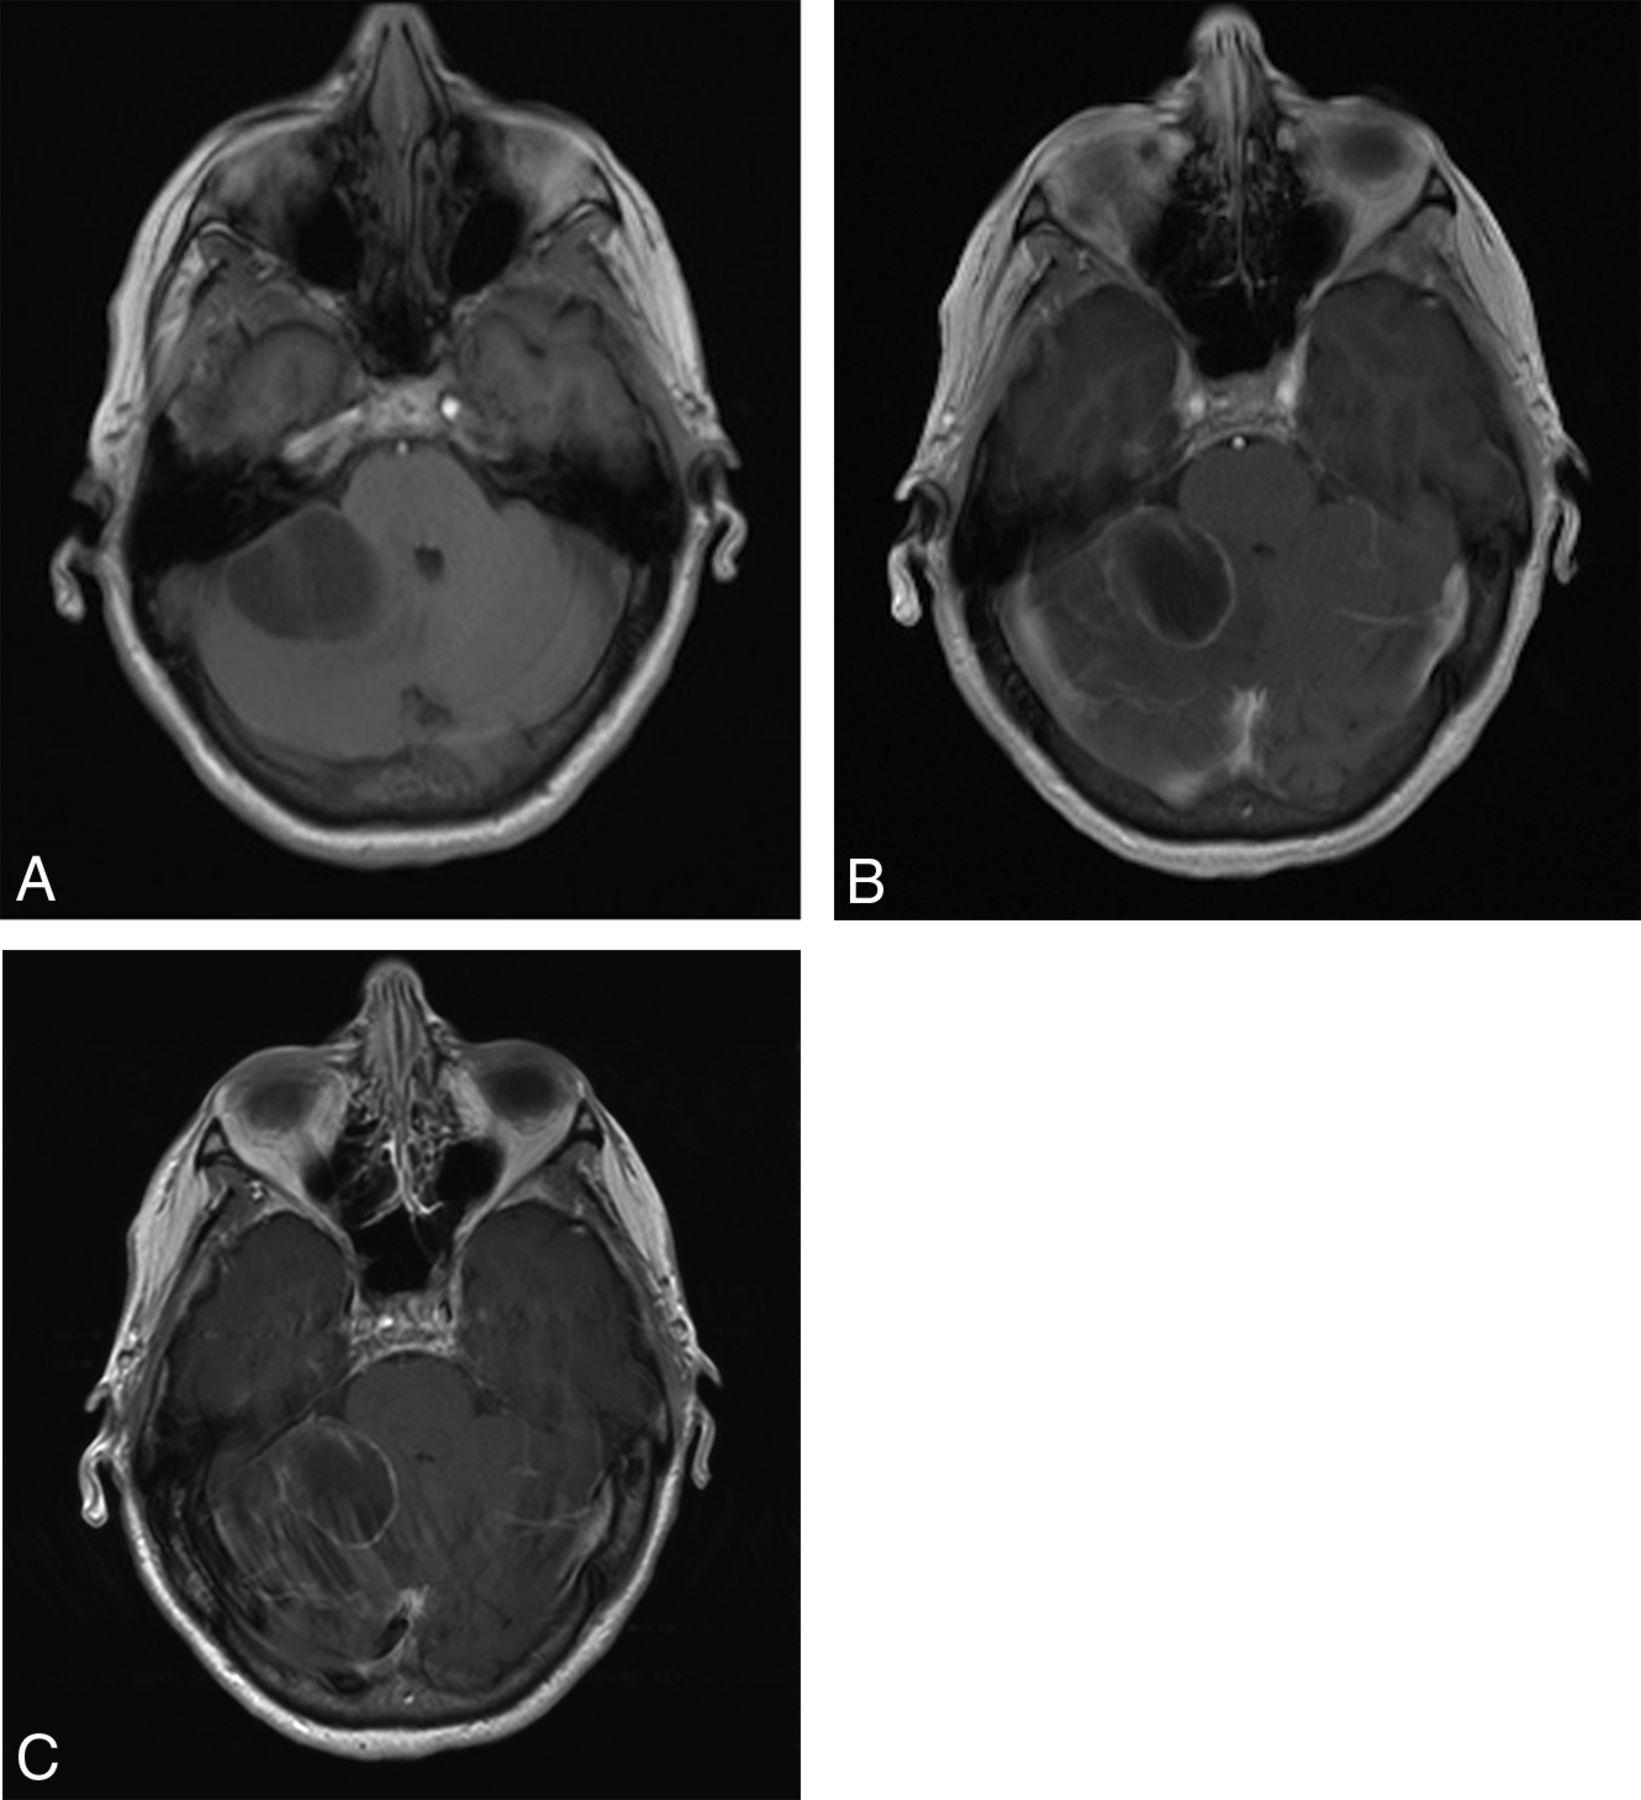
The 10-minute axial GRE T1-weighted postcontrast sequence was considered superior (in terms of the presence of artifacts and overall diagnostic quality) compared with the standard postcontrast spin-echo (SE) T1-weighted sequence. For most cases (51/53) (96.2%), the 10-minute GRE T1-weighted sequence had fewer artifacts compared with the standard SE T1-weighted sequence (P < .001) (Table 3 and Fig 1).
Head-to-head evaluation

Postcontrast T1-weighted axial images obtained from a 66-year-old woman with a history of non-small cell lung cancer showing a metastatic cystic lesion with peripheral enhancement in the right cerebellar hemisphere. Precontrast axial GRE T1-weighted (A), postcontrast axial GRE T1-weighted (B), and postcontrast axial SE T1-weighted (C) images. The 10-minute axial GRE T1WI shows fewer artifacts compared with the standard axial TSE T1WI. The conspicuity of the lesion is comparable on both postcontrast sequences.
Most of the MPRAGE postcontrast evaluations reported that the sequences were equivalent. However, there was a trend among the observers to find more artifacts on the 10-minute sequence, though the difference was not statistically significant (P = .08). The presence of these artifacts did not influence the overall diagnostic quality (P = .66) (Fig 2).

Sagittal postcontrast MPRAGE images from a 53-year-old woman with history of breast cancer showing postoperative findings after resection of a brain metastasis. Ten-minute sagittal 3D MPRAGE (A) and standard sagittal 3D MPRAGE (B) images both show comparable diagnostic quality.
Discussion
Our results suggest that the proposed 10-minute contrast-enhanced protocol may improve imaging of motion-prone patients in an inpatient setting. We demonstrated that an optimized 10-minute protocol with contrast (sagittal T1-weighted, axial T2-weighted, axial FLAIR, axial T2*WI, axial DWI, axial T1-weighted pre- and postcontrast, and 3D-MPRAGE postcontrast) has similar diagnostic accuracy and diagnostic image quality compared with a conventional postcontrast MR imaging protocol.
In fact, the 10-minute GRE T1-weighted axial postcontrast sequence performed better in terms of artifacts and diagnostic image quality compared with the standard SE T1-weighted postcontrast sequence. One reason for this difference in performance could be due to intrinsic differences in these pulse sequences, resulting in faster acquisition times and less motion artifacts with GRE sequences. However, even the initial studies >2 decades ago reported that SE sequences showed more contrast compared with GRE.23 The improvements in scanner hardware and the higher field strengths of the 3T scanners might have helped to reduce this difference in contrast. Another contribution of our findings is that the TE of the GRE sequence is almost 3 times shorter than the TE of the SE sequence, which could also reduce pulsation artifacts.24
The 10-minute-protocol MPRAGE sequence had similar diagnostic performance compared with the standard sequence, though it had a non-statistically significant trend to present more artifacts. The likely cause is the reduction in the signal-to-noise ratio, typical of parallel imaging, which is more evident in 3D sequences.25,26 Nevertheless, having no influence on the diagnostic performance and the decrease in the acquisition time may justify the use of this sequence.
The shortened acquisition time is one of the most significant benefits of the 10-minute protocol, especially in a group of unstable and motion-prone patients as seen in our cohort. The scan time of our 10-minute protocol was 10 minutes and 15 seconds compared with at least 19 minutes and 3 seconds for a typical conventional protocol (without using acceleration techniques, even for the precontrast sequences), which represents an acquisition time reduction of almost 50%. The acquisition time of the combined postcontrast sequences (GRE T1-weighted axial and 3D MPRAGE) in the 10-minute protocol was 3 minutes and 36 seconds compared with 7 minutes and 49 seconds for the standard postcontrast sequences. This reduction was possible without compromising diagnostic performance and maintaining an accuracy of almost 100%.
We decided to maintain both sequences, 2D T1-weighted axial and 3D MPRAGE, to increase our sensitivity for the detection of enhancing lesions and to be in agreement with the standard protocol in our department, which includes 2 different T1-weighted sequences after contrast administration. Considering the clinical importance of the postcontrast sequences in this population, we believe that maintaining both sequences is useful in case of patient movement during the MR imaging acquisition. While the 3D MPRAGE is known to have higher spatial resolution compared with 2D sequences, it may have decreased the conspicuity of enhancement for small lesions in some cases, supporting the complementary use of both sequences.27,28
Parallel imaging relies on a more efficient scan technique, which uses a higher percentage of the scan time for data acquisition (instead of image reconstruction). More specifically, multiple independent receiver coils are used, and the spatial information provided by these independent coils is exploited to encode multiple MR imaging echoes simultaneously.15,18 Although parallel imaging has many advantages, it has an SNR penalty. Our protocol is optimized for 3T MR imaging with a 32-channel head coil to compensate and mitigate these constraints16 and should be adapted if 1.5T scanners or head coils with fewer channels are used.
In accordance with our results, previous studies demonstrated the benefits of using parallel imaging sequences in ischemic stroke and pediatric central nervous system disorders,3,29,30 with consistently reduced acquisition times and comparable image quality. In the study of Nael et al,29 postcontrast sequences, MR angiography and dynamic susceptibility contrast perfusion, were tested in an acute stroke setting. This study used echo-planar imaging as an acceleration factor for most sequences and yet reached a similar accuracy between the fast and conventional protocols. Our previous study demonstrated the feasibility of fast sequences without contrast in an inpatient setting, with comparable diagnostic accuracy with standard sequences for multiple CNS pathologies in an adult population.11 Our current results with postcontrast sequences reinforced and expanded on those findings.
Our study has several limitations. First, it included a relatively small sample size. Although we enrolled only 53 patients, we were able to compare the enhancement pattern of >160 lesions. Second, we decided to use our standard protocol as the criterion standard, which may overestimate the accuracy of the protocols. Third, the time lag between the reading sections was imprecise, increasing the risk of reader-order bias. To address this issue, we performed assessments separated by at least 1 week from each other in a random order.31 Fourth, our analysis was predominantly qualitative and subjective rather than with quantitative and automated measures. Nevertheless, our κ coefficients for interobserver agreement for enhancement characteristics and the number of lesions were in the range of substantial-to-near-complete agreement, and the diagnostic concordant rate between the standard and 10-minute protocols was very high (98.1%).
Conclusions
The 10-minute brain MR imaging protocol with contrast is at least comparable with the standard protocol in an inpatient motion-prone clinical setting, with the substantial benefit of reducing the acquisition time (by nearly 50%). Further use of this protocol in larger and different patient populations is warranted to determine the extent of its clinical utility.
Footnotes
Disclosures: Joana Fagundes—RELATED: Consulting Fee or Honorarium: Siemens Medical Solutions USA, Comments: scholarship to conduct the research. Maria Gabriela Longo—RELATED: Consulting Fee or Honorarium: Siemens Medical Solution USA, Comments: scholarship to conduct the research. Keith Heberlein—UNRELATED: Employment: Siemens Medical Solution USA, Comments: I am a full-time employee. Ramon G. Gonzalez—UNRELATED: Expert Testimony: For the US Attorney in Florida.
J. Fagundes, M.G. Longo, and K. Heberlein received financial support from Siemens Medical Solutions.
This work was conducted with support from Harvard Catalyst and The Harvard Clinical and Translational Science Center (National Center for Research Resources and the National Center for Advancing Translational Sciences, National Institutes of Health Award UL1 TR001102) and financial contributions from Harvard University and its affiliated academic health care centers.
The content is solely the responsibility of the authors and does not necessarily represent the official views of Harvard Catalyst, Harvard University and its affiliated academic health care centers, or the National Institutes of Health.
References
- Received March 6, 2017.
- Accepted after revision May 12, 2017.
- © 2017 by American Journal of Neuroradiology


