
Abstract
BACKGROUND AND PURPOSE: The clinical implications of gadolinium deposition in the CNS are not fully understood, and it is still not known whether gadolinium tends to be retained more in the brain compared with the spinal cord. In this study, we assessed the effects of linear gadolinium-based contrast agents on the T1 signal intensity of 3 cerebral areas (dentate nucleus, globus pallidus, and the less studied substantia nigra) and the cervical spinal cord in a population of patients with MS.
MATERIALS AND METHODS: A single-center population of 100 patients with MS was analyzed. Patients underwent 2–16 contrast-enhanced MRIs. Fifty patients received ≤5 linear gadolinium injections, and 50 patients had ≥6 injections: Fifty-two patients had both Gd-DTPA and gadobenate dimeglumine injections, and 48 patients received only gadobenate dimeglumine. A quantitative analysis of signal intensity changes was independently performed by 2 readers on the first and last MR imaging scan. The globus pallidus-to-thalamus, substantia nigra-to-midbrain, dentate nucleus-to-middle cerebellar peduncle, and the cervical spinal cord-to-pons signal intensity ratios were calculated.
RESULTS: An increase of globus pallidus-to-thalamus (mean, +0.0251 ± 0.0432; P < .001), dentate nucleus-to-middle cerebellar peduncle (mean, +0.0266 ± 0.0841; P = .002), and substantia nigra-to-midbrain (mean, +0.0262 ± 0.0673; P < .001) signal intensity ratios after multiple administrations of linear gadolinium-based contrast agents was observed. These changes were significantly higher in patients who received ≥6 injections (P < .001) and positively correlated with the number of injections and the accumulated dose of contrast. No significant changes were detected in the spinal cord (mean, +0.0008 ± 0.0089; P = .400).
CONCLUSIONS: Patients with MS receiving ≥6 linear gadolinium-based contrast agent injections showed a significant increase in the signal intensity of the globus pallidus, dentate nucleus, and substantia nigra; no detectable changes were observed in the cervical spinal cord.
ABBREVIATIONS:
- CP
- middle cerebellar peduncle
- CS
- cervical spinal cord
- DN
- dentate nucleus
- EDSS
- Expanded Disability Status Scale
- GBCA
- gadolinium-based contrast agent
- Gd-BOPTA
- gadobenate dimeglumine
- GP
- globus pallidus
- L-GBCA
- linear gadolinium-based contrast agent
- SI
- signal intensity
- SN
- substantia nigra
In the past 4 years, a number of publications have demonstrated a dose-dependent relationship between the administration of gadolinium-based contrast agents (GBCAs) and high signal intensity (SI) on unenhanced T1-weighted images in the dentate nucleus (DN) and globus pallidus (GP).1⇓⇓–4 Initially, 2 research groups proposed that these hyperintensities were a consequence of cerebral irradiation5 or the development of the secondary-progressive subtype of MS,6 but GBCA administration was not considered in either investigation.5,6 Further postmortem studies verified the presence of retained gadolinium not only in the DN and GP but also in other regions such as CSF, bone, and skin.7⇓⇓–10 However, the clinical implications of gadolinium retention and the possibility of gadolinium deposition in other human body areas remain unclear. Additionally, the mechanisms responsible for the gadolinium deposition in the CNS are not fully understood, and it is still not known whether gadolinium tends to be retained more in the brain compared with the spinal cord.11
In this retrospective study including a large cohort of patients with MS with normal renal function who underwent multiple contrast-enhanced MRIs with linear gadolinium-based contrast agent (L-GBCA), we analyzed SI changes not only in the DN and GP, which have been extensively studied in previous investigations, but also in the substantia nigra (SN) and cervical spinal cord (CS), 2 CNS structures in which potential gadolinium deposits in patients with MS have not been investigated. Clinical factors have been integrated in the analysis as well.
Materials and Methods
Study Population
This retrospective Health Insurance Portability and Accountability Act–compliant study was approved by our institutional review board with a waiver of informed consent.
The clinical charts of patients with MS treated between October 2005 and April 2018 were reviewed; collected information included age, sex, race, symptoms of MS, Expanded Disability Status Scale (EDSS) assessed by a qualified MS neurologist, comorbidities, medications and disease-modifying therapy, the interval between each contrast-enhanced MR imaging, L-GBCA type, and the number of injections and the dose (milliliters) administered between the first and last scan. Because the ROIs were placed on precontrast T1-weighted images, the injections performed during the last MR imaging session were not counted for the analysis.
Inclusion criteria were the following: 1) a relapsing-remitting MS diagnosis according to the McDonald criteria; 2) first and last contrast-enhanced MR imaging scans of the brain and the cervical spine performed at our institution; and 3) injections of exclusively L-GBCA.
Exclusion criteria included a history of the following: 1) brain irradiation/chemotherapy; 2) brain hemorrhage/stroke; 3) intracranial infection, edema, tumor, or other diseases affecting cerebellum, pons, midbrain, basal ganglia, thalamus, or CS; 4) abnormal renal function (ie, an estimated glomerular filtration rate of <60 mL/min/1.73 m2); 5) abnormal hepatic function (ie, a total bilirubin level of >2 mg/dL); 6) conditions associated with iron deposition in the brain and/or T1-weighted hyperintensity in the deep gray nuclei; and 7) the presence of lesions in the C1–C5 level of the CS on the sagittal midline plane.
After the analysis of 949 medical charts, clinical and radiologic data of 100 patients with relapsing-remitting MS (67 women and 33 men; mean age, 41.6 ± 11.8 years) conforming to eligibility criteria were collected. The population was divided in 2 groups (Fig 1): The population of group A had ≤5 L-GBCA injections; group B had ≥6. In each group, we defined 2 subgroups: subgroups A1 and B1 included patients who had both Gd-DTPA and gadobenate dimeglumine (Gd-BOPTA) injections; patients in subgroups A2 and B2 received only Gd-BOPTA. Demographic and clinical data for each group and subgroup are reported in Table 1
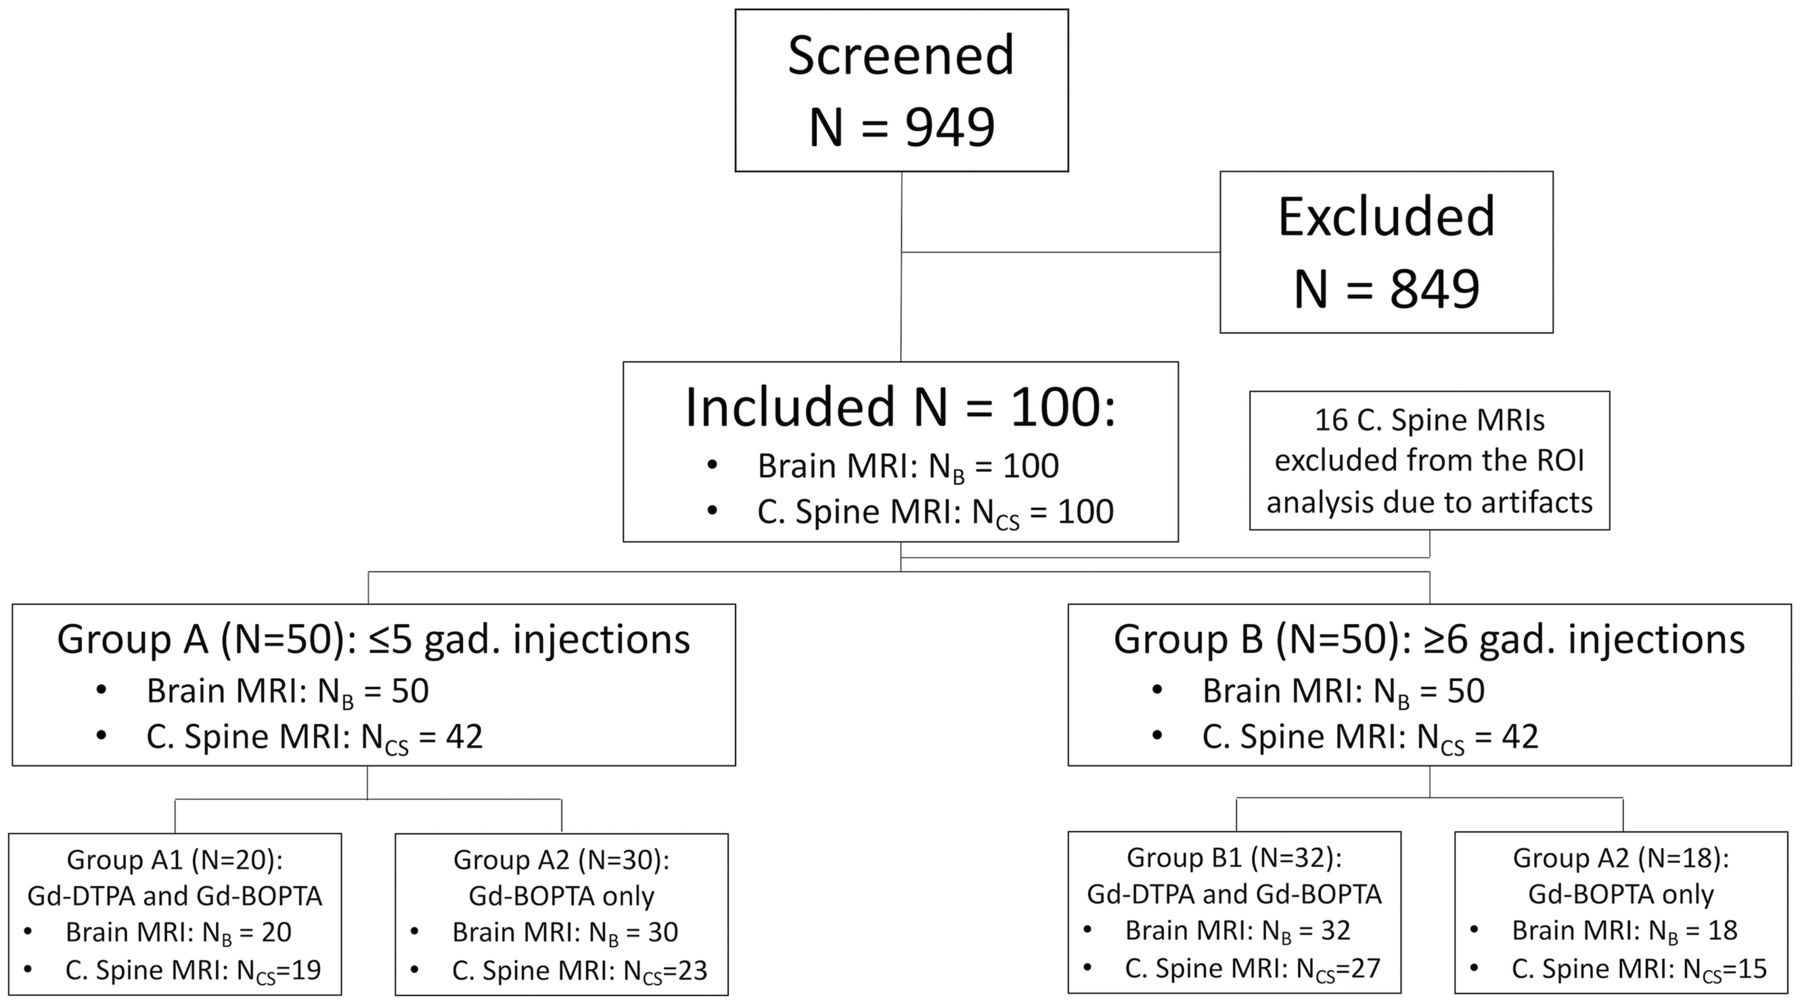
Flow diagram of patients screened and included in the study. N indicates number of patients.
Demographic and clinical data in the study population
MR Imaging Protocol
MR images were obtained on the same 3T scanner (Signa HD; GE Healthcare, Milwaukee, Wisconsin). Unenhanced T1-weighted turbo spin-echo sequences of the brain and cervical spine were performed (TR = 500–650 ms; TE = 9–11 ms; section thickness = 3 mm; matrix size = 192 × 256). Standard dosing of 0.1 mmol/kg of body weight was targeted for GBCA intravenous administration.
Imaging Data Analysis
The first and last brain and cervical spine MR imaging scans were analyzed on ImageJ software (National Institutes of Health, Bethesda, Maryland). ROIs were manually drawn to measure the SI on unenhanced T1-weighted images. After coregistration of the first and last MR imaging scans, the ROI size and coordinates of the first scan were correspondingly transposed on the last one, to minimize the possibility of detecting SI changes related to the placement of ROIs in different areas. Additionally, all the measurements were independently performed by 2 readers, twice, with a 4-month interval between the 2 analyses: therefore, each ROI was measured 4 times, and the concordance between each measure was computed. Readers were blinded to the clinical data.
The ROIs in the brain included the GP and thalami (same axial slice), SN and midbrain (same axial slice), DN and middle cerebellar peduncles (CP) (same axial slice). When the detection of the GP, SN, and DN was inconclusive, the equivalent slice on T2WI was used for the correct ROI placement. The average SI of the bilateral structures (GP, thalamus, SN, DN, and CP) was computed; the obtained values were used in the successive calculations of GP-to-thalamus, SN-to-midbrain, and DN-to-CP SI ratios.
Regarding the spinal cord, rectangular ROIs covering the whole midline section of the spinal cord were placed at the C1, C2, C3, C4, and C5 levels on the unenhanced T1-weighted sagittal midline plane. The C6 and C7 levels were excluded from the analysis due to frequent artifacts in the lower CS. On the same slice, another ROI was placed on the pons. The CS-to-pons SI ratio was calculated by dividing the average signal of the 5 ROIs located in the CS by the signal of the pons.
Statistical Analysis
Analyses were conducted using the Statistical Package for the Social Sciences, Version 24.0 (IBM, Armonk, New York). Statistical significance was defined as P ≤ .05, after adjustments according to the Benjamini-Hochberg procedure.
The Lin concordance was used to test the interobserver agreement between the 2 readers' measurements.12
A 1-sample t test was performed to assess whether the differences of EDSS, GP-to-thalamus, SN-to-midbrain, DN-to-CP, and CS-to-pons SI ratios between the first and last scan as well as the differences of all SI ratios between the first and second quantitative analyses were significantly different from zero.
Independent-samples t tests were used to evaluate whether differences of EDSS, GP-to-thalamus, SN-to-midbrain, DN-to-CP, and CS-to-pons SI ratios between the groups and subgroups were statistically significant. SI ratios of the first and second quantitative analyses were tested as well.
The following clinical factors were tested with multiple linear regression analyses using the changes of SI ratios between the first and last MR imaging scans as the predictive variable: age, sex, race, EDSS, disease-modifying therapy, mean interval between each contrast-enhanced MR imaging, type of L-GBCA, and the number of injections. Finally, correlation analyses were performed to test which variables had a significant influence on the SI differences.
Results
Clinical Analysis
The mean and median EDSS scores were 1.7 and 1.0 at the first MR imaging examination, and 2.0 and 1.0 at the last (mean age, 46.4 ± 11.8 years), respectively. Thirteen patients had worsening of EDSS scores at the last contrast-enhanced MR imaging compared with the first one, while EDSS scores remained stable in 87 patients. The difference of EDSS scores between the first and last MR imaging was not significant in patients receiving only Gd-BOPTA compared with patients who had been injected with both Gd-BOPTA and Gd-DTPA (P = .983). The interval between the first and last contrast-enhanced MR imaging, the number of injections, the accumulated dose of L-GBCA, and the increase in SI in the DN showed a significant positive correlation with EDSS worsening (Spearman ρ = 0.276, P = .005; Spearman ρ = 0.258, P = .010; Spearman ρ = 0.299, P = .003; and Spearman ρ = 0.196, P = .050, respectively). The type of L-GBCA was not significantly associated with the increased EDSS score (Spearman ρ = 0.062, P = .540). At the time of the first MR imaging, 85 patients were being treated with disease-modifying therapy. In most cases, glatiramer acetate and natalizumab were prescribed (27 and 25 cases, respectively); other disease-modifying therapies in our cohort included teriflunomide, alemtuzumab, fingolimod, interferon β-1a, interferon β-1b, and dimethyl fumarate. In 48 patients, the disease-modifying therapy was not switched during the interval between the first and last MR imaging scans.
Patients underwent 2–16 contrast-enhanced MRIs (mean, 6.9; median, 6.5). The mean and median follow-ups between the first and last MR imaging examinations were at 58 and 56 months, respectively. The mean and median intervals between each contrast-enhanced MR imaging scan were 10.5 and 9.5 months, respectively.
The total number of injections was 588 (Gd-BOPTA in 488 cases, Gd-DTPA in 100 cases). The average number of injections per patient was 6 (median, 5.5; range, 1–15), with means of 72.29 mL of Gd-BOPTA and 14.64 mL of Gd-DTPA injected from the first to the last scan.
Radiologic Analysis: Brain
Interobserver agreement was substantial for all structures evaluated (Lin concordance correlation coefficient, 0.974; 95% CI, 0.972–0.976).
The GP-to-thalamus, SN-to-midbrain, and DN-to-CP SI ratio differences between the first and last MR imaging scans in our population were significantly higher than 0 (P < .001, P < .001, and P = .002, respectively), with mean values of +0.0251 ± 0.0432 (95% CI, 0.0165–0.0336), +0.0262 ± 0.0673 (95% CI, 0.0128–0.0395), and +0.0266 ± 0.0841 (95% CI, 0.0099–0.0432), respectively (Fig 2 and On-line Figs 1–3).

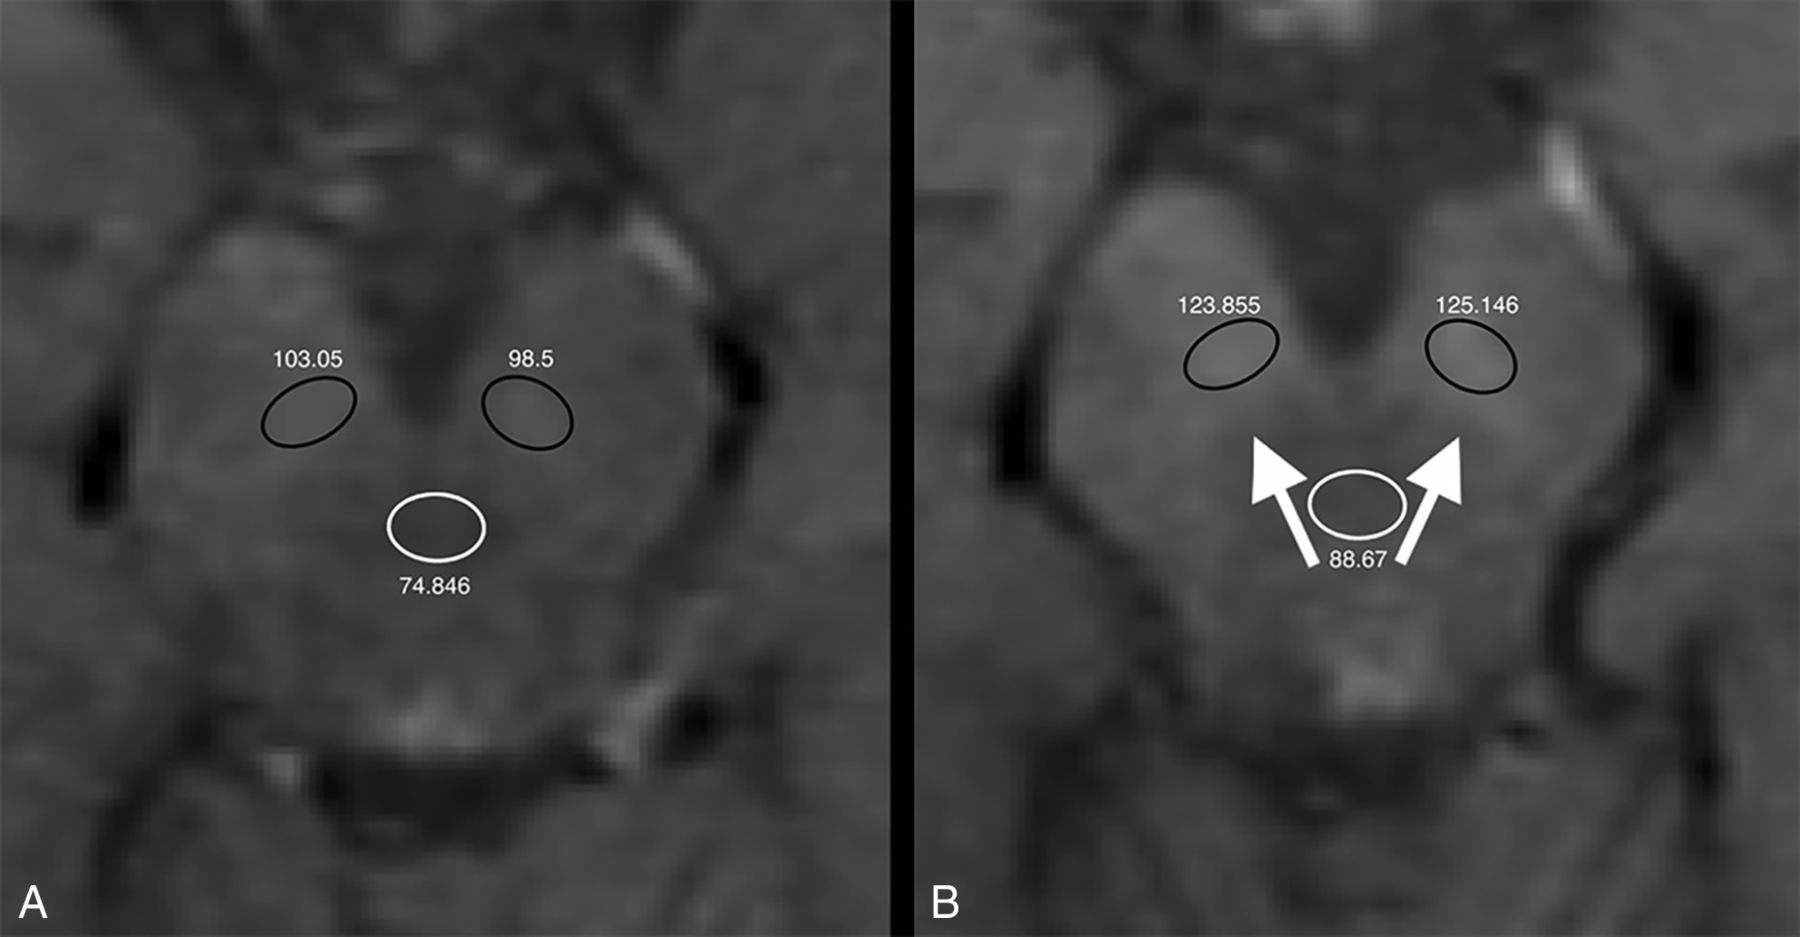
Unenhanced axial T1-weighted images at the first (A) and seventh (B) contrast-enhanced MR imaging of a 26-year-old man with relapsing-remitting multiple sclerosis treated with glatiramer acetate. Absolute numbers of signal intensity measurements are reported for each ROI (black circles indicate the substantia nigra ROIs; white circles, the midbrain ROIs). Increased signal intensity in the substantia nigra at the last MR imaging scan is shown (white arrows). TR = 500 ms; TE = 9 ms; section thickness = 3 mm; matrix =192 × 256.
In patients who had ≥6 L-GBCA injections, the difference in SI ratios between the first and last MR imaging scans was statistically significant for the GP (P < .001), SN (P < .001), and DN (P = .001), but it was not significant in patients with ≤5 injections (P = .059, P = .572, and P = .821, respectively) (Fig 3). These differences were also significantly higher in patients who had ≥6 injections compared with patients with ≤5 injections (P < .001, P < .001, and P < .001, respectively).
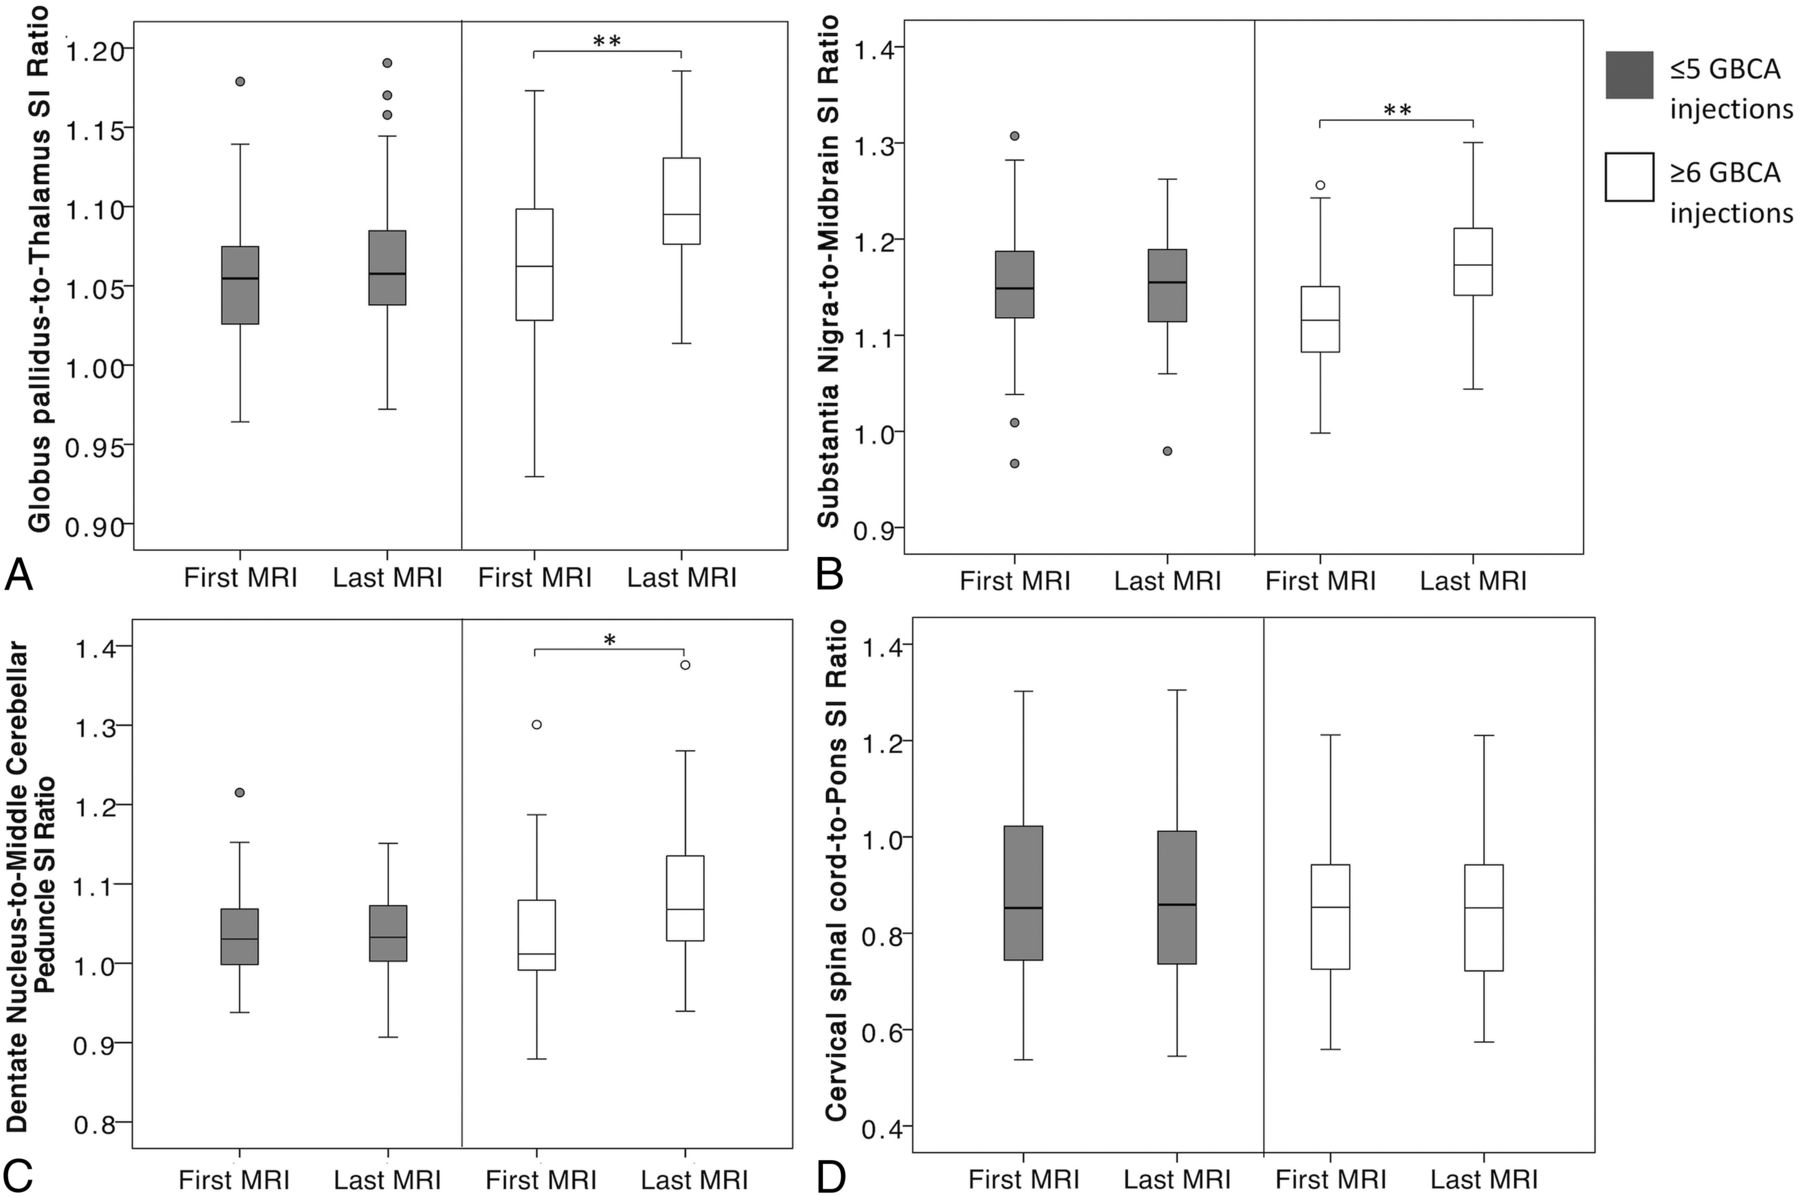
Boxplots representing the distribution of globus pallidus-to-thalamus (A), substantia nigra-to-midbrain (B), dentate nucleus–to-middle cerebellar peduncle (C), and cervical spinal cord-to-pons (D) SI ratios at the first and last MR imaging examinations, stratified by patients who received ≤5 (gray boxes on the left side of each plot) and ≥6 linear GBCA injections (white boxes on the right side of each plot). One hundred pairs of scans (first and last brain MR imaging scans) were analyzed in A, B, and C (50 per each group); 84 pairs of scans (first and last cervical spine MR imaging scans) were analyzed in D (42 per each group). The asterisk indicates P value ≤ .05; double asterisks, P value < .001.
Patients who were injected with only Gd-BOPTA (subgroups A2 + B2, n = 48) from the first to the last scan had a significantly lower increase of the SN-to-midbrain SI ratio (mean increase, +0.0103 ± 0.0512; P = .023), compared with patients who had both Gd-DTPA and Gd-BOPTA injections (subgroups A1 + B1, n = 52; mean increase, +0.0408 ± 0.0769). However, in a separate analysis of groups A and B, the differences in GP-to-thalamus, SN-to-midbrain, and DN-to-CP SI ratios between the 2 subgroups were not significant (A1 compared with A2, P = .62, P = .58, and P = .65, respectively; B1 compared with B2, P = .33, P = .17, and P = .47, respectively).
Three different multiple linear regression analyses were performed to test the relationship between clinical data and changes in the GP-to-thalamus, SN-to-midbrain, and DN-to-CP SI ratios. The results are summarized in Table 2.
Results of multiple linear regression analysis
The number of injections showed the highest significance level to predict GP-to-thalamus changes (P = .001), SN-to-midbrain changes (P = .002), and DN-to-CP changes (P = .049).
In separate correlation analyses, there was a significant positive correlation with the changes of GP-to-thalamus, SN-to-midbrain, and DN-to-CP SI for the total number of injections (Spearman ρ = 0.423, P < .001; Spearman ρ = 0.453, P < .001; and Spearman ρ = 0.310, P = .002, respectively; Fig 4) and the accumulated dose of L-GBCA (Spearman ρ = 0.359, P < .001; Spearman ρ = 0.455, P < .001; and Spearman ρ = 0.273, P = .006, respectively), while the mean interval between contrast-enhanced MR imaging showed a significant negative correlation with the SN-to-midbrain and DN-to-CP SI changes (Spearman ρ = −0.259, P = .009; Spearman ρ = −0.241, P = .016, respectively).
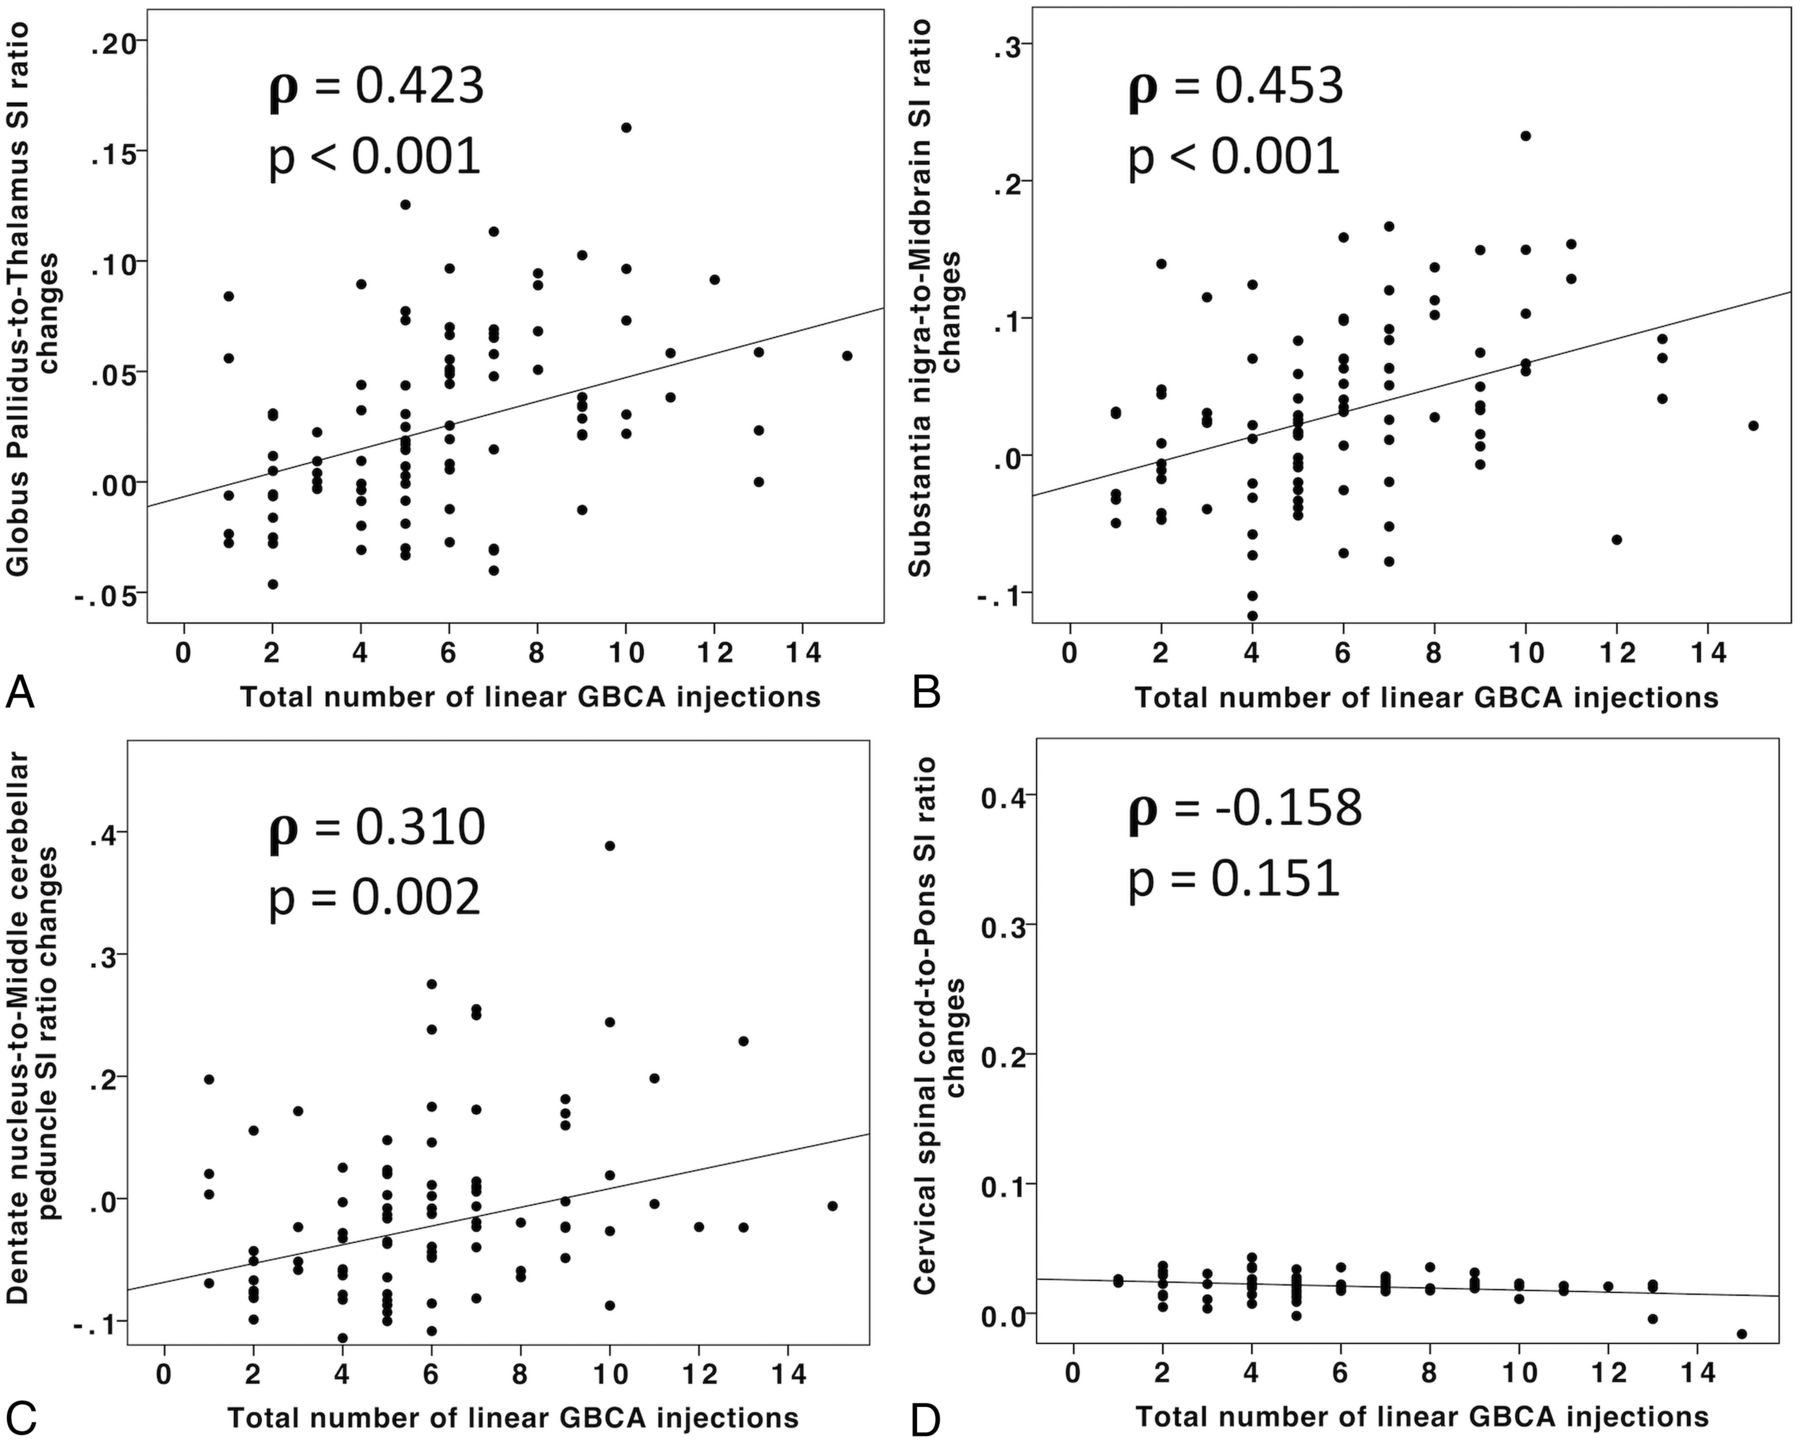
Scatterplots representing the SI ratio changes of the globus pallidus-to-thalamus (A), substantia nigra-to-midbrain (B), dentate nucleus-to-middle cerebellar peduncle (C), and cervical spinal cord-to-pons (D) according to the total number of linear GBCA injections. The Spearman rank correlation coefficient (ρ) and associated P value (P) are reported.
Radiologic Analysis: Cervical Spinal Cord
Sixteen cases (8 in each group) were discarded from the analysis due to artifacts involving ≥1 ROI and therefore potentially affecting the SI analysis.
The CS-to-pons SI changes were found to be not significantly different from 0 (P = .400), with a mean value of +0.0008 ± 0.0089 (95% CI, −0.0011–0.0027) (Fig 5). The difference in the CS-to-pons SI between the first and last scan was not statistically significant in patients who had ≥6 injections compared with patients who had ≤5 injections (P = .565) (Fig 3). Furthermore, in both groups, the CS-to-pons SI changes were not significantly different between patients who received only Gd-BOPTA from the first to last scan compared with patients who had both Gd-BOPTA and Gd-DTPA injections (group A, P = .738; Group B, P = .906).

Unenhanced sagittal T1-weighted images at the first (A) and the ninth (B) contrast-enhanced MR imaging of a 57-year-old woman with relapsing-remitting multiple sclerosis treated with natalizumab. Rectangles are the ROIs placed from the C1 to C5 level. Circles are the ROIs in the pons. Absolute numbers of signal intensity measurements are reported for each ROI. The changes of the cervical spinal cord-to-pons signal intensity ratio between the first and the last MR imaging scans are not statistically different. TR = 650 ms; TE = 10 ms; section thickness = 3 mm; matrix = 192 × 256.
Discussion
Our results showed an increase in the T1-weighted SI of the GP, SN, and DN after multiple administrations of L-GBCAs in patients with relapsing-remitting MS, whereas no changes were detected in the CS. Several studies have established a high T1-weighted SI as an indirect sign of gadolinium deposition in the setting of numerous administrations of GBCA.1⇓⇓–4,8⇓–10,13⇓–15
SI changes after >35 injections of L-GBCA in the SN were previously investigated in a small cohort of patients with brain tumors16: All patients had increased SI in the SN. The authors hypothesized that the SN might also be accumulating GBCAs, but in smaller amounts that could be detected only after a large number of injections.16 According to our analysis, we found significant SI changes in the SN after ≥6 L-GBCA injections. The SN was not specifically studied in previous studies investigating gadolinium deposition on histologic analysis.8⇓–10 Gadolinium ions could bind to citrates chelated to the endogenous neuromelanin pigment in the SN.17 Neuromelanin chelates iron as well; this feature might explain an increase in the SI on unenhanced T1WI.18 However, our results show significant SI changes only in patients who had ≥6 injections, suggesting that these changes are related to the use of gadolinium.
Gadolinium deposits have also been demonstrated in organs other than the brain,10 yet there are no studies investigating the accumulation of gadolinium in the spinal cord. We found no evidence of SI changes in the C1–C5 level of the spinal cord, suggesting no or very little gadolinium retention. Recently, the glymphatic system has been proposed to be important in both CSF and CNS gadolinium biodistributions.7,19,20 According to Nehra et al,7 the intravenous administration of a macrocyclic GBCA resulted in gadolinium accumulation within the CSF, even in the setting of normal renal function and no blood-brain dysfunction. The aquaporin-4 water channel in astrocytes enables the passive transport of low-molecular-weight materials from the CSF into the brain parenchyma and spinal cord. Our findings might be supported by the different expression of glymphatic aquaporin-4 water channels in the spinal cord compared with the brain21 and their selective loss found in inflammatory demyelinating diseases (including MS), which have a different pattern in the brain and spinal cord.22,23
In the first study investigating gadolinium deposition, specifically in patients with MS, potential confounding factors (eg, age, sex, immunotherapy and disability status) were not addressed.6 More recently, a retrospective analysis investigated the relationship of multiple L-GBCAs injections to the SI Index in the DN and GP and any associations with cognitive function in patients with MS.24 In our study, we included multiple clinical factors and focused on physical disability (EDSS), but extensive neuropsychological testing was not collected. Although we found a positive correlation between L-GBCA injections and EDSS worsening, the causal relationship cannot be established on the basis of our results. We believe this is more likely the effect of the pathophysiologic progression of MS associated with chronic neurodegeneration and a gradual increase in disability.
Limitations of our study include its retrospective nature and the absence of pathologic correlation with neuroimaging findings. Moreover, as with most published articles investigating gadolinium deposition, any GBCA injections in addition to the ones reported in clinical records could not be excluded in the study population. However, patients conforming to eligibility criteria were asked about GBCA injections not performed in our institution to limit this potential confounder.
The lack of a control group does not exclude the possibility of SI changes due to MS.
The slight variation of imaging-acquisition parameters (±13% for TR and ±1% for TE) could potentially affect the SI measurements. Nevertheless, we decided to accept a limited variation because previous studies have shown that SI analysis should not be crucially affected when the variation of TR and TE is small.3,13 This allowed us to include a large number of patients in the study, increasing the statistical power of the results. Furthermore, in our study, most of the variation occurred among different patients, while the parameters did not remarkably change between the first and the last scan in each patient.
It was not possible to compare Gd-DTPA with Gd-BOPTA. The statistical power of the results concerning the subgroup analysis is lower than that of the group analysis, due to the lower number of patients included in each subgroup. Although the number of Gd-DTPA injections was only 17% of the total, the inclusion of both Gd-DTPA and Gd-BOPTA represents a potential bias because Gd-BOPTA has been shown to be potentially more stable than other GBCAs.11
Concerning the CS, it was not possible to include the whole spinal cord in the ROI analysis; however, the unenhanced T1-weighted sequences were assessed entirely visually as well; no visible SI increase was detected.
Despite these limitations, this is the first study to systematically investigate SI changes of the SN and CS after multiple L-GBCAs injections. To the best of our knowledge, this study represents the largest MS series on the topic. Additionally, multiple clinical factors were included in the analyses to strengthen our results and limit other confounders.
Conclusions
In this study, we demonstrated that patients with MS receiving ≥6 L-GBCA injections showed a significant increase of the SI in the GP, DN, and SN, while no detectable signal changes were observed in the CS. This finding is relevant for future studies investigating the clinical implications of gadolinium retention and the mechanisms that contribute to it.
Footnotes
Giuseppe Barisano and Bavrina Bigjahan contributed equally as co-first authors.
Disclosures: Alexander Lerner—UNRELATED: Board Membership: Guerbet, Comments: Advisory Board member; Grants/Grants Pending: Bracco Diagnostics, Philips Healthcare, Comments: research grants.* Arthur W. Toga—UNRELATED: Grant: National Institutes of Health, Michael J. Fox Foundation, Alzheimer's Association, CHDI Foundation, Department of Defense*; Support for Travel to Meetings for the Study or Other Purposes: International Organization of Psychophysiology, Michael J. Fox Foundation, Ontario Brain Institute, Gates Ventures, National Institutes of Health, Medical Research Council UK, Institute of Electrical and Electronics Engineers, Forschungszentrum Jülich GmbH. Meng Law—UNRELATED: Board Membership: Guerbet; Consultancy: GE Healthcare; Grants/Grants Pending: National Institutes of Health, Bracco Diagnostics.* Lilyana Amezcua—UNRELATED: Consultancy: Sanofi Genzyme, Biogen; Grants/Grants Pending: National Multiple Sclerosis Society, National Institutes of Health–National Institute of Neurological Disorders and Stroke, Biogen. *Money paid to institution.
REFERENCES
- Received March 22, 2019.
- Accepted after revision June 6, 2019.
- © 2019 by American Journal of Neuroradiology


Jump to section
Related Articles
Cited By...
- No citing articles found.