
Abstract
BACKGROUND AND PURPOSE: Though CT is a highly calibrated imaging modality, head CT is typically interpreted qualitatively. Our aim was to initiate the establishment of a reference quantitative database for clinical head CT.
MATERIALS AND METHODS: An automated segmentation algorithm was developed and applied to 354 clinical head CT scans with radiographically normal findings (ages, 18–101 years; 203 women) to measure brain volume, brain parenchymal fraction, brain radiodensity, and brain parenchymal radiomass. Brain parenchymal fraction was modeled using quantile regression analysis.
RESULTS: Brain parenchymal fraction is highly correlated with age (R2 = 0.908 for men and 0.950 for women), with 11% overall brain volume loss in the adult life span (1%/year from 20 to 50 years and 2%/year after 50 years of age). Third-order polynomial quantile regression curves for brain parenchymal fraction were rationalized and statistically validated. Total brain parenchymal radiodensity shows a decline as a function of age (14.9% for men, 14.7% for women; slopes not significantly different, P = .760). Age-related loss of brain radiomass (the product of volume and radiodensity) is approximately 20% for both sexes, significantly greater than the loss of brain volume (P < .001).
CONCLUSIONS: An automated segmentation algorithm has been developed and applied to clinical head CT images to initiate the development of a reference database for quantitative brain CT imaging. Such a database can be subject to quantile regression analysis to stratify patient brain CT scans by metrics such as brain parenchymal fraction, radiodensity, and radiomass, to aid in the identification of statistical outliers and lend quantitative assessment to image interpretation.
ABBREVIATIONS:
- BPF
- brain parenchymal fraction
- TIV
- total intracranial volume
- SD
- standard deviation
Abnormalities in brain volumetrics have been associated with congenital and acquired diseases. Most in vivo studies have been performed with MR imaging of healthy volunteers and measure global and regional volume loss.1-8 Lack of an accepted normative database, together with evidence that measurements are influenced by differences in postprocessing methods, has limited quantitative reporting.9
Among adults, MR imaging has been used to identify abnormalities of global brain volume in multiple sclerosis,10,11 amyotrophic lateral sclerosis,12 and age-related dementia,13 with brain parenchymal fraction (BPF) permitting normalization for subject variability.14,15 MR imaging also suggests that brain volume is reduced by antipsychotic medications,16 steroids,17 alcohol use,18 and radiation and chemotherapy19 among other things. Changes in brain radiodensity or radiomass (the product of volume and radiodensity), as a function of disease states are relatively unexplored topics. Identifying and quantifying tissue loss through volumetric measures, measures of radiodensity or radiomass, may aid in the diagnosis or monitoring of brain pathology. To account for intrasubject variability as well as variability as a function of age and sex, correlating metrics with pathology requires a reference database. The initiation of such a reference database is the goal of the current study.
CT imaging appears highly suitable for in vivo study of the brain because it is routinely acquired in the clinical setting and is less subject to motion artifacts than MR imaging. Radiodensity characteristics of the brain and skull enable automated volumetric and radiodensity assessment. Furthermore, the relatively low clinical threshold for performing CT provides large numbers of studies with radiographically normal findings, enabling the generation of a large reference database for statistical analysis.
In the current study, we report brain volumes from 354 subjects, both before and after normalization to the intracranial volume, expressed as a function of age and sex. Total radiodensity and radiomass estimations are also calculated. Statistical methods are used with quantile regression applied to brain parenchymal fraction measures. We propose that a clinical database can be used to quantitatively assess new cases in the context of a clinical peer group.
MATERIALS AND METHODS
Study Design
This study was limited to a retrospective analysis of head CTs performed on patients who were identified from the clinical PACS. The study was approved by this institutional review board (Geisinger Medical Center), and a waiver of consent was granted.
Study Cohort
All studies were from a single CT scanner during a 2-year time interval (January 1, 2015, to December 31, 2016). Selected cases were scanned for nonspecific symptoms (headache, syncope, vertigo), were without known systemic disease, and were discharged without incident. All control cases were interpreted as having normal findings (without acute or chronic abnormal findings) by 2 board-certified neuroradiologists.
Imaging Data
The CT scanner (LightSpeed VCT; GE Healthcare) primarily serves the emergency department of a level 1 trauma center. The axial acquisition noncontrast head CT protocol consists of 135 kV(peak) and modulated milliampere, minimum 50 and maximum 290 mA; rotation time, 0.75 seconds, acquired from the foramen magnum through the vertex with a standard 512 × 512 matrix; and 24-cm FOV at 5.0-mm section thickness. The scanner undergoes a daily quality assurance procedure, which assesses the radiodensity of water. This value must be within allowable limits, generally 0–5 HU. Drift or trending is rarely observed. In addition, scanners undergo an annual inspection by a medical physicist using the American College of Radiology phantom. Acceptable ranges of Hounsfield units for clinical scanners are broad (−7 to +7 HU for water, 110–135 HU for acrylic). This testing is extended to all kV(peak) values used by the scanner. Additionally, service engineers routinely test the calibration at preventive maintenance.
Image Processing and Analysis
DICOM images were converted to the Neuroimaging Informatics Technology Initiative data format using MRIConvert-2.0.7 (https://www.softpedia.com/get/Science-CAD/MRIConvert.shtml). Images were first thresholded from −15 to 50 HU to grossly remove background and skull. Brain extraction was then applied using the FSL Brain Extraction Tool (http://fsl.fmrib.ox.ac.uk/fsl/fslwiki/BET) with a fractional intensity threshold of 0.01. All cases were carefully reviewed for the integrity of brain extraction. For segmentation, a 3-tissue-compartment segmentation using the FMRIB Automated Segmentation Tool (http://fsl.fmrib.ox.ac.uk/fsl/fslwiki/fast) was used, with the resulting white matter and gray matter compartments combined into a single brain compartment (Fig 1). The brain parenchymal fraction (BPF) was calculated as the ratio of brain volume to total intracranial volume, consisting of brain plus CSF space. Brain radiomass was calculated as the product of mean brain radiodensity and brain volume.

Brain extraction and CSF segmentation. A, Raw head CT image. B, Brain extracted image; volume = TIV (total intracranial volume). C, Thresholded to identify CSF. BPF = TIV–CSF volume/TIV.
Statistical Methods
Statistical analysis was performed using GraphPad Prism software, Version 7.0c for Mac OS X (GraphPad Software). Polynomial regression models were performed in R Studio (Version 1.2.1335; http://rstudio.org/download/desktop). The overall polynomial regression of third degree of age was fitted on the BPF, after adjusting for sex. For male and female subgroups, quantile regression was adopted to characterize BPF, with the polynomial term of age. Models were evaluated using leave-one-out cross-validation, and root-mean-square errors were computed for predictive accuracy. At a .1 significance level, significant differences were observed in BPF between men and women.
RESULTS
Brain Parenchymal Volume
A scatterplot of brain parenchymal volume from adult male and female subjects as a function of age is shown in Fig 2A. The mean brain volume for men is 1209 ± 133.6 cm3, and for women, 1056 ± 107.4 cm3). Across all ages, whole-brain volumes were approximately 10% smaller for female subjects. The slopes of the linear regression trendlines for brain volume (men, R = 0.413, R2 = 0.17; women, R = 0.425, R2 = 0.18) are not significantly different between the sexes (P = .5451) (On-line Table 1). The loss of brain volume calculated from the linear trendline from 20 to 100 years is 14.0% for men and 13.9% for women, without a significant difference.
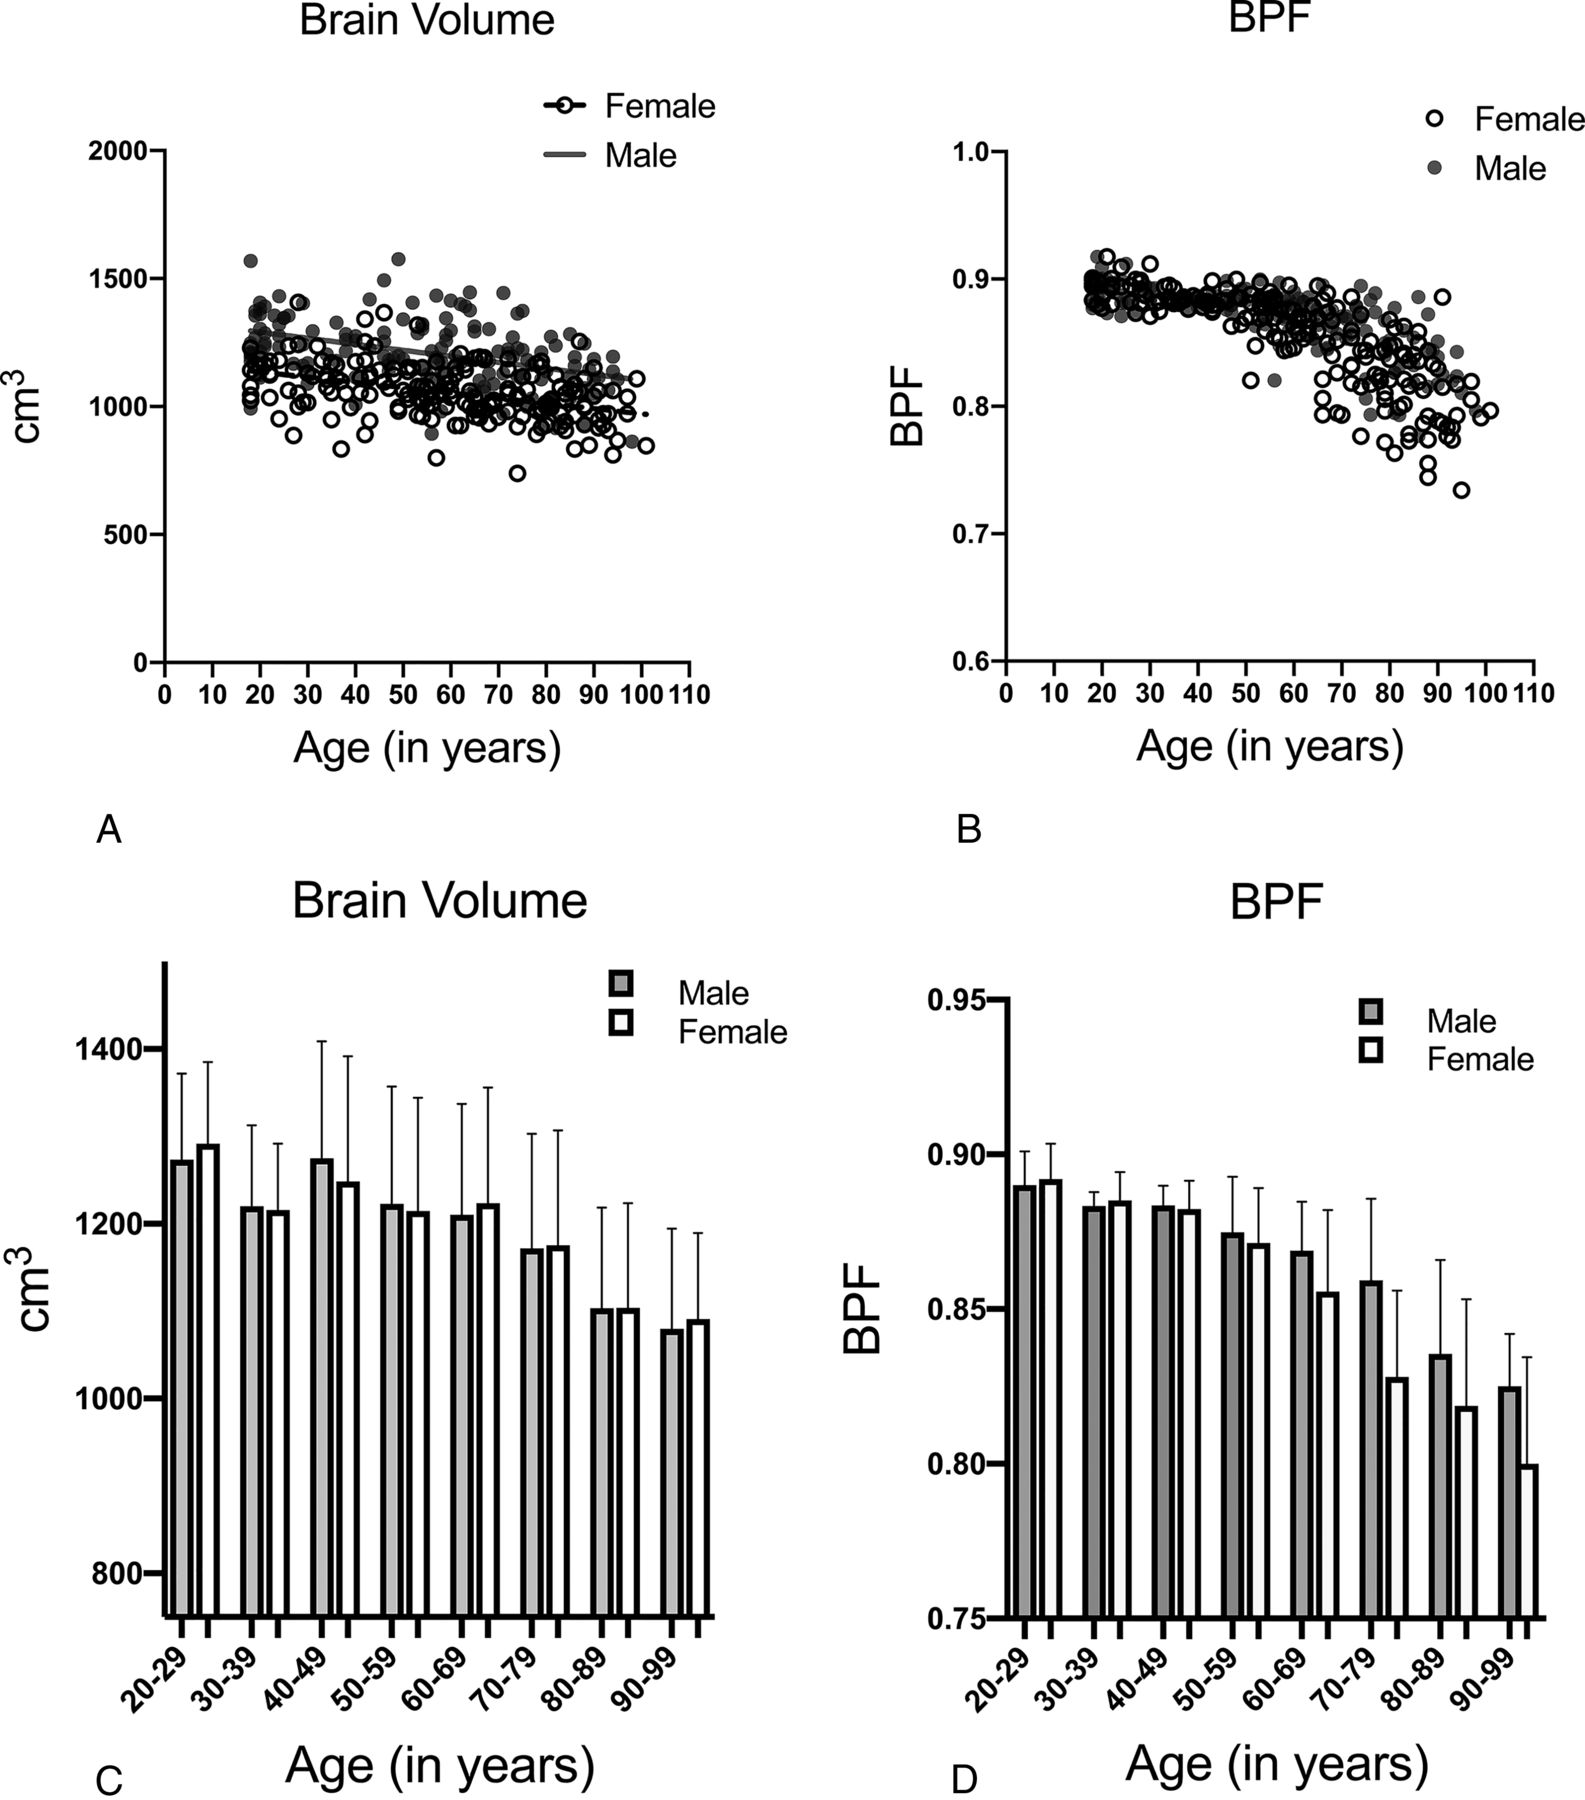
A, Brain volume as a function of age and sex. B, Brain parenchymal fraction as a function of age and sex. C, Bar chart of brain volume with decade age grouping, with SDs. Gray bars indicate men; white bars, women. D, Bar chart of BPF with decade age grouping, with SDs. Gray bars indicate men; white bars, women.
Brain Parenchymal Fraction
BPF from adult male and female subjects as a function of age is shown in Fig 2B. The brain parenchymal fraction ranges from approximately 0.9 to 0.75, showing a curvilinear decline with age. The mean BPF is 0.843 for women and 0.847 for men and the difference was not significant between the sexes (Student t test, P = . 48). Linear regression with age shows R2 = 0.51 for men and 0.62 for women. BPF shows a decreased coefficient of variation relative to brain volume (3.085% vs 11.06% for men, 4.632% vs 10.2% for women; male data is shown in On-line Table 1).
The bar charts (Fig 2C and 2D) show decade groupings of the age cohorts. The BPF shows increased correlation with age, with decreased SD relative to brain volume measure. Statistical correlations of brain parenchymal volume and BPF are shown in On-line Table 2.
Brain Parenchymal Density
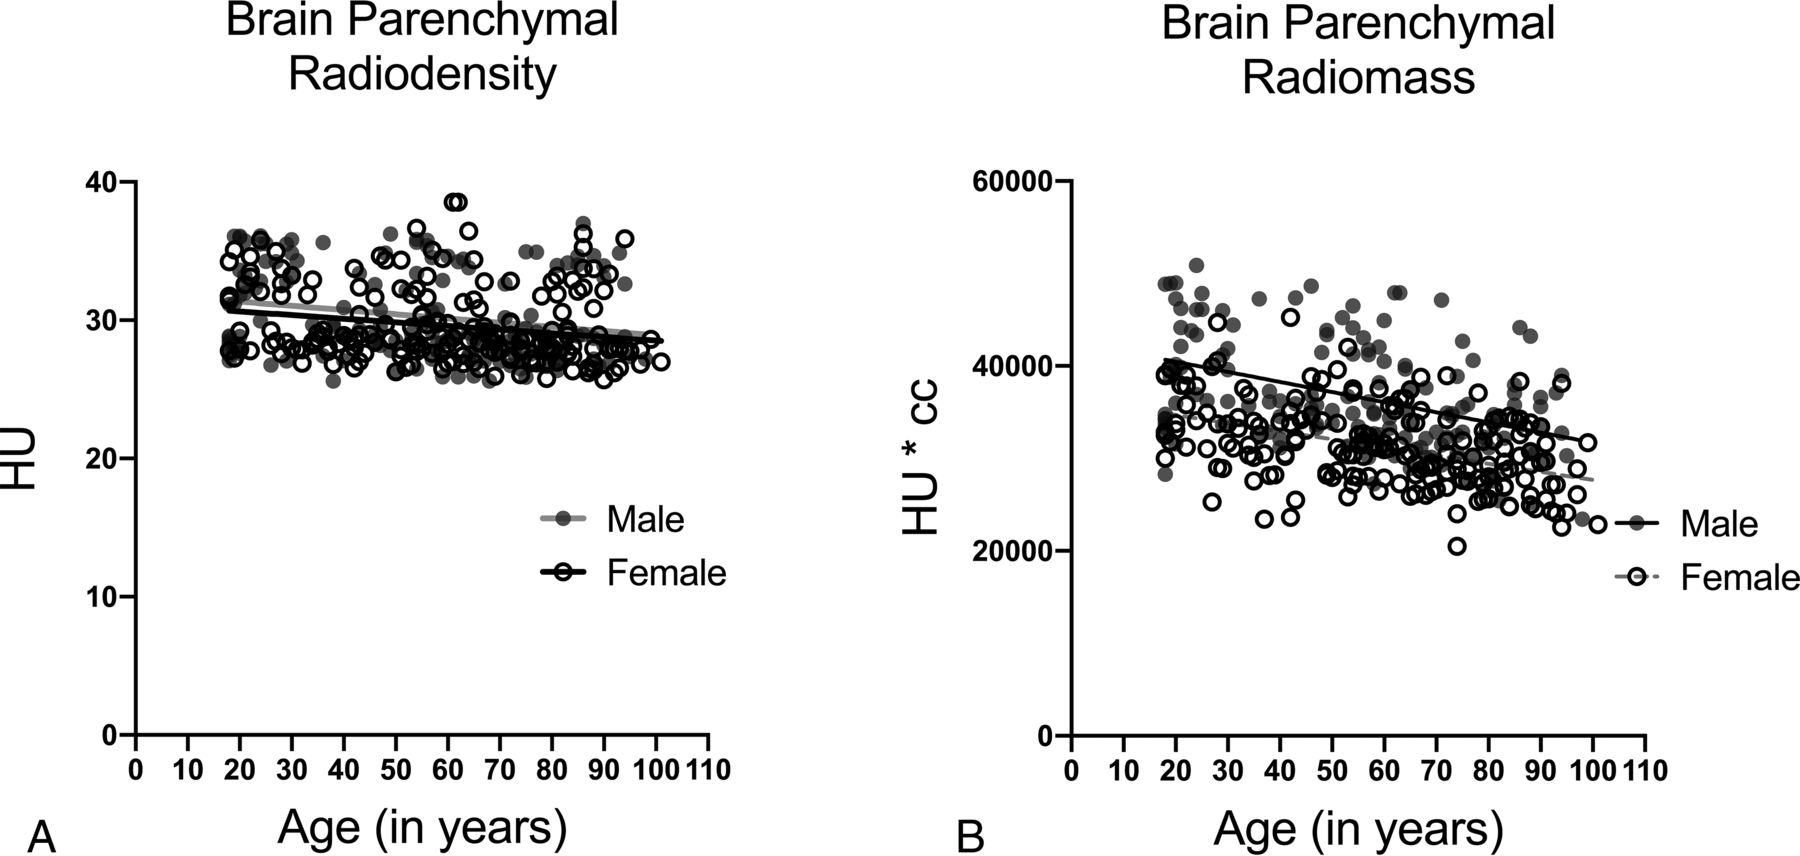
The brain parenchymal density (Fig 3A) is taken as the mean Hounsfield unit number for total brain parenchyma. Considerable variation is seen in the mean parenchymal density for both sexes. The mean Hounsfield unit density for men is 30.29 ± 3.20, and for women, 29.58 ± 2.70. Male mean brain parenchymal density is slightly-but-significantly greater than for women (P = .0263). The mean brain parenchymal density declines significantly with age from 31.34 to 28.91 for men (P < .0061, −7.74%) and from 30.64 to 28.54 for women (P = .0026, −6.8%). The slopes of the linear regression lines are not significantly different (P = .76). Analysis by decade grouping by age shows that the third decade (20–29 years) is significantly different from the older groups (male data shown in On-line Table 3).

A, Brain parenchymal radiodensity as a function of age and sex. B, Estimated brain radiomass (volume × radiodensity) as a function of age and sex.
Brain Parenchymal Radiomass
Brain volume multiplied by brain radiodensity yields total brain radiomass, measured as cubic centimeter × Hounsfield unit (Fig 3B). The mean brain radiomass was 36,671.6 ± 5954 for men and 29,291 ± 8816 for women, with female brain radiomass being consistently approximately 20% less than for men. For women, the brain mass was 34,876 at 18 years and 27,673 at 100 years, a 20.7% decline. For men, the brain mass was 40,679 at 18 years and 31,709 at 100 years, a 22% decline, with differences in regression slopes not significant (P = .325). Significance between decade cohorts is achieved between the third decade and the older decade cohorts (male data shown in On-line Table 3).
Quantile Regression
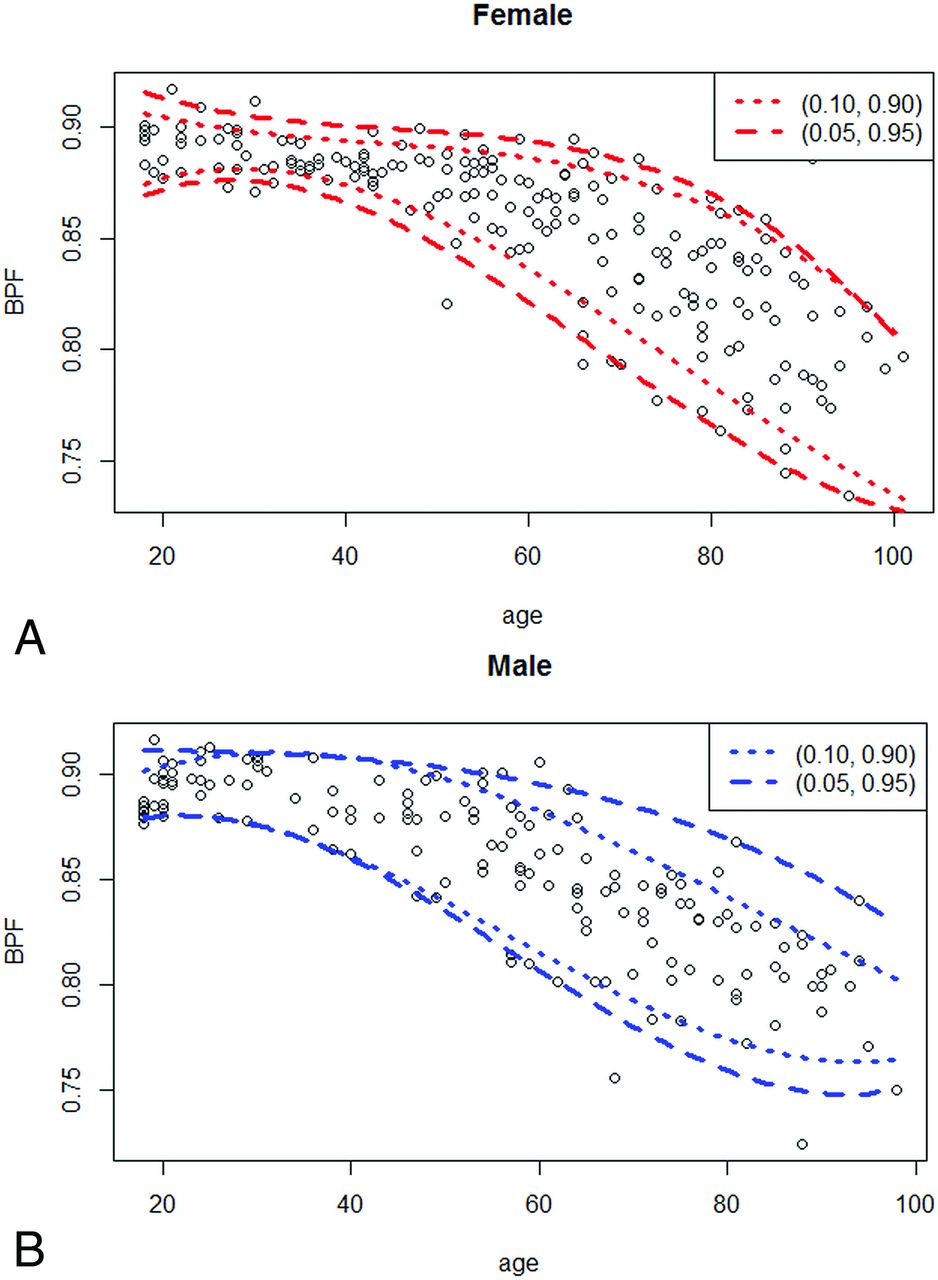
BPF was chosen to illustrate quantile regression. The overall polynomial regression of third degree of age was fitted on the brain parenchymal fraction, after adjusting for sex. Overall polynomial regression indicated differences between men and women (mean difference = −0.005; 95% confidence interval, 0.01 to −1e-04; P = .046). Therefore, we fitted a quantile regression model of third degree of age on brain parenchymal fraction for men (Fig 4A) and women (Fig 4B), respectively, with a polynomial curve of third degree of age plotted at 0.05-tile and 0.95-tile, and 0.10-tile and 0.90-tile. The coefficients of the polynomial regression models are shown in the Table.

Quantile regression of brain parenchymal fraction. Scatterplot of BPF as a function of age for female patients (A) and male patients (B). Quantile regression lines are drawn by polynomial curve fitting with 5th and 95th percentile as dashed lines, and 10th and 90th percentile as dotted lines. Polynomial coefficients are shown in Table 1.
Coefficients of polynomial regression models
DISCUSSION
Our study is a quantitative analysis of clinical images. Most brain studies of this type are performed with MR imaging, on healthy volunteers under ideal conditions. The goal of the current study was the development of a clinical tool; our study is derived from clinical images so that patients can be compared with their clinical peer group using the same imaging technique under identical conditions. While current image interpretation is largely qualitative, an automated quantitative analysis together with statistical methods such as quantile regression enables a quantitative assessment of brain parameters.
The data show large variance in brain volumes, consistent with previous reports that total brain size can vary almost 2-fold among individuals of the same age.20 Adult brain volumes are consistent with published literature, with our study focusing on the parenchymal volume.4,21,22 The female brain parenchymal volume is 1056 cm3, approximately 12.6% smaller than for men (mean parenchymal volume, 1209 cm3) not adjusted for body size, with a near-linear 14.9% decrease in male brain volume and 14.7% decrease in female brain volume during the adult life span (18–100 years), also consistent with previous reports.3,4
The BPF is taken as a ratio of brain parenchymal volume to the intracranial volume9,23 and serves to normalize the brain volume to account for variations in head size, with increased sensitivity for age-related atrophy or pathology.12,13,15,23,24 To our knowledge, the BPF has not been previously derived from head CT imaging. Because brain volume can vary as much as 2-fold even in the younger population, the CT BPF shows considerably less variation, decreasing from approximately 0.9 in early adulthood to 0.75 in late life, as has been noted in an MR imaging study of volunteers.3 BPF shows significantly greater correlation with age than brain volume (On-line Tables 1–3).
CT has the advantage over MR imaging in that the image signal intensity is a direct measure of the radiodensity and is a calibrated and scaled metric. Previous studies have found declines in Hounsfield units with aging,25,26 whereas other studies report no change.27,28 Global variant brain tissue density has been shown to correlate with acute and chronic pathology.29,30 Imprecisions of machine calibration may contribute to the variance in radiodensity; however, several patterns are evident. First, there is a significant negative trendline slope of radiodensity as a function of age for both men and women (P < .001). Second, the radiodensity of the 20- to 29-year group in both sexes is statistically significantly higher than in older groups (On-line Tables 1–3). These data argue for an age-dependent decline in brain tissue radiodensity. A decline in brain tissue density may correlate with neuronal loss and/or an increase in lipid or water content. Myelin is less dense than water, and relative loss of myelin would not be expected to result in decreased density.
Most imaging studies of brain atrophy measure the loss of tissue volume only. CT enables assessment of tissue radiodensity, with the product of radiodensity and volume, yielding an estimate of total brain radiomass. Radiomass can be correlated with mass measures from postmortem data. An authoritative postmortem study by Svennerholm et al31 showed a 20% decrease in brain parenchymal mass from 20 to 100 years of age for women and 22% for men. Our study of decade age cohorts shows a 22% decrease from the third to the 10th decade for both sexes. The data of Svennerholm et al also showed that the average female brain mass is 16% smaller than the male brain mass, whereas the brain volume is only 10% smaller. Both sets of data illustrate that brain mass declines significantly more than is reflected by a measure of brain volume alone.
Quantile regression is used as a quantitative method for comparing a given case with the total pool of reference cases. BPF was chosen for illustration. Third-order polynomial was best fit for the data. Small-but-measurable differences were seen between men and women, with slightly greater volume loss in men at older ages (Table). Similar regressions could be performed for each type of quantitative metric. New cases could be described in terms of the quantile position relative to the reference database.
Study Limitations
A potential criticism of this database is that included studies may not be “normal” because each study is obtained for a clinical reason. The goal of this study was not to identify true normal but to characterize the clinical population and develop a clinically useful database with which future studies might be compared. A large database together with statistical methods will approximate normalcy (i.e., the law of large numbers applies) or at least provide a clinically useful reference. CT entails radiation exposure and recruiting large numbers of healthy volunteers from the clinical archive facilitates the development of a large database of both sexes across the life span.
All data for this study originated from a single CT scanner. Although contemporary scanners are highly calibrated, differences between scanners or scan protocols could introduce an additional variable. Measured volumes and BPFs would be expected to show little variance across scanners, though measured Hounsfield units may vary.32 Data from different scanners may be merged using statistical methods such as z scoring; more rigorous calibration standards may be necessary for broad implementation of a standard database.
CONCLUSIONS
This study demonstrates that a large pool of clinical CT data can be subject to automated analysis to yield brain metrics supported by the existing literature. The total brain metrics of BPF, brain parenchymal density, and brain parenchymal mass derived from CT images are novel reports and show high correlation with loss of brain matter as a function of the aging process. Clinical head CT data can be subject to analytic methods to quantitatively assess new studies in the context of a clinical peer group.
Footnotes
This work was supported by a grant from Geisinger Clinical Research Fund to K.A.C. and S.W.F., SRC-L-58.
Disclosures: Keith Cauley—RELATED: Grant: Geisinger Clinical Research Grant, Comments: internal research grant, no money paid to me; UNRELATED: Employment: Geisinger Medical Center.
References
- Received November 17, 2019.
- Accepted after revision January 30, 2020.
- © 2020 by American Journal of Neuroradiology


Jump to section
Related Articles
Cited By...
- Assessing the Performance of Artificial Intelligence Models: Insights from the American Society of Functional Neuroradiology Artificial Intelligence Competition
- A Comparison of Global Brain Volumetrics Obtained from CT versus MRI Using 2 Publicly Available Software Packages
- Head CT: Toward Making Full Use of the Information the X-Rays Give
- Pediatric Head CT: Automated Quantitative Analysis with Quantile Regression