
Abstract
BACKGROUND AND PURPOSE: Head and neck cancer is common, and understanding the prognosis is an important part of patient management. In addition to the Tumor, Node, Metastasis staging system, tumor biomarkers are becoming more useful in understanding prognosis and directing treatment. We assessed whether MR imaging texture analysis would correctly classify oropharyngeal squamous cell carcinoma according to p53 status.
MATERIALS AND METHODS: A cohort of 16 patients with oropharyngeal squamous cell carcinoma was prospectively evaluated by using standard clinical, histopathologic, and imaging techniques. Tumors were stained for p53 and scored by an anatomic pathologist. Regions of interest on MR imaging were selected by a neuroradiologist and then analyzed by using our 2D fast time-frequency transform tool. The quantified textures were assessed by using the subset-size forward-selection algorithm in the Waikato Environment for Knowledge Analysis. Features found to be significant were used to create a statistical model to predict p53 status. The model was tested by using a Bayesian network classifier with 10-fold stratified cross-validation.
RESULTS: Feature selection identified 7 significant texture variables that were used in a predictive model. The resulting model predicted p53 status with 81.3% accuracy (P < .05). Cross-validation showed a moderate level of agreement (κ = 0.625).
CONCLUSIONS: This study shows that MR imaging texture analysis correctly predicts p53 status in oropharyngeal squamous cell carcinoma with ∼80% accuracy. As our knowledge of and dependence on tumor biomarkers expand, MR imaging texture analysis warrants further study in oropharyngeal squamous cell carcinoma and other head and neck tumors.
ABBREVIATIONS:
- HNSCC
- head and neck squamous cell carcinoma
- FTFT-2D
- 2D fast time-frequency transform tool
- Post-Gad T1WI
- T1WI with gadolinium
- ST
- Stockwell transform
- TP53
- mutation in the gene encoding the p53 protein
- Weka
- Waikato Environment for Knowledge Analysis
Head and neck cancer is the sixth most common cancer worldwide,1 with squamous cell carcinoma accounting for approximately 90% of all cases. Most head and neck squamous cell carcinoma (HNSCC) occurs in the oral cavity, oropharynx, and larynx. Alcohol and tobacco consumption and prior infection with human papillomavirus are the major risk factors associated with the development of head and neck squamous cell carcinoma. Oropharyngeal squamous cell carcinoma is of particular interest because its incidence is increasing, particularly among younger, nonsmoking patients.2
Accurate staging of HNSCC is essential for treatment planning and prognostication, and a standard tool used for staging is the American Joint Committee on Cancer Tumor, Node, Metastasis staging system, currently in its seventh revision.3 As we learn more about tumor biology, however, it is clear that this staging system does not fully predict clinical behavior and prognosis. Our knowledge of head and neck cancer pathogenesis has rapidly increased, and better understanding of molecular mechanisms holds the promise of discovering predictive and prognostic biomarkers that might be helpful in the management of HNSCC.4 The tumor suppressor p53 plays an important role in conserving genomic stability.5 p53 facilitates DNA repair by regulating the cell cycle and has a role in preventing cancer emergence.6,7 Mutations in the gene encoding the p53 protein, TP53, occur in almost 50% of all cancers.8,9 In most of HNSCC, mutation and inactivation of p53 is an essential and early event in neoplastic transformation, and TP53 mutations are associated with poor prognosis in HNSCC.10⇓–12 A landmark prospective study classified TP53 gene mutations on the basis of their effect on p53 protein structure.13 Broadly, disruptive mutations disturb the formation of p53-DNA complexes, while nondisruptive mutations have little effect on the association between p53 and DNA. The study reported a significant association between the presence of TP53 disruptive mutations and worse overall survival in surgically treated HNSCC compared with both nondisruptive TP53 mutations and wild-type TP53.13 A recent study has also implicated disruptive mutations in TP53 leading to radiation-treatment failure.14
Medical imaging plays a critical role in the assessment of many head and neck tumors, and both CT and MR imaging have important roles in the anatomic evaluation of HNSCC.15⇓⇓–18 In addition to anatomic details, the analysis of MR images provides additional metabolic and biologic information in tumors.19 Mathematic techniques that quantify image characteristics have been applied to a vast array of pathologies, from multiple sclerosis,20 attention deficit/hyperactivity disorder,21 and Alzheimer disease22 to breast cancer,23 cervical cancer,24 and brain tumors.25 Studies in glioblastoma have shown that there is a correlation between the methylation of O6-methylguanine-DNA methyltransferase and MR imaging features.26 Levner et al27 extracted texture features from MR images by using spatial frequency analysis and the Stockwell transform (ST) representation28 and fed these characteristics into a neural network to predict the methylation status with an average accuracy of 87.7%.27 Brown et al25 also extracted ST texture features from brain MR images to find that codeletion of chromosomes 1p and 19q, a marker of good prognosis in oligodendroglioma brain cancer, could be predicted with 94% accuracy. These studies suggest that differences in tumor-tissue composition react with MR imaging signals differently, thus affecting texture features.
Yu et al29 looked at differentiating tissues by using texture characterization on FDG-PET/CT images in head and neck cancers. We explored the use of ST texture features on MR images with a machine-learning technique to objectively differentiate head and neck tumors by p53 status. We hypothesized that MR image analysis could successfully discriminate p53-positive and -negative tumors.
Materials and Methods
Patients
This prospective study was approved by the University of Calgary Conjoint Health Research Ethics Board. Patients older than 18 years of age with biopsy-proved HNSCC of the oropharynx or hypopharynx presenting to the University of Calgary Head and Neck Tumor Clinic between October 2010 and September 2011 were eligible for inclusion. Patients were excluded under the following conditions: 1) They had already been treated for the index cancer, 2) were undergoing palliative treatment only, 3) had already been treated for another head and neck primary cancer, or 4) had a tumor with a greatest axial extent of <2 cm. The last criterion ensured that the lesions were large enough for accurate MR imaging texture analysis. Twenty-one patients were eligible for inclusion in the study; however, in 1 patient, p53 immunohistochemistry was not performed and another 4 patients did not have MR imaging performed before treatment. Therefore, the final study cohort included 16 patients. Patient image data were anonymized by using DICOM Anonymizer Pro (http://www.neologica.it/eng/DICOMAnonymPro.php).30
Interventions
All subjects underwent a standard pretreatment work-up that included a complete clinical head and neck examination, fiber-optic endoscopy, contrast-enhanced CT, MR imaging, and an examination under anesthesia with appropriate biopsies. No additional procedures or interventions were imposed on the subjects, and no delays in treatment resulted from their participation in this study.
Histopathology and p53 Immunohistochemistry
Tumor biopsies or surgically resected specimens or both were reviewed by an anatomic pathologist by using hematoxylin-eosin light microscopy. Immunohistochemistry staining for p53 was performed in 20 of 21 specimens, our standard protocol for oropharyngeal and hypopharyngeal cancers. The intensity of immunohistochemistry staining was graded by the pathologist by using a 4-category scoring system ranging from 0 for no visible stain to 3+ for diffusely positive staining. According to standard practice, cases that were graded as 3+ were considered positive for p53.
Imaging
Imaging focused on the oropharynx and hypopharynx was performed on MR imaging systems operating at 1.5T with 3-mm sections and 1-mm in-plane resolution. Standard clinical MR images were used, including the following that were subsequently used for texture analysis: axial fast spin-echo T2-weighted imaging with fat saturation, axial fast spin-echo T1WI with gadolinium (Post-Gad T1WI), and axial diffusion-weighted imaging with an apparent diffusion coefficient map.
Image Processing and Texture Analysis
Each patient's MR images were analyzed by an experienced neuroradiologist (J.T.L.), who then outlined the tumor region of interest by using OsiriX Imaging Software (http://www.osirix-viewer.com). Both OsiriX and DICOM Anonymizer Pro were run on an iMac 3.2-GHz Intel Core i7, Mac OS X Snow Leopard (Apple, Cupertino, California). We then used OsiriX to create masks of the tumor outlines (Fig 1). The masks and MR images of all cases were then fed into the 2D fast time-frequency transform tool (FTFT-2D) (Medical Imaging Informatics; Mayo Clinic, Scottsdale, Arizona), which processes the Stockwell transform of local spectra for a 2D image and its statistics and quantifies the texture features.31 This tool requires an input of the mask and its respective original MR image in DICOM file format. The images need to be ≤512 × 512 pixels. The pixels inside and outside the region of interest were set to 65,535 and 0, respectively, and were exported as a DICOM file. The FOV and matrix size of the scans were preprocessed to 240 mm and 256 × 256 pixels, respectively, with a trilinear interpolation algorithm by using MeVisLab (MeVis Medical Solutions, Bremen, Germany).
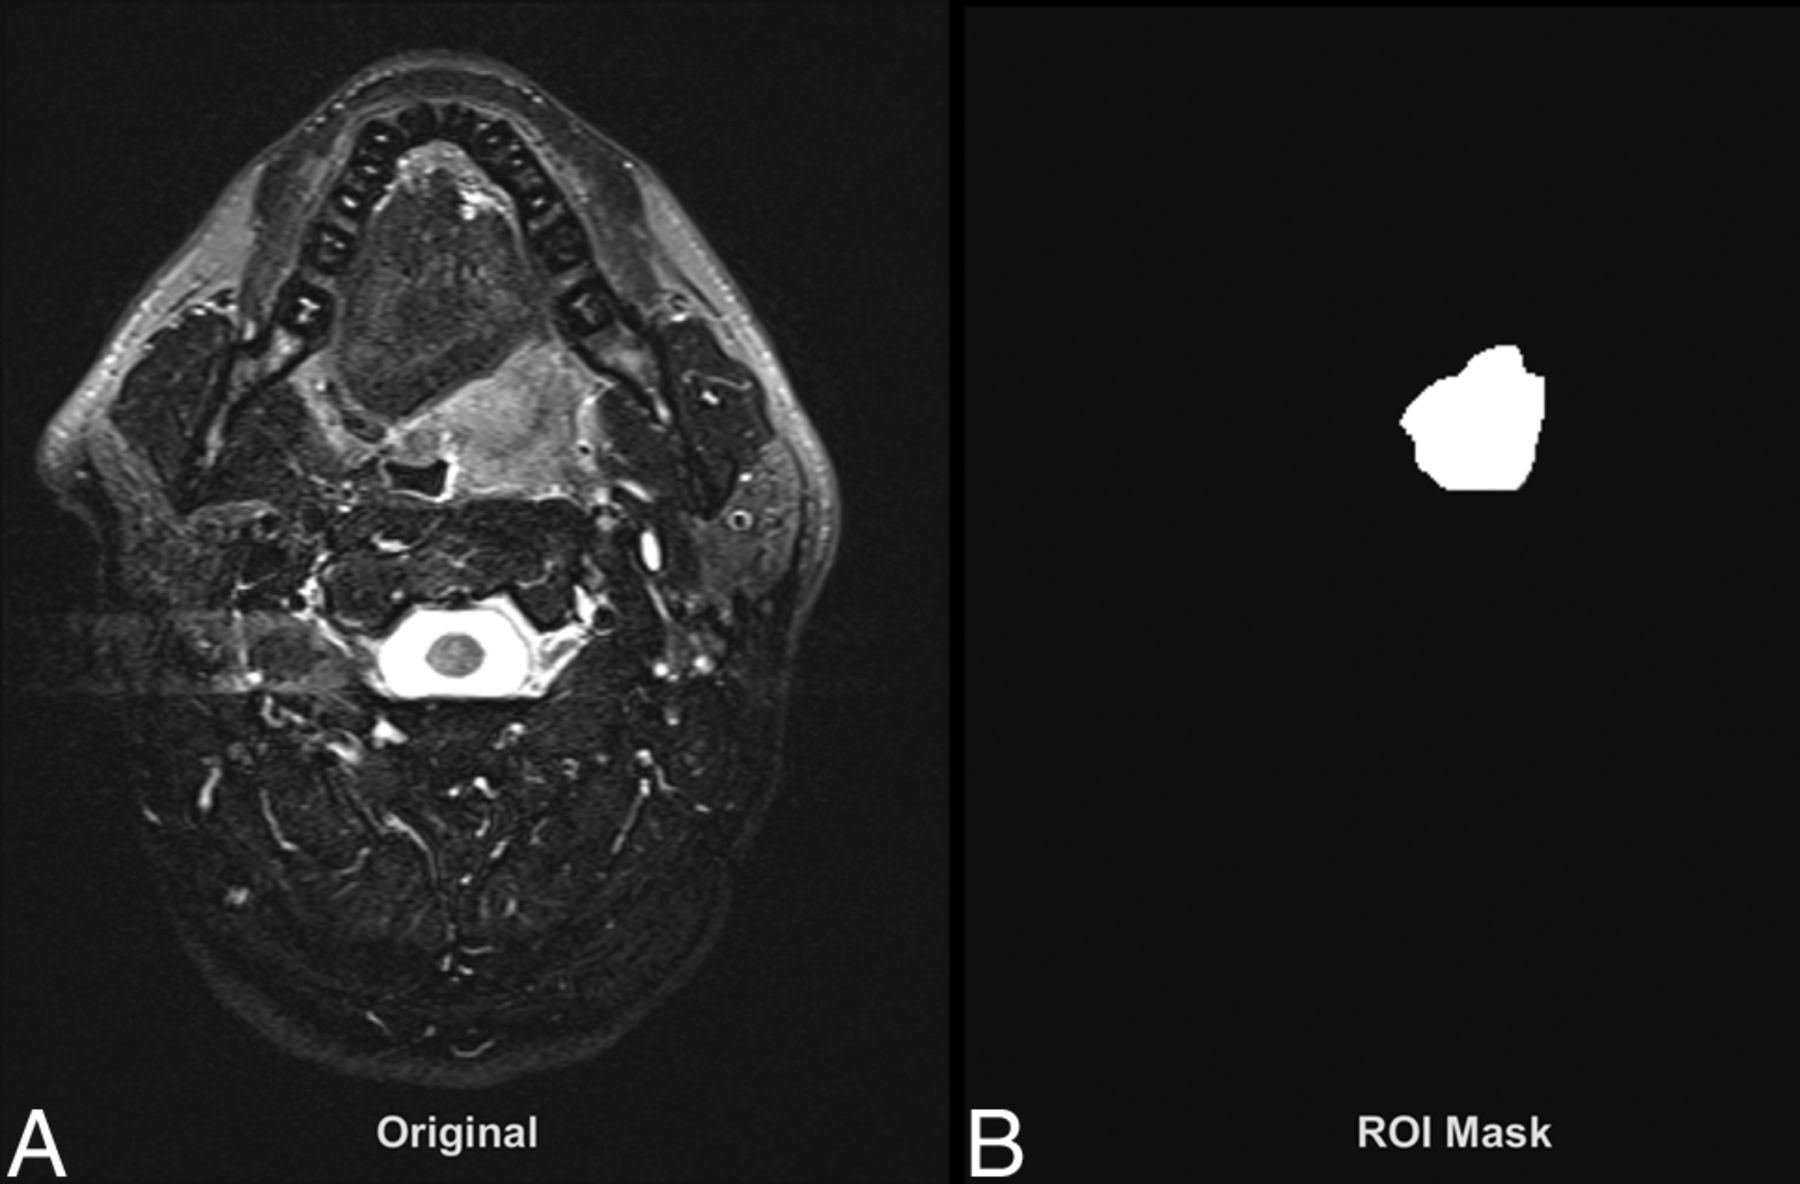
Sample of the FTFT-2D input data for texture analysis. A, Original DICOM MR image (T2WI). B, Region-of-interest mask of the tumor.
To illustrate the quantified texture analysis procedure by using the FTFT-2D tool, we present a comparison of 2 HNSCC cases; 1 p53-negative and the other p53-positive (Fig 2). The corresponding local spectrum and radial ST amplitude plots are seen in Figs 3 and 4, respectively. The radial frequencies, 0.067–0.533 cycles/mm, were divided into 12 bands from the output of FTFT-2D. We used 3 texture values: the average, SD, and maximum values of the local spectrum. One hundred eight tumor MR imaging features were used for texture analysis (3 MR images × 12 frequency bands × 3 texture values). These tumor characteristics were fed into Waikato Environment for Knowledge Analysis (Weka, http://www.cs.waikato.ac.nz/ml/weka/packageMetaData/), a tool with a collection of machine-learning algorithms for data preprocessing, classification, and visualization.32 The dataset dimension reduction was performed by using the subset-size forward-selection algorithm in Weka. This algorithm is a commonly used feature-selection method33 to identify useful features. It starts with empty feature subsets and adds 1 subset of features at each step until the model prediction result does not improve any further. By doing so, important features are selected while redundant features are eliminated. The Bayesian network classifier34 was then used with the 10-fold stratified cross-validation in Weka to assess how well this predictive model would perform with the subset of the features being selected. The Bayesian network is a graphic model that learns the conditional probabilities among the features and applies the Bayes rule to calculate the posterior class probability for classification. Because the Bayesian network models the dependencies among all the features, it has proved to be effective in handling missing values in the dataset.35,36 Bayesian statistical methods can smooth the model so that all available data can be used for training; thus, this process efficiently addresses the overfitting issue.35,36

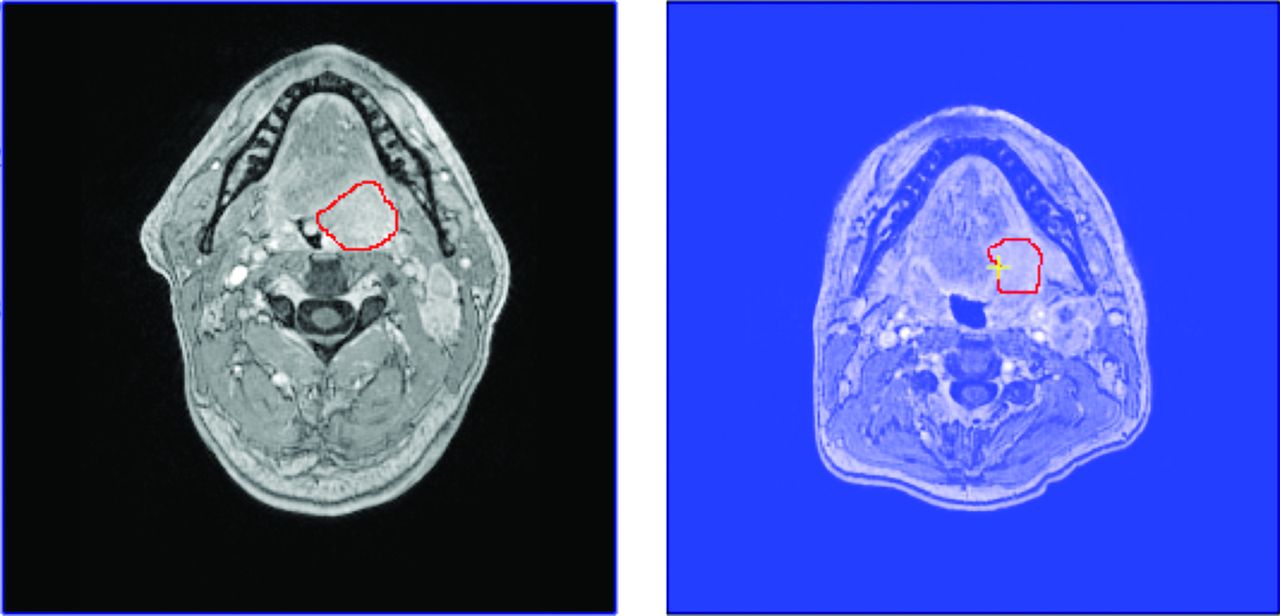
Tumors outlined on source MR images (Post-Gad T1WI) of 256 × 256 image size. The tumor in the left image is p53-negative. The tumor in the right image is p53-positive.

Graphic display of the average local spectrum for a p53-negative tumor (left image, black shades) and for a p53-positive tumor (right image, blue shades). The average amplitudes of ST at individual pixels were obtained by using FTFT-2D by using the same intensity range and scale for the 2 plots. Darker shades indicate higher ST amplitudes.

Radial ST amplitude plots for a p53-negative (black line) tumor and a p53-positive (blue line) tumor (the same tumor as in Fig 3).
Results
Of the 16 eligible patients with evaluable data, 8 tumors were p53-positive and 8 were p53-negative. The 2 groups (p53+ and p53−) had similar clinical characteristics (Table 1).
Clinical characteristicsa
After the texture quantification and machine-learning process, we found that 15 of the 108 independent variables were the most significant on the basis of the selected attributes by using the subset-size forward-selection algorithm. The 15 independent variables had classification scores ranging from 10% to 40%. Classification analysis was done on these 15 independent variables (Table 2); 62.5% of the instances were classified correctly (Table 3).
Discriminatory texture features
BN classification of p53 status
Further isolation of the high-classification percentage variables (removing the variables with a classification score of only 10%) yielded 7 significant variables (Table 4). These 7 variables correctly classified 81.3% of the tumors (Table 5). The agreement between predicted and true class (κ statistic) was 0.625 (where 0 indicates no agreement and 1 indicates complete agreement).
Discriminatory texture features
BN classification results
Discussion
We found that MR imaging texture features could significantly (P < .05) differentiate HNSCC tumors by p53 status by using 7 discriminatory radial-frequency bands with 81.3% accuracy. In comparison, a recent study of p53-status detection in gliomas by using MR imaging texture analysis showed an accuracy of 65.2%.37 Another recent study showed that MR imaging texture analysis could discriminate benign and malignant parotid tumors with an accuracy of up to 84.5%.38 An earlier study of methylation-status prediction in glioblastoma yielded accuracies of up to 93.2%.27 Other studies have shown that normal liver tissue could be differentiated from focal liver lesions with accuracies up to 88%39 and that normal bladder wall could be differentiated from bladder cancer with an accuracy of 87.0%.40
We found that texture features of the Post-Gad T1WI, T2WI, and ADC map were influential in the analysis. A possible physiologic explanation for this finding is the differences in vascularity between p53-positive and p53-negative tumors. Studies have shown a significantly higher microvessel count in p53-positive tumors than in p53-negative tumors,41 which has been associated with greater expression of vascular endothelial growth factor in p53-positive tumors.42,43 Differences in microvascularity would be expected to lead to differences in signal on Post-Gad T1WI (because of differences in contrast enhancement), on T2WI (because of differences in water content), and on the ADC map (because of differences in diffusivity).
At present, the clinical relevance of p53 status in HNSCC is mainly with regard to prognosis because a significant association between p53 status and survival in patients with HNSCC has been reported.13 In the future, p53 status in HNSCC may play a greater role in treatment selection (eg, specific vascular endothelial growth factor inhibitors may be more or less effective depending on the p53 status).
Image analysis has the potential to be complementary to tissue biopsy. On the one hand, tissue biopsy followed by immunohistochemistry analysis provides extensive genetic information, but only for a single anatomic location. On the other hand, image analysis provides biologic information such as p53 status over a large anatomic region, noninvasively. The ability to scan entire tumors, followed by quantitative analysis of image texture, may have advantages over more targeted biopsy-only techniques. Furthermore, MR imaging texture analysis has been shown to predict treatment response44 and therefore has the potential to allow better treatment choices and potentially lead to improved patient outcomes.
Our study is limited by its small sample size, but our results indicate that image analysis is a promising tool that deserves further investigation in patients with head and neck cancer.
Conclusions
MR imaging texture analysis could differentiate p53-positive and p53-negative HNSCC tumors with 81.3% accuracy. In association with information from a tissue biopsy, this technique has the potential for better treatment choices and influencing patient outcomes.
Footnotes
Drs Mitchell and Dort are co-senior authors on this project.
Disclosures: Joseph C. Dort—RELATED: Support for Travel to Meetings for the Study or Other Purposes: Ohlson Research Initiative,* Comments: As executive director of the Ohlson Research Initiative, I receive some support to travel to academic meetings and other conferences. The Ohlson Research Initiative is a program embedded within the Southern Alberta Cancer Institute within the Faculty of Medicine at the University of Calgary. Funding from the Ohlson Research Initiative is administered through the University of Calgary. *Money paid to the institution.
Indicates open access to non-subscribers at www.ajnr.org
References
- Received March 16, 2014.
- Accepted after revision June 15, 2014.
- © 2015 by American Journal of Neuroradiology


Jump to section
Related Articles
Cited By...
- Prediction of Tumor Grade and Nodal Status in Oropharyngeal and Oral Cavity Squamous-cell Carcinoma Using a Radiomic Approach
- MRI texture analysis as a predictor of tumor recurrence or progression in patients with clinically non-functioning pituitary adenomas
- Additional Clinical Value for PET/MRI in Oncology: Moving Beyond Simple Diagnosis
- MRI-Based Texture Analysis to Differentiate Sinonasal Squamous Cell Carcinoma from Inverted Papilloma