
Abstract
BACKGROUND AND PURPOSE: MR imaging has been widely used for the noninvasive evaluation of MS. Although clinical MR imaging sequences are highly effective in showing focal macroscopic tissue abnormalities in the brains of patients with MS, they are not specific to myelin and correlate poorly with disability. We investigated direct imaging of myelin using a 2D adiabatic inversion recovery ultrashort TE sequence to determine its value in assessing disability in MS.
MATERIALS AND METHODS: The 2D inversion recovery ultrashort TE sequence was evaluated in 14 healthy volunteers and 31 patients with MS. MPRAGE and T2-FLAIR images were acquired for comparison. Advanced Normalization Tools were used to correlate inversion recovery ultrashort TE, MPRAGE, and T2-FLAIR images with disability assessed by the Expanded Disability Status Scale.
RESULTS: Weak correlations were observed between normal-appearing white matter volume (R = –0.03, P = .88), lesion load (R = 0.22, P = .24), and age (R = 0.14, P = .44), and disability. The MPRAGE signal in normal-appearing white matter showed a weak correlation with age (R = –0.10, P = .49) and disability (R = –0.19, P = .31). The T2-FLAIR signal in normal-appearing white matter showed a weak correlation with age (R = 0.01, P = .93) and disability (R = 0.13, P = .49). The inversion recovery ultrashort TE signal was significantly negatively correlated with age (R = –0.38, P = .009) and disability (R = –0.44; P = .01).
CONCLUSIONS: Direct imaging of myelin correlates with disability in patients with MS better than indirect imaging of long-T2 water in WM using conventional clinical sequences.
ABBREVIATIONS:
- ANTs
- Advanced Normalization Tools
- EDSS
- Expanded Disability Status Scale
- GML
- long-T2 GM
- GMS
- short-T2 GM
- IR-UTE
- inversion recovery prepared UTE
- NAWM
- normal-appearing white matter
- UTE
- ultrashort TE
- WML
- long-T2 WM
- WMS
- short-T2 WM
MS is the most common demyelinating disease of the brain.1 Demyelination affects many aspects of neurologic function, including speech, balance, and cognitive awareness. Across time, this frequently leads to severe and irreversible clinical disability. MR imaging has been widely used for accurate diagnosis of MS, with current techniques focused on imaging the long-T2 water components in WM and GM.2⇓-4 MS lesions often appear hypointense with T1-weighted gradient recalled-echo sequences2 and hyperintense with T2-weighted FSE and T2-weighted FLAIR sequences.3 Active lesions can be highlighted with gadolinium-enhanced imaging.4 The magnetization transfer ratio has been used as an indirect marker of myelin disorder in regions of normal-appearing WM (NAWM).5 There are also several other advanced imaging techniques for indirect myelin imaging via assessment of myelin water, such as multicomponent T2 or T2* analysis6,7 and direct visualization of components with short transverse relaxation times.8,9
While conventional MR imaging sequences are highly effective in detecting focal macroscopic brain tissue abnormalities, they are not specific for pathologic substrates of MS lesions such as demyelination and remyelination, and they may not correlate well with patients’ neurologic deficits. Current MR imaging techniques correlate only modestly with disability assessed by the Expanded Disability Status Scale (EDSS).10⇓⇓⇓⇓-15 The total lesion load showed statistically significant-but-weak correlations with the EDSS score in several large-scale studies (R = 0.1–0.3).10⇓-12 Composite scores including relaxation times of different tissues and/or volumetric measures generally correlate more strongly with the EDSS score, with a maximum observed correlation of R = 0.34 (P < .001).13 Lesions seen with gadolinium-enhanced imaging are only moderately correlated with disability in the first 6 months and are not predictive of changes in the EDSS score in the subsequent 1 or 2 years.14 A large-scale multicenter study reported very limited correlation between the EDSS score and normalized brain volume (R = –0.18), cross-sectional area (R = –0.26), magnetization transfer ratio of whole-brain tissue (R = –0.16), and GM (R = –0.17).15
The poor performance of conventional MR imaging sequences in assessing disability highlights the need for novel MR imaging techniques that can directly image myelin lipid and enable direct assessment of both myelin damage and repair. However, myelin has an extremely short transverse relaxation time and is not directly detectable with conventional MR images, which typically have TEs of several milliseconds or longer. Ultrashort TE (UTE) sequences can directly detect signal from myelin with ultrashort T2 (ie, excluding water with longer T2s).16⇓⇓⇓⇓-21 In this study, we describe imaging of WM using a 2D adiabatic inversion recovery prepared UTE (IR-UTE) sequence in healthy volunteers and patients with MS and evaluate its performance in assessing disability in patients with MS compared with 2 conventional clinical sequences.
MATERIALS AND METHODS
Imaging Subjects
A total of 31 patients with MS (21 women; 26–75 years of age; mean, age 55.8 years) were recruited. All patients underwent a complete neurologic examination with an EDSS score at the time of MR imaging by a neurologist with >30 years of experience. Another 14 healthy volunteers (5 women; 24–56 years of age; mean age, 37.3 years) were also recruited for comparison. Institutional review board approval from Human Research Protections Program at University of California, San Diego was obtained, and informed consent was collected from each subject.
Pulse Sequence
A 2D IR-UTE sequence (Fig 1A) was implemented on a 3T clinical MR imaging scanner (MR750; GE Healthcare). The sequence uses half sinc radiofrequency pulses (duration = 472 µs, bandwidth =2.7 kHz) for excitation.19 Two excitations were performed with the gradient polarity reversed on the second occasion. The data from these excitations were added to produce a single radial line of k-space. After re-gridding, we reconstructed the raw data by inverse Fourier transformation. Bipolar slice-selective gradients and readout gradients were used to help reduce eddy currents.19
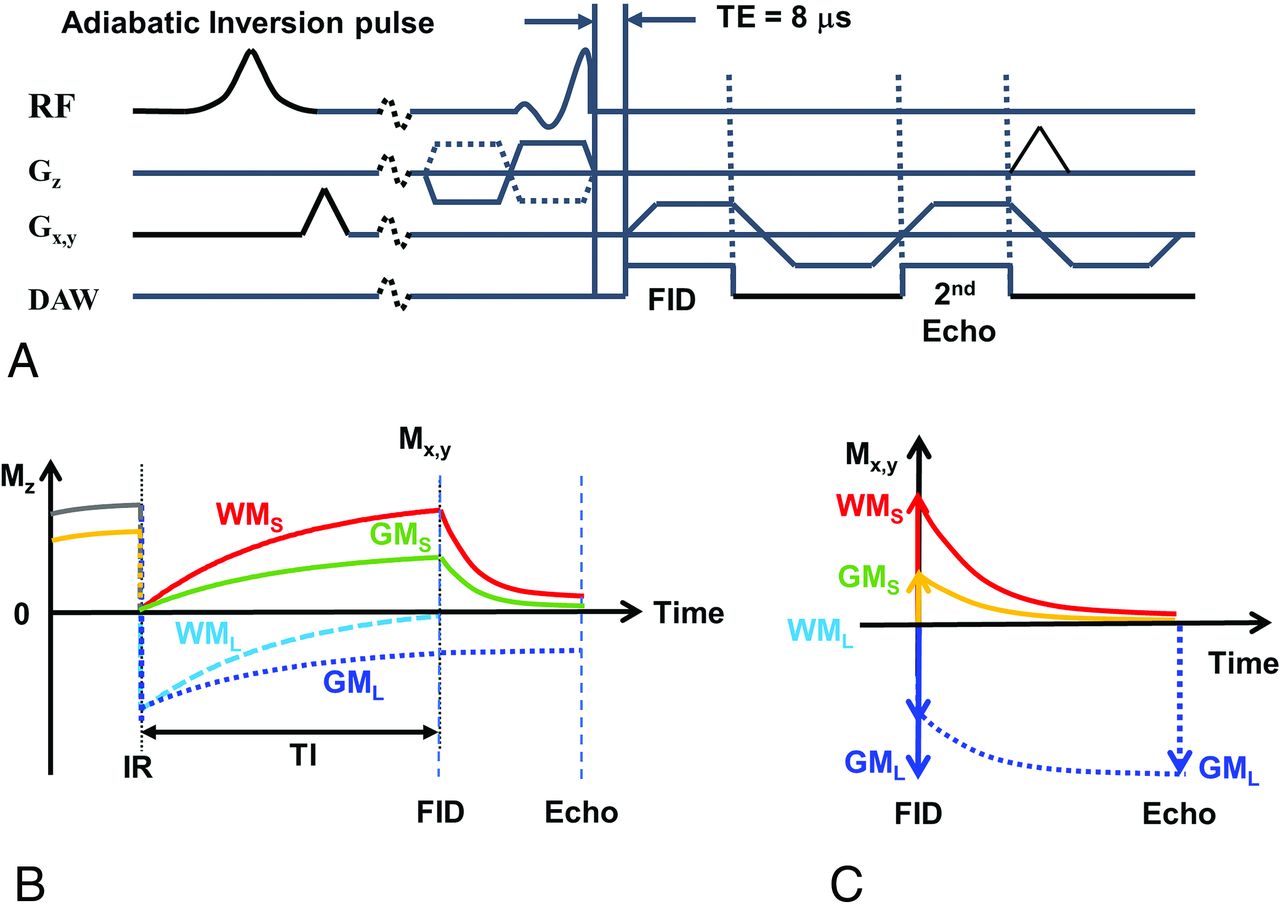
The 2D IR-UTE sequence (A) and contrast mechanism with adiabatic inversion recovery (B) and echo subtraction (C). At TI, WM signal comes only from WMS. In GM, there is a cancellation between positive GMS and negative GML longitudinal magnetizations at TI, which reduces the net transverse magnetization in GM after the excitation pulse. At the second echo, WMS and GMS signals both decay to zero or near zero, but the GML transverse magnetization is essentially unchanged. Subtraction of the second echo from the first leads to a positive signal for myelin in WM, but a negative signal for myelin in GM. This result creates very high contrast between the myelin in WM and GM (WMS = short-T2 WM, WML = long-T2 WM, GMS = short-T2 GM, GML = long-T2 GM).
While a UTE sequence can detect signal from myelin protons, the major challenge is the much higher signal obtained from water in long-T2 WM and long-T2 GM (WML and GML in Fig 1).16 Because myelin represents only a small fraction of the total UTE signal, it is essential to suppress the WML signal to generate specific images of myelin in WM. To do this, a relatively long adiabatic fast-passage inversion pulse (Silver-Hoult pulse, duration = 8.64 ms) was used to invert the longitudinal magnetization of WML and GML.16⇓⇓⇓⇓-21 The transverse magnetization of myelin (WMS and GMS in Fig 1) has an extremely short T2* and was saturated during the long adiabatic inversion pulse.22 Data acquisition was started at the TI necessary for the inverted longitudinal magnetization of WML to reach its null point, leaving signals from myelin and other long-T2 tissues (eg, GML) to be detected by a dual-echo UTE acquisition. The second echo acquired signals from non-nulled long-T2 tissues such as GML but did not detect signal from myelin because the signal from this tissue decays to zero by the second TE. Subtraction of the second echo image from the first one provided selective imaging of the myelin in WM. Figure 1B describes this contrast mechanism. Note that on the subtracted image using magnitude reconstruction, myelin in WM has a positive signal, while ultrashort T2 components, including myelin in GM, have a negative signal (Fig 1C).
Image Acquisitions
Clinical 3D MPRAGE, 3D T2-FLAIR, and 2D IR-UTE sequences were performed for all 45 subjects. The 3D MPRAGE sequence used the following parameters: FOV = 220 × 220 × 160 mm3, bandwidth = 83.4 kHz, flip angle = 12°, matrix = 256 × 256 × 136, TE = 3.2 ms, TR = 8.2 ms, TI = 450 ms, acceleration factor = 4, scan time = 4 minutes 12 seconds. The 3D T2-FLAIR sequence used the following parameters: FOV = 256 × 256 × 256 mm3, bandwidth = 83.4 kHz, flip angle = 90°, matrix = 256 × 256 × 256, TE = 116.5 ms, TR = 7600 ms, TI = 2162 ms, acceleration factor = 4, scan time = 6 minutes 54 seconds. The 2D IR-UTE sequence used the following parameters: FOV = 240 × 240 mm2, section thickness = 4 mm, bandwidth = 256 kHz, flip angle = 60°, matrix = 256 × 256, number of projections = 131, sampling points per projection = 192, TR = 1500 ms, TI = 425 ms, dual-echo with TEs of 8 µs and 2.3 ms, scan time = 5 minutes 5 seconds. A 12-channel brain coil was used for signal reception.
Image Analysis
For image analysis, automatic brain segmentation codes were written in R programing language (http://www.r-project.org/) with Advanced Normalization Tools (ANTs; http://stnava.github.io/ANTs/).23 The codes processed the 3D MPRAGE, 3D T2-FLAIR, and 2D IR-UTE images for all 45 subjects. The MPRAGE and T2-FLAIR images were processed with an N4 bias correction and then normalized (or registered) to a standard domain provided by the ICBM 152 brain template (https://www.mcgill.ca/bic/software/tools-data-analysis/anatomical-mri/atlases/icbm152lin)24 using an affine transform followed by a deformable transform. Next, MPRAGE images of brain tissue were segmented into GM, WM, and CSF using a multivariate 3-class segmentation.25 For the 2D IR-UTE sequence, the echo-subtracted image was input to a similar-but-simplified framework, with N4 bias correction and 3-class tissue segmentation and without spatial normalization.
The raw segmentation map from ANTs was postprocessed using Matlab 2017b (MathWorks). The initial WM map from MPRAGE and T2-FLAIR was refined by removing regions with T2 lesions on the basis of the upper threshold set by the weighted sum of minimum and maximum signals in WM on T2-FLAIR images (weighting factors of 0.8 and 0.2). A radiologist with >15 years of experience manually refined the initial WM map from 2D IR-UTE by segmenting out the hypointense lesions. This step produced the final NAWM maps. All NAWM maps were manually inspected by a researcher with 9 years of experience in MR imaging research and a radiologist with 15 years of experience.
Statistical Analysis
All statistical analyses were conducted using Matlab 2017b. The mean NAWM signal was calculated for all subjects for MPRAGE, T2-FLAIR, and 2D IR-UTE. Effects of flip angle, loading, analog-digital conversion, and reconstruction scaling were automatically compensated for by calibrating a transmit gain in prescan and by performing signal rescaling on the basis of receiver gains in image reconstruction to directly compare NAWM signal among different subjects.
The NAWM signal was compared in the 2 groups of healthy controls (n = 14) and patients with MS (n = 31) using a 2-tailed Mann-Whitney-Wilcoxon test, with a significance level set to .05. The Spearman correlation was calculated between the NAWM signal and age in all subjects (n = 45). The correlation between the NAWM signal and the EDSS scores in patients with MS was also calculated. In addition, NAWM volume (relative volume of NAWM to the total brain) and lesion load (relative volume of T2 lesions to WM) were calculated. Correlations between calculated NAWM volume and the EDSS score as well as between lesion load and the EDSS score in patients were calculated.
RESULTS
Figure 2 shows results with MPRAGE (Fig 2A–C) and T2-FLAIR images (Fig 2D–F) in 3 representative subjects, a healthy volunteer (a 49-year-old man: upper row) and 2 patients with MS with an EDSS score of 2 (a 56-year-old man: middle row) and with an EDSS score of 6 (a 46-year-old woman: lower row). The NAWM signal map from MPRAGE shows a marked reduction in signal in the patient with MS with the higher EDSS score of 6 (lower row).

MPRAGE (A, B, and C, first column) and T2-FLAIR (D, E, and F, third column) images with their corresponding NAWM maps shown to the right of them (second and fourth columns, respectively) in a healthy volunteer (a 49-year-old man: A and D, upper row), a patient with MS with an EDSS score of 2 (a 56-year-old man: B and E, middle row), and a patient with MS with an EDSS score of 6 (a 46-year-old woman: C and F, lower row).
Figure 3 shows the results with the IR-UTE sequences in 3 representative subjects: a healthy volunteer (a 49-year-old man: Fig 3A), a patient with MS with an EDSS score of 2 (a 56-year-old man: Fig 3B), and a patient with MS with an EDSS of 6 (a 46-year-old woman: Fig 3C). The UTE images at TE = 8 µs (first column) show myelin signal present in the NAWM region. This decays to zero, or near zero, at the second TE of 2.3 ms due to the short T2* of myelin (second column). The long-T2 components in WM and GM are suppressed on echo subtraction, producing high-contrast myelin-specific images (third column). The signal on the segmented NAWM maps (fourth column) in the patient with MS with the higher EDSS score of 6 (Fig 3C) is much lower than that of the healthy volunteer (Fig 3A) and the patient with MS with an EDSS score of 2 (Fig 3B).

IR-UTE images and NAWM map. These show first-echo IR-UTE images (TE = 8 µs) in the first column, second-echo images (TE = 2.3 ms) in the second column, and echo-subtraction images in the third column with the corresponding NAWM maps in the fourth column for a healthy volunteer (a 49-year-old man: A, upper row), a patient with MS with an EDSS score of 2 (a 56-year-old man: B, middle row), and a patient with MS with an EDSS score of 6 (a 46-year-old woman: C, lower row). The 2D IR-UTE images are in the native domain, which is different from the MPRAGE and T2-FLAIR images, which are in the normalized template domain.
Figure 4 shows the scatterplots between NAWM volume and the EDSS score (Fig 4A) and between lesion load and the EDSS score (Fig 4B). The NAWM volume and lesion load were calculated from the segmented tissue maps obtained with the clinical sequences. Both the NAWM volume and the lesion load show low correlations with the EDSS score, which did not reach significance (R = –0.03, P = .88 and R = 0.22, P = .24, respectively).

Scatterplots and the corresponding Spearman correlations between NAWM volume and the EDSS score (A), and between lesion load and the EDSS score (B). Both NAWM volume and lesion load show only low correlations with the EDSS score (R = –0.03, P = .88, and R = 0.22, P = .24, respectively).
The mean NAWM signal in the MPRAGE images was 3602.6 (SD, 498.1) in the control group and 2676.7 (SD, 877.8) in the MS group. The mean NAWM signal on the T2-FLAIR images was 1267.7 (SD, 184.2) in the control group and 1184.8 (SD, 218.4) in the MS group. The mean myelin signal in NAWM obtained with the IR-UTE image was 169.6 (SD, 39.5) in the control group and 136.3 (SD, 39.2) in the MS group. Figure 5 shows boxplots and the Mann-Whitney-Wilcoxon test between healthy controls and patients with MS. Both the MPRAGE (Fig 5A) and the IR-UTE (Fig 5C) NAWM maps show a significant difference in the 2 groups with P values of .003 and .02, respectively, while the T2-FLAIR NAWM maps (Fig 5B) show no significant difference (P = .23).

Mann-Whitney-Wilcoxon tests between the control (n = 14) and MS groups (n = 31) for NAWM signal on MPRAGE (A), T2-FLAIR (B), and IR-UTE (C) maps. The MPRAGE and IR-UTE maps show statistically significant differences between the 2 groups with P values of .003 and .02, respectively. The T2-FLAIR maps show no significant difference between the 2 groups (P = .23). In the boxplots, red and black horizontal lines represent median and minimum/maximum values. The upper and lower edges of the blue boxes indicate the 75th and 25th percentiles, respectively.
Figure 6 shows scatterplots of NAWM signals and subject age on MPRAGE (Fig 6A), T2-FLAIR (Fig 6B), and IR-UTE (Fig 6C) maps in the healthy controls and patients with MS. The MPRAGE and T2-FLAIR maps show weak correlations, which did not reach significance (R = –0.10, P = .49 and R = 0.01, P = .93, respectively). The IR-UTE map shows a moderate negative correlation (R = –0.38, P = .009).
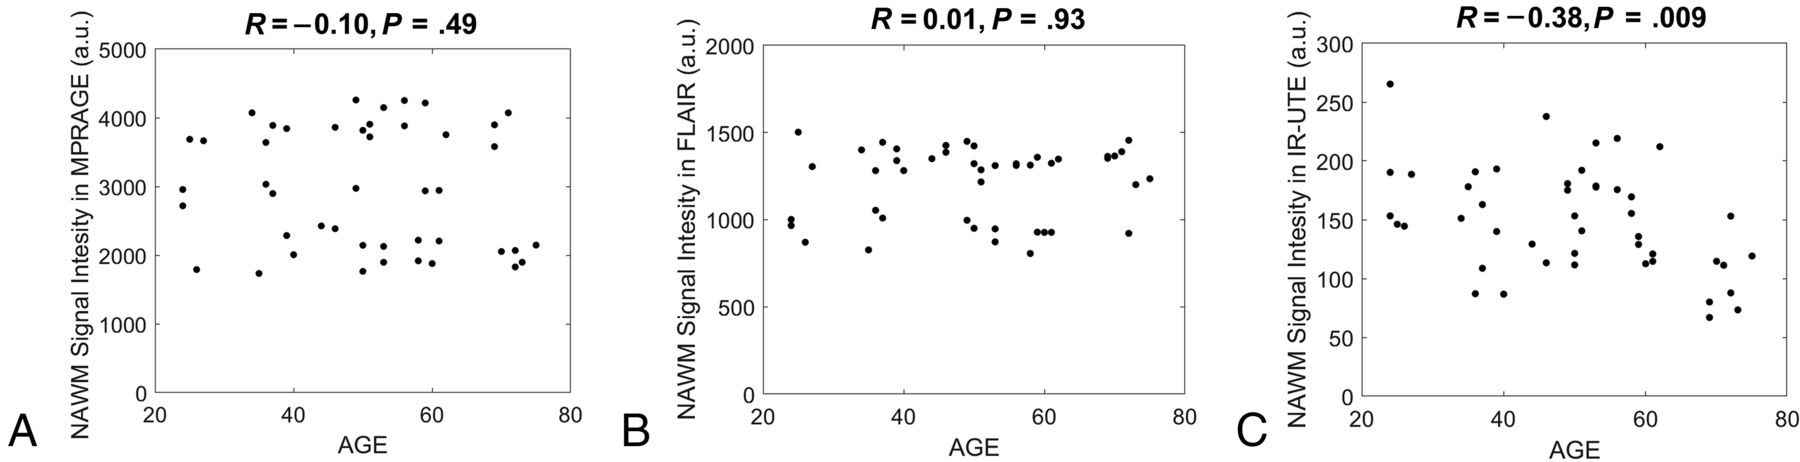
Scatterplots between NAWM signal and age on MPRAGE (A), T2-FLAIR (B), and IR-UTE (C) maps with the all subjects, including both the healthy controls and patients with MS. A weak correlation is seen on the MPRAGE (R = –0.10, P = .49) and T2-FLAIR (R = 0.01, P = .93) maps. The IR-UTE maps show a much larger negative correlation with the subject’s age (R = –0.38, P = .009). a.u. indicates arbitrary units.
Figure 7A–C shows scatterplots between the NAWM signal and EDSS score for MPRAGE (Fig 7A), T2-FLAIR (Fig 7B), and IR-UTE (Fig 7C). The MPRAGE data show a weak negative correlation with the EDSS score, which did not reach significance (R = –0.19, P = .31), and T2-FLAIR shows a weak positive correlation with the EDSS score, which did not reach significance (R = 0.13, P = .49). The IR-UTE data show a much larger negative correlation with the EDSS score (R = –0.44, P = .01). Figure 7D shows the scatterplot between the EDSS score and the patient’s age. There is a weak positive correlation that did not reach significance (R = 0.14, P = .44).
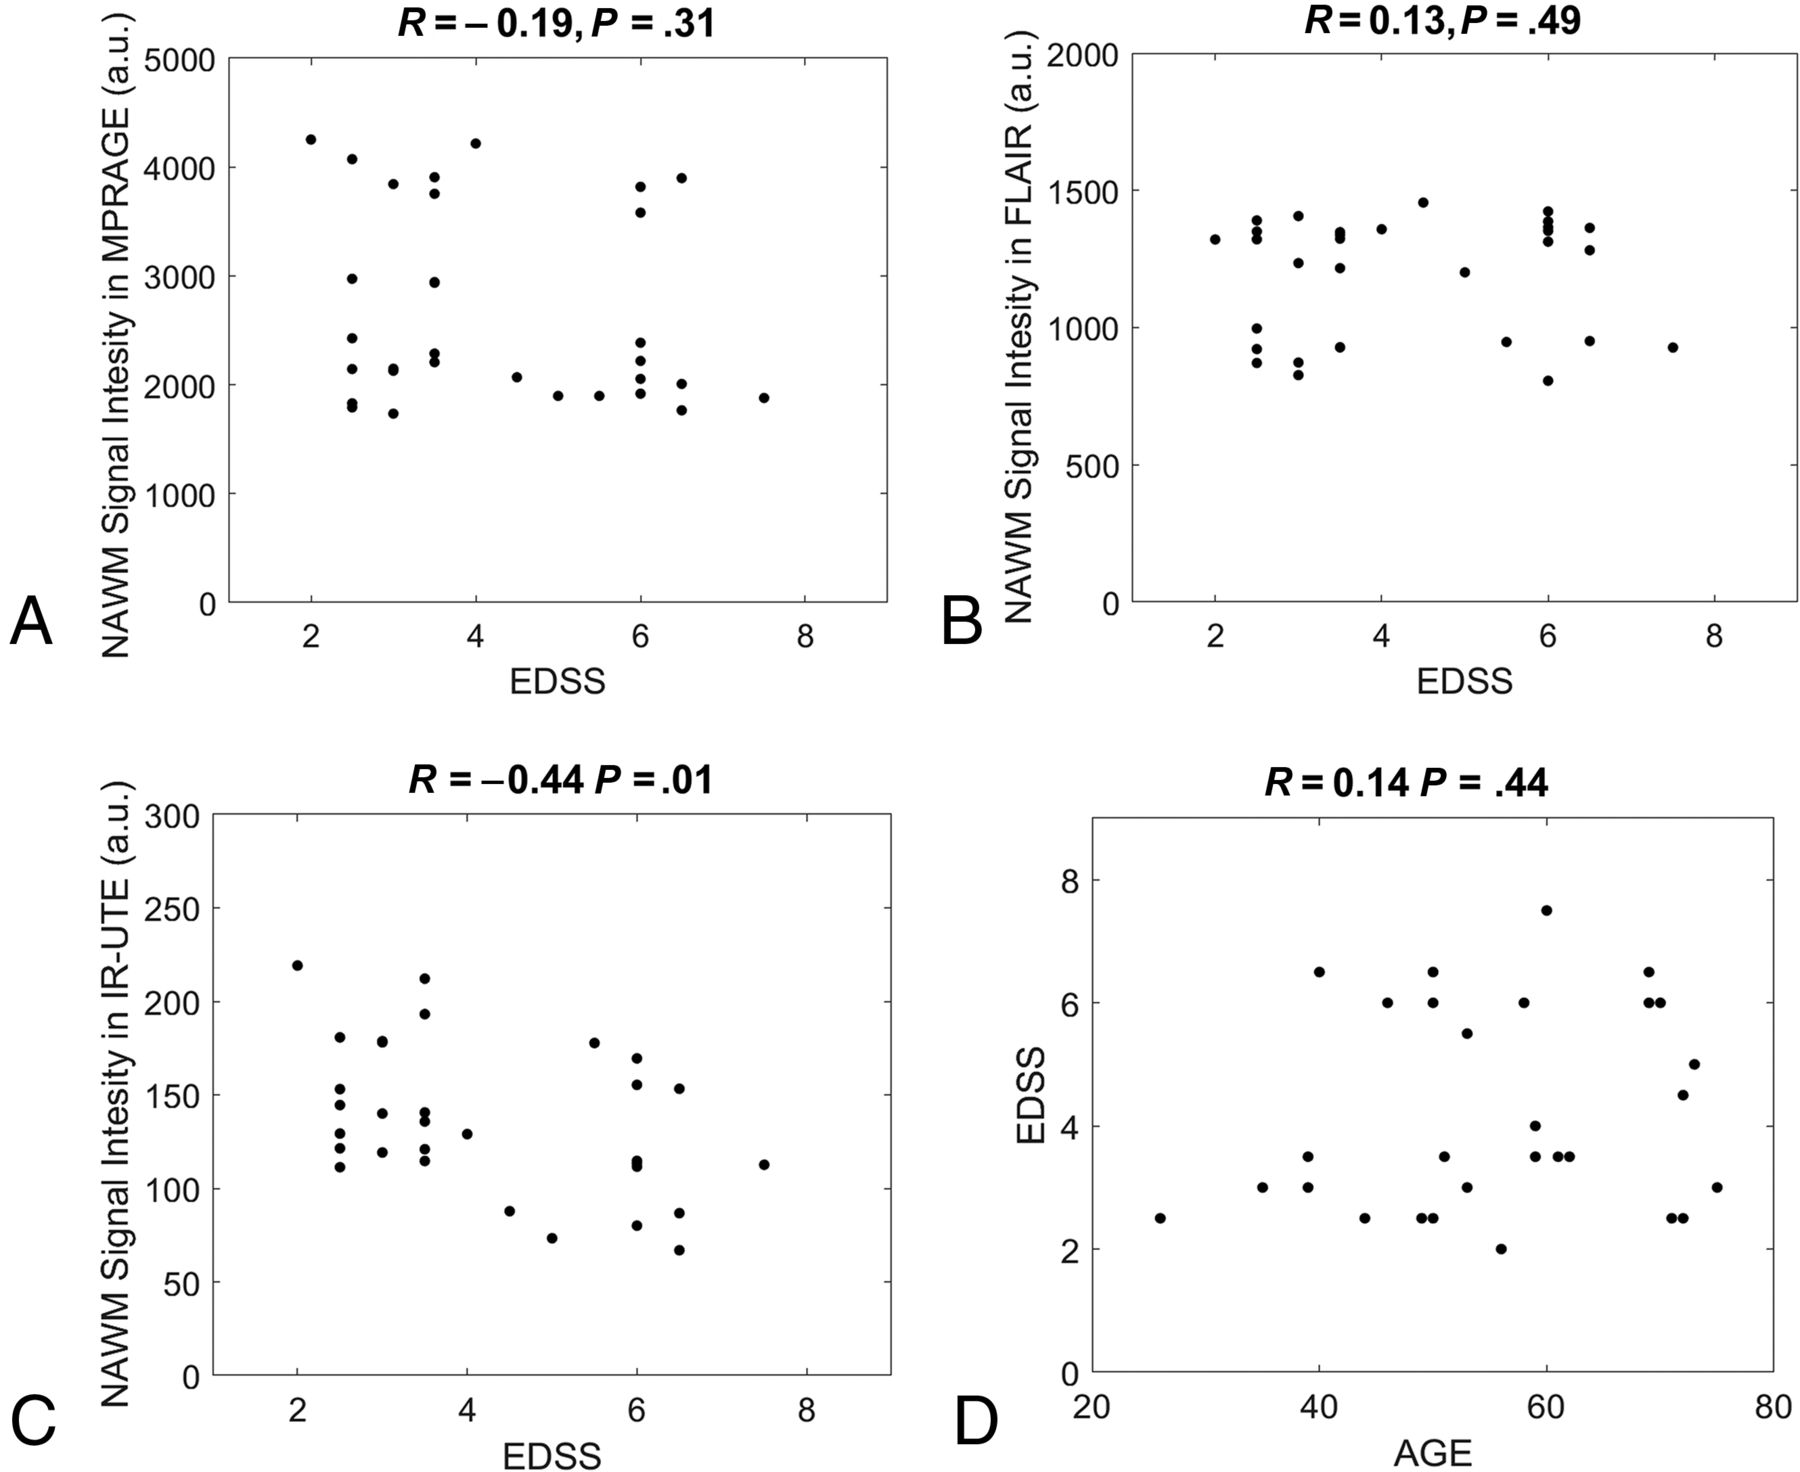
Scatterplots between NAWM signal and the EDSS scores with MPRAGE (A), T2-FLAIR (B), and IR-UTE (C) maps. Weak correlations are observed with the MPRAGE (R = –0.19, P = .31) and the T2-FLAIR (R = 0.13, P = .49) maps. The IR-UTE maps provide a larger negative correlation (R = –0.44, P = .01). A weak positive correlation is observed between the EDSS scores and patients’ ages (R = 0.14, P = .44) (D). a.u. indicates arbitrary units.
DISCUSSION
This is the first study to demonstrate a significant correlation between IR-UTE-based direct MR imaging of myelin and disability in MS assessed by the EDSS score. MPRAGE and T2-FLAIR provided a low correlation with the EDSS score, consistent with the literature.10⇓⇓⇓⇓-15 NAWM volume and lesion load also correlated poorly with the EDSS score. The novel IR-UTE sequence provided a much higher correlation than the clinical sequences. The IR-UTE signal reduction in NAWM with an increase in the EDSS score is consistent with increasing demyelination in NAWM as patient disability worsens. A moderate negative correlation was observed between the NAWM signal and the patient's age on IR-UTE, which implies that IR-UTE also detects age-related myelin reduction. The overall myelin change correlated with the EDSS score observed with IR-UTE may also include a contribution from age-related myelin reduction. However, a much weaker correlation was observed between the patient’s age and the EDSS score, implying that disability related to disease is the dominant factor observed in this study.
Myelination is dynamically regulated throughout life. It is disrupted in a variety of neurologic conditions including MS, which is characterized by the formation of focal or global demyelinating lesions disseminated in time and space. MS likely affects NAWM as well as GM. These are frequently associated with neurologic deficits. It is very difficult or impossible to separate demyelination and remyelination with conventional MR imaging sequences at different phases of MS. With the advent of IR-UTE sequences, it may be possible to separate demyelination from remyelination and dynamically monitor myelin changes with time. However, more validation studies are still needed.
It has been reported in the literature that colocalized iron may also affect MR imaging contrast in a human brain.26,27 The proposed IR-UTE method only resolves signal from myelin with ultrashort T2* decay. T2* of iron depends on the concentration, but both normal and abnormal brains show iron levels below ∼0.2 ppm,28 in which T2* is expected to be much longer than that of myelin. Quantitative susceptibility mapping can be used to assess iron. Combining quantitative susceptibility mapping with UTE may allow higher detection sensitivity to a broader range of iron.29,30
A limitation of this study is that the 2D IR-UTE sequence is based on half-pulse radiofrequency excitations and the use of gradients for section selection, which result in eddy currents causing distortions in the section profile. Some simple calibration methods31 are likely to improve the robustness of this technique. The results in this study may be improved by the use of a novel 3D-IR-UTE sequence, which does not require 2D section selection.32,33 The 3D technique provides volumetric imaging of myelin with reduced sensitivity to eddy currents.
There are other limitations of this study. First, the number of patients with MS was relatively low, possibly reducing the statistical power in the analyses. Second, T1 variation in NAWM may compromise the adiabatic nulling of WM water signal, which is a major limitation for single IR-based UTE myelin imaging techniques.16⇓⇓⇓⇓-21 More advanced techniques, such as the sliding window technique or complex echo subtraction can help suppress residual water signal contamination.32,33 Third, myelin in GM was not investigated because it has an even lower myelin proton density than WM, making it more difficult to detect. GML has a longer T1 than in WM, making it difficult to suppress both WML and GML simultaneously using a single TI. More advanced techniques are needed for accurate and quantifiable imaging of myelin in GM.
CONCLUSIONS
The correlation between the EDSS score and direct imaging of myelin in WM demonstrated in this study may provide a link between the pathologic substrate that characterizes MS and patients’ clinical statuses. This may lead to more specific monitoring of the degree to which remyelination can be enhanced with treatment and assessment of how much this ameliorates disability.
Footnotes
This work was supported by grants from the National Institutes of Health (1R01 NS092650, T32 EB005970-09) and GE Healthcare.
Disclosures: Soudabeh Fazeli—RELATED: Grant: National Institutes of Health, Comments: As part of my training in a clinician-scientist radiology residency program, I am supported by the National Institutes of Health T32 EB005970-09. Jiang Du—RELATED: Grant: National Institutes of Health, Comments: This work was supported by National Institutes of Health grant 1R01NS092650.* *Money paid to the institution.
Indicates open access to non-subscribers at www.ajnr.org
References
- Received May 17, 2020.
- Accepted after revision November 16, 2020.
- © 2021 by American Journal of Neuroradiology


Jump to section
Related Articles
Cited By...
- No citing articles found.