
Article Figures & Data
Figures
- Fig 1.
71-year-old woman with brain metastasis from ovarian cancer.
A, FLAIR image shows a high-signal-intensity necrotic tumor with prominent peritumoral edema. Irregular ringlike enhancement was seen on the T1-weighted image (not shown).
B, ADC map shows the tumor (1) and adjacent edema (2) have higher signal intensity than does the cerebellar parenchyma. Calculated ADC value (83 × 10−3 mm2/s), which is significantly lower than that of low-grade astrocytomas and nonastrocytic gliomas, helps to differentiate metastasis from low-grade malignant tumors, but not from high-grade ones.
C, MR spectrum shows low NAA level (NAA/Cho = 0.92) with prominent lactate and lipid peaks (lipid/Cr = 0.58). High lipid/Cr ratio helps to differentiate metastasis from other primary malignant tumors.
- Fig 2.
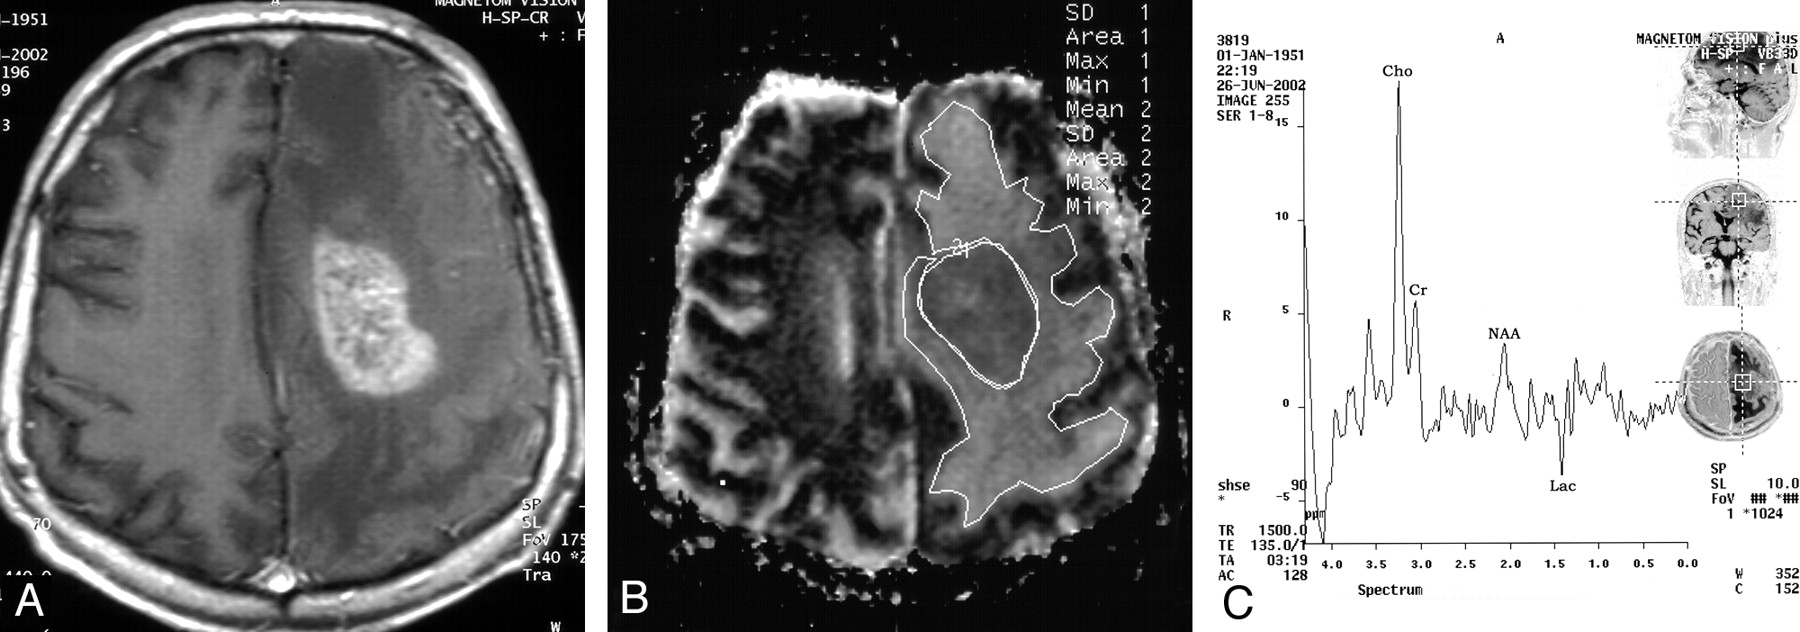
51-year-old man with high-grade astrocytoma in the left periventricular white matter.
A, T1-weighted image shows heterogeneous contrast enhancement of the tumor with extensive peritumoral edema.
B, ADC map shows that the tumor (1) and adjacent tumor (2) nearly isointense with cerebral white matter (2). This tumor’s calculated ADC value is 87 × 10−3 mm2/s, which helps to differentiate it from low-grade malignant tumors, but not from metastasis.
C, Proton MR spectrum shows prominent decrease in NAA and increase in Cho (NAA/Cho = 0.19) and lactate (lactate/Cr = 0.28). Absence of prominent lipid peak with low lipid/Cr ratio helps to differentiate this tumor from metastasis.
- Fig 3.
25-year-old woman with low-grade astrocytoma in right thalamus and subsequent invasion of the left thalamus via the massa intermedia.
A, FLAIR image shows hyperintense tumor without significant edema. Faint enhancement was seen on the T1-weighted image (not shown).
B, ADC map shows that the tumor (1) has slightly higher signal intensity than that of normal thalamus. Calculated ADC value of 110 × 10−3 mm2/s indicates low-grade malignant tumor, but this was not useful to differentiate it from other low-grade malignant tumors.
C, MR spectrum shows decreased NAA/Cho ratio (0.66) with prominent lactate peak. This is a common finding for primary malignant brain tumors, but does not allow us to make a subtype classification.
- Fig 4.
22-year-old man with oligodendroglioma involving the left temporal lob and basal ganglia region.
A, FLAIR image shows hyperitense mass without significant edema. No contrast enhancement was present on the T1-weighted image (not shown).
B, ADC map shows that the tumor (1) has a heterogeneous pattern and higher signal intensity than that of the contralateral basal ganglia region. Its calculated ADC value is 118 × 10−3 mm2/s and strongly suggests low-grade malignant or benign tumor.
C, MR spectrum shows mild decrease in both NAA and Cho (NAA/Cho = 0.72) with small lactate peak. This spectrum helps to differentiate this tumor from benign tumors but is not useful to distinguish the histologic subtypes.
- Fig 5.
52-year-old woman with meningioma located in the left prepontine cistern.
A, T1-weighted image shows a well-demarcated, strongly enhanced extraaxial mass.
B, ADC map shows that the tumor (1) has slightly higher signal intensity than that of adjacent brain parenchyma. ADC value of 109 × 10−3 mm2/s does not help to distinguish this tumor from other benign lesions.
C, MR spectrum shows decreased NAA/Cho ratio (0.76) with prominent lipid and alanin peaks at 1.5 ppm (alanin/Cr = 0.68). Prominent alanin peak with low NAA and high Cho levels helps to distinguish meningioma from other tumor groups.


Tables
Tumor Group Histologic Diagnosis No. of Patients (n = 49) Malignant (n = 36) High-grade astrocytoma 8 High grade (n = 16) Glioblastoma multiforme 3 Grade 3 astrocytoma 5 Metastasis 8 Lung cancer 4 Breast cancer 2 Ovarian cancer 1 Condromyxoid sarcoma 1 Low grade (n = 20) Low-grade astrocytoma (grade 2) 12 Nonastrocytic gliomas 8 Oligodendroglioma 6 Epandimoma 2 Benign (n = 13) Meningioma 7 Dysembryoplastic neuroepithelial tumor 3 Tuberculoma 3 Parameter Malignant (n = 36) Benign (n = 13) Control (n = 15) F Score* P Value* Mean SD Mean SD Mean SD NAA/Cho 0.65 0.28 1.12 0.59 1.35 0.14 25.186 .000† NAA/Cr 1.05 0.38 1.42 0.51 1.68 0.28 15.310 .000† NAA/Cho + Cr 0.39 0.15 0.61 0.25 0.75 0.01 28.061 .000† Cho/Cr 1.74 0.61 1.45 0.65 1.24 0.16 4.696 .013§ Lactate/Cr 0.28 0.22 0.01 0.14 0.00 0.00 16.632 .000| Lipid/Cr 0.36 0.28 0.29 0.19 0.16 0.01 3.779 .028§ Lactate/lipid 0.85 0.78 0.18 0.43 0.00 0.00 12.291 .000¶ Alanin/Cr 0.00 0.00 0.21 0.25 0.00 0.00 18.451 .000# ADCT 102.81 17.94 107.69 8.05 79.37 4.10 18.018 .000** ADCPT 158.90 32.87 94.23 29.25 79.37 4.10 53.419 .000†† Note.—ADCT indicates calculated ADC values from tumoral area; ADCPT, calculated ADC values from peritumoral area; NS, no significance.
* F score and P values were obtained by using Tukey pairwise post hoc test.
† benign > malignant, control > malignant P < .001; control > benign P < .05.
‡ control > malignant P < .001; benign > malignant P < .05; otherwise NS.
§ malignant > control P < .05; otherwise NS.
| malignant > benign, malignant > control P ≤ .001; otherwise NS.
¶ malignant > control P < .001; malignant > benign P < .05; otherwise NS.
# benign > malignant, benign > control P < .001; otherwise NS.
** benign > control, malignant > control P < .001; otherwise NS.
†† malignant > benign, malignant > control P < .001; otherwise NS.
Parameter High Grade (n = 16) Low Grade (n = 20) Benign (n = 13) Control (n = 15) F Score* P Value* Mean SD Mean SD Mean SD Mean SD NAA/Cho 0.65 0.30 0.66 0.27 1.12 0.59 1.35 0.14 16.520 .000† NAA/Cr 1.03 0.35 1.05 0.41 1.42 0.51 1.68 0.28 10.051 .000† NAA/Cho + Cr 0.39 0.16 0.39 0.14 0.61 0.25 0.75 0.01 18.406 .000† Cho/Cr 1.79 0.69 1.71 0.56 1.45 0.65 1.24 0.16 3.159 .031‡ Lipid/Cr 0.49 0.34 0.25 0.17 0.29 0.19 0.16 0.01 6.814 .000§ Lactate/Cr 0.36 0.21 0.22 0.22 0.01 0.14 0.00 0.00 13.589 .000| Lactate/lipid 0.93 0.84 0.78 0.74 0.18 0.43 0.00 0.00 8.292 .000¶ Alanin/Cr 0.00 0.00 0.00 0.00 0.21 0.28 0.00 0.00 12.099 .000# ADCT 87.16 10.41 115.33 11.67 107.69 8.05 79.37 4.10 54.741 .000** ADCPT 148.56 30.86 167.18 32.82 94.23 29.23 79.37 4.10 38.774 .000†† Note.—ADCT indicates calculated ADC values from tumoral area; ADCPT, calculated ADC values from peritumoral area; NS, no significance.
* F score and P values were obtained by using Tukey pairwise post hoc test.
† control > high-grade, control > low-grade P < .001; benign > low-grade, benign > high-grade P < .05; otherwise NS.
‡ high-grade > control P < .05; otherwise NS.
§ high-grade < control P < .001; high-grade > low-grade P < .05; otherwise NS.
| high-grade > benign, high-grade > control P < .001; low-grade > benign, low-grade > control P < .05; otherwise NS.
¶ high-grade > control P = .001; high-grade > benign, low-grade > benign, low-grade > control P < .05; otherwise NS.
# benign > high-grade, benign > low-grade, benign > control P < .001; otherwise NS.
** low-grade > high-grade, benign > high-grade, benign > control, low-grade > control P < .001; otherwise NS.
†† high-grade > benign, high-grade > control, low-grade > benign, low-grade > control P < .001; otherwise NS.
Parameter HGA (n = 8) MET (n = 8) LGA (n = 12) NAG (n = 8) MNG (n = 7) DNET (n = 3)* GRN (n = 3)* F Score† P Value† Mean SD Mean SD Mean SD Mean SD Mean SD Mean SD Mean SD NAA/Cho 0.55 0.36 0.74 0.20 0.67 0.25 0.64 0.31 0.85 0.35 1.98 0.23 0.90 0.49 1.105 NS‡ NAA/Cr 0.96 0.40 1.11 0.31 1.04 0.44 1.08 0.41 1.42 0.61 1.71 0.26 1.14 0.37 1.240 NS‡ NAA/Cho + Cr 0.34 0.18 0.44 0.11 0.40 0.14 0.39 0.14 0.52 0.20 0.92 0.12 0.50 0.22 1.364 NS‡ Cho/Cr 2.05 0.85 1.53 0.35 1.61 0.45 1.85 0.70 1.76 0.74 0.86 0.05 1.35 0.26 0.910 NS‡ Lipid/Cr 0.22 0.14 0.76 0.25 0.19 0.10 0.33 0.21 0.37 0.22 0.25 0.06 0.13 0.03 13.210 .000§ Lactate/Cr 0.27 0.26 0.44 0.11 0.16 0.19 0.32 0.25 0.00 0.00 0.00 0.00 0.00 0.00 3.691 .012| Lactate/lipid 1.27 1.12 0.60 0.11 0.78 0.85 0.79 0.60 0.33 0.56 0.00 0.00 0.00 0.00 1.619 NS Alanin/Cr 0.00 0.00 0.00 0.00 0.00 0.00 0.00 0.00 0.39 0.21 0.00 0.00 0.00 0.00 32.104 .000¶ ADCT 89.44 12.98 84.88 7.22 112.58 9.44 119.44 14.05 107.14 8.03 116.00 6.93 100.67 17.74 16.537 .000# ADCPT 128.44 26.83 168.69 19.86 169.63 40.59 163.50 17.56 101.29 39.41 91.50 7.12 80.50 7.09 7.416 .000** Note.—HGA indicates high-grade glioma; MET, metastasis; LGA, low-grade glioma; NAG, nonastrocytic gliomas; MNG, meningioma; DNET, dysembryoplastic neuroepithelial tumor; GRN, granuloma; ADCT, calculated ADC values from tumoral area; ADCPT, calculated ADC values from peritumoral area; NS, not significance.
* DNET and GRN were excluded from statistical comparison because of their low sample number.
† F score and P values were obtained by using Tukey pairwise post hoc test.
‡ Although the omnibus test was statistically significant, none of the pairwise post hoc tests reached significance.
§ MET > HGA, MET > LGA, MET > NAG P < .001; MET > MNG P < .05; otherwise NS.
| MET > LGA, MET > MNG P < .05; otherwise NS.
¶ MNG > HGA, MNG > MET, MNG > LGA, MNG > NAG P < .001; otherwise NS.
# LGA > HGA, LGA > MET, NAG > HGA, NAG > MET P < .001; MNG > HGA, MNG > MET P < .05; otherwise NS.
** LGA > MNG P < .001; LGA > HGA, MET > MNG, NAG > MNG P < .05; otherwise NS.
In this issue


Jump to section
Related Articles
Cited By...
- Extra-axial tentorial medulloblastoma: a rare presentation of a common posterior fossa tumour
- Diffusion-Weighted Imaging and Diffusion Tensor Imaging for Differentiating High-Grade Glioma from Solitary Brain Metastasis: A Systematic Review and Meta-Analysis
- MR Fingerprinting of Adult Brain Tumors: Initial Experience
- MRI Grading versus Histology: Predicting Survival of World Health Organization Grade II-IV Astrocytomas
- Methodology of diffusion-weighted, diffusion tensor and magnetisation transfer imaging
- MR Spectroscopy in Radiation Injury
- Usefulness of diffusion/perfusion-weighted MRI in patients with non-enhancing supratentorial brain gliomas: a valuable tool to predict tumour grading?