
Abstract
BACKGROUND AND PURPOSE: Cerebral venous thrombus (CVT) signal intensity is variable on MR imaging, and the appearance of CVT on gradient recalled-echo (GRE) sequences has been incompletely assessed. This study was performed to evaluate the GRE imaging appearance of CVT in different stages of thrombus evolution and its relationship to signal intensity on other MR pulse sequences.
MATERIALS AND METHODS: The clinical and MR imaging findings in 18 patients with CVT and GRE imaging were reviewed. Sixty-nine thrombosed venous segments were evaluated, and the signal intensity of thrombus relative to gray matter was determined. The degree of thrombus susceptibility effect (SE) was assessed and related to time of imaging after onset of symptoms (clinical thrombus age) and appearance on other pulse sequences. Segments were classified as SE+ (demonstrating susceptibility effect) or SE− (no susceptibility effect).
RESULTS: Thirty-six venous segments exhibited visible SE. SE+ segments had a clinical thrombus age that was less than that in SE− segments (8.1 versus 24.6 days, P = .003). Sixty-three percent (23/36) of SE+ segments exhibited hypointensity on T2-weighted images (T2WI) versus 12% (4/33) of SE− segments (P < .001). Twenty-nine of 32 (90.6%) segments with clinical thrombus age of 0–7 days were SE+, versus 7 of 30 (23.3%) segments with a thrombus age of 8 days or greater.
CONCLUSION: SEs from CVT can be detected with GRE imaging and are most prevalent in patients with hypointense thrombus on T2WI within 7 days after the symptom onset. This correlates with the paramagnetic effects of deoxyhemoglobin in acute stage thrombus. GRE imaging may be useful in detecting thrombus in this stage when difficult to detect on other pulse sequences.
Cerebral venous thrombosis (CVT) is responsible for 1%–2% of all strokes in adults,1 with an estimated annual incidence of 3–4 cases per million people2 and a mortality rate of 8%.3 MR imaging and MR venography (MRV) are the most commonly used tools for diagnosis.2, 4, 5 One of the most important findings on MR imaging is abnormal signal intensity within the venous structure, indicating altered flow and thrombus formation.5 Acute stage thrombus (within the first 7 days after clinical symptoms) has been shown to exhibit very subtle signal intensity alterations on noncontrast MR that can be mistaken for normal flow states.5, 6 Gradient recalled-echo (GRE) T2*-weighted imaging is becoming more widely used as a standard MR pulse sequence because of its sensitivity to acute intracranial hemorrhage.7 The utility of GRE sequences in identifying intra-arterial thrombus, assessing etiology, and potentially directing therapy has recently been advocated.8 Few reports have evaluated the appearance of CVT on GRE T2*-weighted sequences.9, 10 The GRE appearance of cerebral venous thrombus in different stages of evolution has not been previously evaluated. This study was performed to evaluate the GRE imaging appearance of CVT in different stages of thrombus evolution and its relationship to signal intensity on other MR pulse sequences.
Materials and Methods
An ongoing data base of cases of CVT was created in 2002, after Institutional Review Board approval. A keyword search of imaging reports for the terms “cerebral venous thrombosis” and “dural sinus thrombosis” was used, and a total of 30 cases of CVT were identified, imaged by MRI from 1999 to 2005. From this group, 18 patients were identified who had GRE T2*-weighted pulse sequences as part of the initial examination.
All patients were imaged at 1.5T with standard clinical scanners (GE Healthcare, Milwaukee, Wis). Pulse sequences used included: T1-weighted (T1WI) (TR, 300–400 ms; TE, 8–9 ms), fast spin-echo T2-weighted (T2WI) (TR, 3000–4000 ms; TE, 78.6–123 ms; echo-train length, 12), and fluid-attenuated inversion recovery (FLAIR) (TR, 1002–1004 ms; TI, 2000 ms; TE, 127.5–142.5 ms). GRE images were obtained as a single-echo sequence (TR, 617–50 ms; TE, 26 ms; flip angle, 20°), or as a double-echo sequence (TR, 717 ms; TE, 36 ms and 26 ms; flip angle, 20°). Section thickness was 4.0 mm on all sequences, contiguously acquired, oriented parallel to the anterior commissure-posterior commissure line.
Venous occlusion was documented by filling defects on postcontrast sequences (11 patients), lack of flow signal intensity on coronal and axial acquired 2D time-of-flight MRV (15 patients), or filling defects and/or lack of opacification on elliptic centric-ordered gadolinium-enhanced MRV (CE-MRV) (12 patients). CE-MRV was performed using an elliptic centric-ordered acquisition with a modification of a technique described previously.11 Typical imaging parameters included: echo-spoiled gradient echo (SPGR) sequence, TR, 7.0 ms; TE, minimum (1.3 ms); FA, 35°; matrix, 320 × 320; FOV, 25 cm; section thickness, 1.3 mm; NEX, 1.0; bandwidth, 62.50 kHz; elliptical centric encoding; imaging time, 3 minutes 24 seconds. Scanning was performed in the sagittal plane from ear to ear. A total of 30 mL of intravenous gadolinium was injected at rate of 3.0 mL/s. The MRV acquisition was initiated after a 21-second delay after the end of intravenous contrast injection (empirically determined at our institution to provide optimum venous contrast in most patients). Most patients had all of these sequences (10 patients). All patients except one had at least one of these confirmatory examinations for thrombosis. In this one patient, the signal intensity within the transverse and sigmoid sinus was markedly abnormal (hyperintense on both T1WI and T2WI), and there was an associated skull base mass (metastatic tonsillar carcinoma) involving the jugular foramen. These findings strongly suggested thrombosis. Follow-up contrast enhanced study on this patient (8 months after the initial examination) demonstrated intrasinus filling defects consistent with thrombosis.
Abnormal intrasinus signal intensity was present in all venographically abnormal segments. This prevented hypoplastic but normal sinus segments from being incorrectly categorized as thrombosed.
Because of the variability in thrombus signal intensity that is typically seen within patients with sinus thrombosis,12 a segmental evaluation of the thrombosed venous structures was performed. Thrombosed venous segments were separately evaluated as follows: horizontal superior sagittal sinus, vertical superior sagittal sinus, torcular herophili (confluence), proximal transverse sinus (from the torcular to the entrance site of the lateral tentorial sinus/vein of Labbé), distal transverse sinus (from this point to the vertical descent of the sinus indicating the start of the sigmoid sinus), sigmoid sinus, jugular vein, straight sinus, and superficial cortical veins.
Signal intensity of venous thrombus (dominant signal intensity relative to gray matter signal intensity) was visually assessed for each thrombosed segment on T1WI, fast spin-echo (FSE) T2WI, FLAIR, and GRE sequences. The thrombosed venous segments were identified and evaluated simultaneously by 2 radiologists (J.L.L., W.M.S.). Thrombus signal intensity was evaluated, and a consensus opinion of the predominant signal intensity relative to gray matter of each thrombosed segment was determined for each pulse sequence. The observers were blinded to any clinical information about the patients other than that they were being shown thrombosed venous segments for analysis.
Signal intensity and susceptibility effect (SE) on GRE sequences was determined for each thrombosed segment. SE was defined as very dark signal intensity on GRE sequences within a thrombosed venous segment that was larger than on the other pulse sequences or adjacent venographically normal venous structures. The SE was graded as follows: 0, no susceptibility effect identified (bright GRE signal intensity or no enlargement relative to other pulse sequences); 1+, definite diminished signal intensity and minimal enlargement (but clearly larger than the signal intensity on other sequences); 2+, markedly diminished signal intensity and moderate enlargement of the venous segment; and 3+, markedly diminished signal intensity and marked enlargement of the venous segment relative to other pulse sequences. Segments exhibiting 1+, 2+, and 3+ grades were grouped (denoted as SE+). Grade 0 segments are denoted as SE−. No thrombosed venous segment had adjacent subarachnoid, subdural, or parenchymal hemorrhage that could complicate evaluation. Signal intensity of thrombus on T1WI, T2WI, GRE, and FLAIR sequences was compared.
In addition, the signal intensity of normal venous sinus segments in 13 additional patients was assessed, to define the normal appearance of cerebral venous structures on the GRE sequence used in this study. These patients were selected randomly from an ongoing data base of patients with normal MRV examinations. All imaging sequences including the GRE images were performed with the same parameters used in the thrombosis patients described above. All patients had GRE, spin-echo T1WI, and FSE T2WI performed in the axial plane, as well as CE-MRV and time-of-flight–MRV imaging performed at the same time. Normal flow and morphology were documented on the MRV images in all venous segments. No significant intracranial pathology was present. The superior sagittal sinus, transverse sinus, sigmoid sinus, and cortical veins were assessed for appearance and signal intensity relative to normal gray matter.
The time from clinical symptom onset to imaging (clinical thrombus age) was accurately available in 16 patients (62 thrombosed segments). The average clinical age of thrombus was assessed for those segments exhibiting SE and those without the effect.
Statistical analyses of the data were performed using the χ2 test for nominal (categoric) data and 2-tailed Student t test for continuous data. Results reaching a probability of P < .05 were deemed significant.
Results
Clinical Findings
A total of 18 patients were entered into the study. There were 13 women and 5 men with an age range of 20–72 years old (mean age, 45 years). Fourteen patients presented with headache, 1 patient presented with dizziness, 1 patient presented with arm and neck swelling from jugular venous thrombosis secondary to indwelling catheter, and 2 patients had traumatic sinus thrombosis (1 from penetrating trauma, 1 from closed head injury). The onset of symptoms until imaging ranged from 2 to 90 days after symptom onset (mean, 16.2 days). In 1 patient, referable symptom onset until imaging was not definite. In another patient, MR imaging was obtained for follow-up of known prior incompletely recanalized thrombosis (4 years previously) with no new symptoms.
Distribution of Venous Thrombosis
A total of 73 thrombosed venous segments were identified in 18 patients. Thrombosed segments included: anterior horizontal superior sagittal sinus (3), posterior vertical superior sagittal sinus (7), medial transverse sinus (12), lateral transverse sinus (13), sigmoid sinus (14), jugular bulb (11), straight sinus (1), and cortical veins (8). Multiple segments were involved in every patient. No patient had isolated cortical vein thrombosis without dural sinus involvement.
Thrombus Signal Intensity
In 4 of 73 thrombosed segments, SEs from the skull base calvaria did not allow for accurate GRE assessment, and these segments were not evaluated further. A total of 69 thrombosed segments were evaluated by GRE, FLAIR, T1WI, and T2WI. On T1WI, 2 segments were hypointense, 42 segments were isointense, and 25 segments were hyperintense to gray matter. On T2WI, 27 segments were hypointense, 14 segments were isointense, and 28 segments were hyperintense to gray matter. On FLAIR sequences, thrombus signal intensity closely followed T2 signal intensity with 31 segments appearing hypointense, 12 segments isointense, and 26 segments hyperintense to normal gray matter. On GRE images, 45 segments were hypointense, 13 segments were isointense, and 11 segments hyperintense to normal gray matter.
SE on GRE images was clearly seen in 36 segments (grade 1–3, SE+). The distribution of thrombus signal intensity on T1WI, T2WI, and FLAIR images with respect to susceptibility effect on GRE sequences is given in Figs 1 and 2. There was no statistically significant difference in thrombus signal intensity on T1WI in SE+ segments versus SE− segments. There was a statistically significant difference in thrombus signal intensity on T2WI in SE+ segments versus SE− segments; 63% of SE+ segments (23/36) exhibited hypointensity versus 12% (4/33) of SE− segments (P < .001). Likewise, there was a statistically significant difference in thrombus signal intensity on FLAIR images in SE+ and SE− segments, with 69% (25/36) of SE+ segments exhibiting hypointensity versus 18% (6/33) of SE− segments. All SE+ segments demonstrated hypointensity on GRE sequences by definition. Prominent SE (grade 2 and 3) was noted in 20 thrombosed segments (Fig 3). Thirteen SE+ thrombosed venous segments were evaluated by a dual-echo GRE sequence with the same TR (717 ms) and differing TE (26 and 36 ms). GRE SE was more pronounced on the longer TE images in 12 of 13 segments. In no segment was SE noted only on the long TE images.
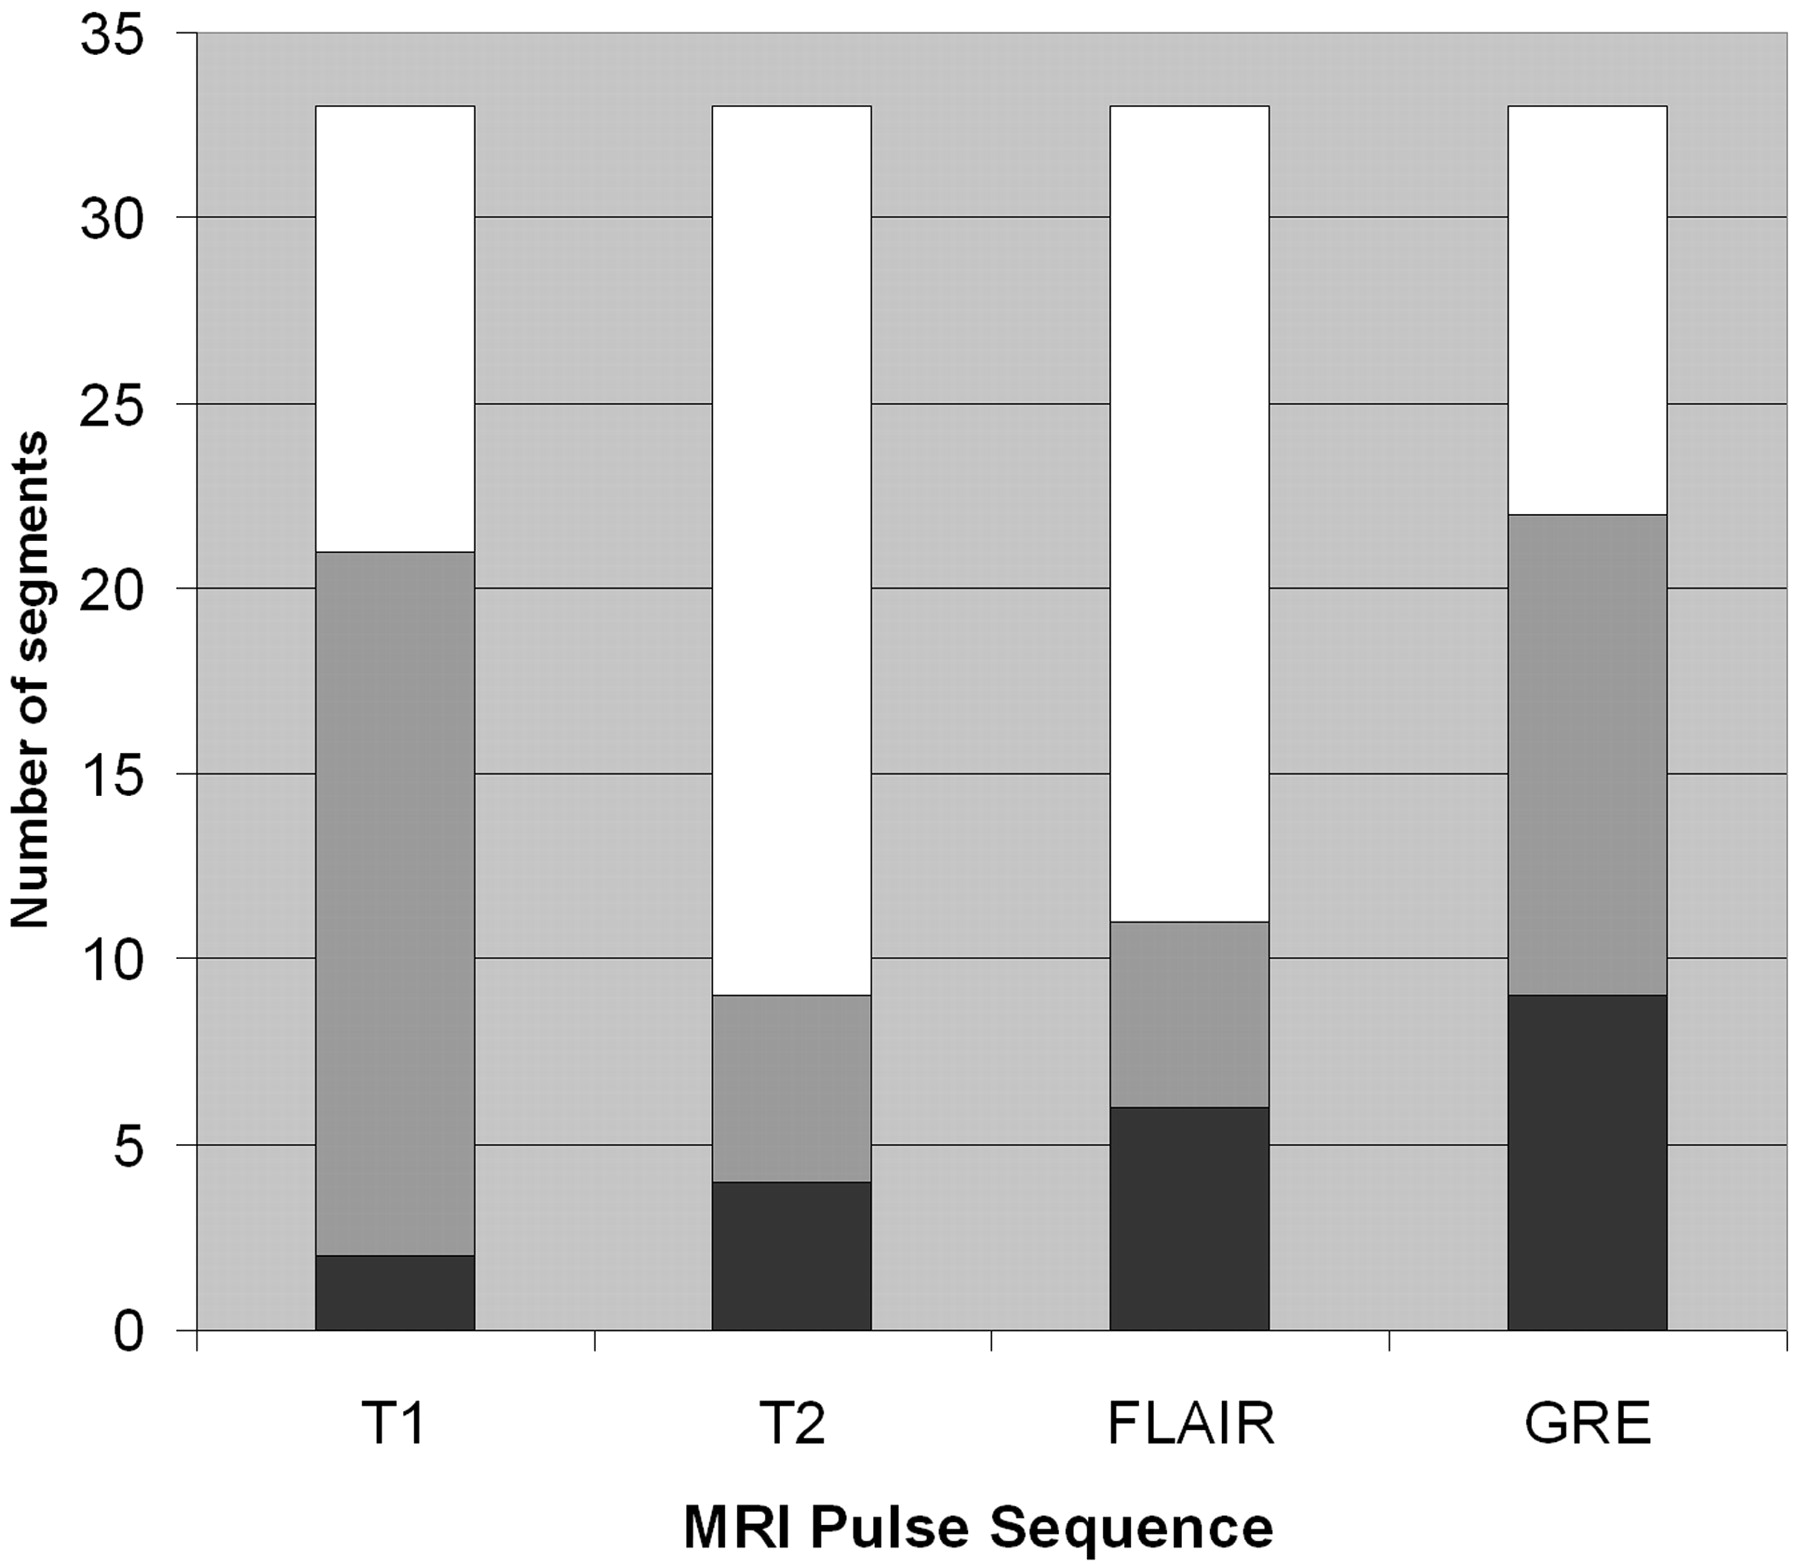
Signal intensity of thrombosed venous segments without susceptibility effect on GRE T2*- weighted sequences. Black, hypointense relative to gray matter; gray, isointense to gray matter; white, hyperintense to gray matter.

Signal intensity of thrombosed venous segments with susceptibility effect on GRE T2*- weighted sequences. Black, hypointense relative to gray matter; gray, isointense to gray matter; white, hyperintense to gray matter. GRE*, all segments exhibiting susceptibility effect were hypointense on GRE T2*- weighted sequences.

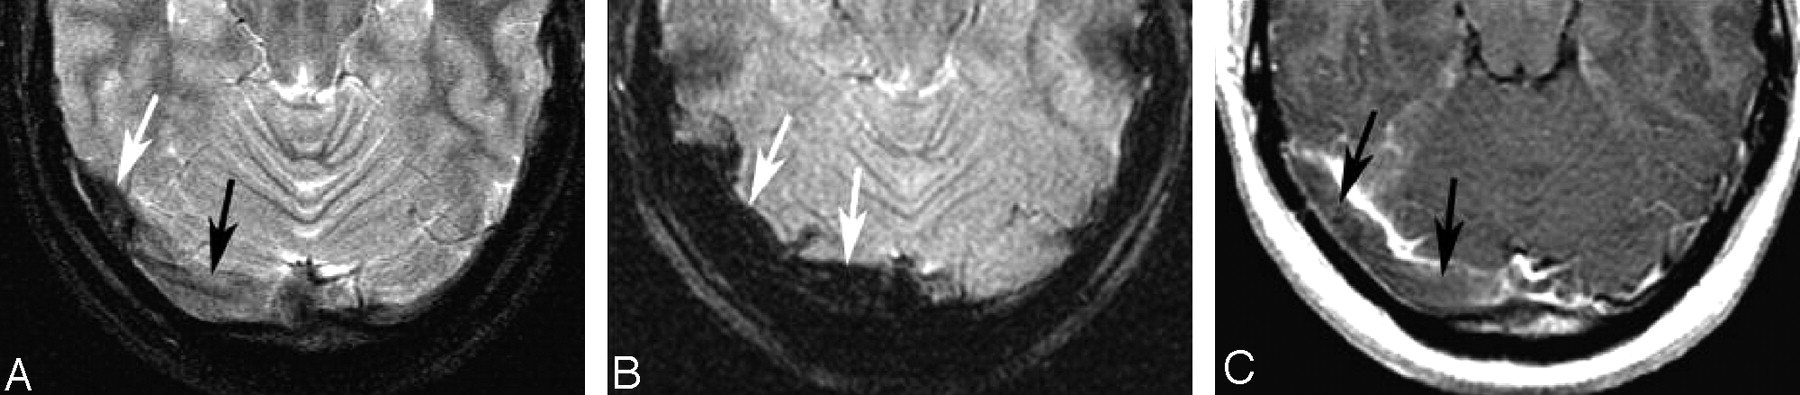
A 22-year-old woman with a 6-day history of headache. Note the subtle abnormal signal intensity in the right transverse sinus on T2-weighting (A). The medial sinus is isointense (black arrow, A) and the lateral transverse sinus is hypointense (white arrow, A). The signal intensity on GRE sequences is very dark and enlarged compared with the size of the sinus on other sequences, consistent with susceptibility effect (arrows, B). On the postcontrast T1-weighted image, an isointense filling defect is noted consistent with thrombus (arrows, C).
A, FSE T2-weighted image.
B, GRE T2*-weighted image.
C, T1WI after the administration of contrast.
Fourteen of 17 thrombosed segments (8 patients) that exhibited hypointensity or isointensity on T1WI and hypointensity on T2WI (segments very difficult to identify as abnormal on noncontrast imaging) exhibited SE on GRE sequences. In 11 of these segments, the effect was pronounced (2+ and 3+ grade).
SE and Clinical Thrombus Age
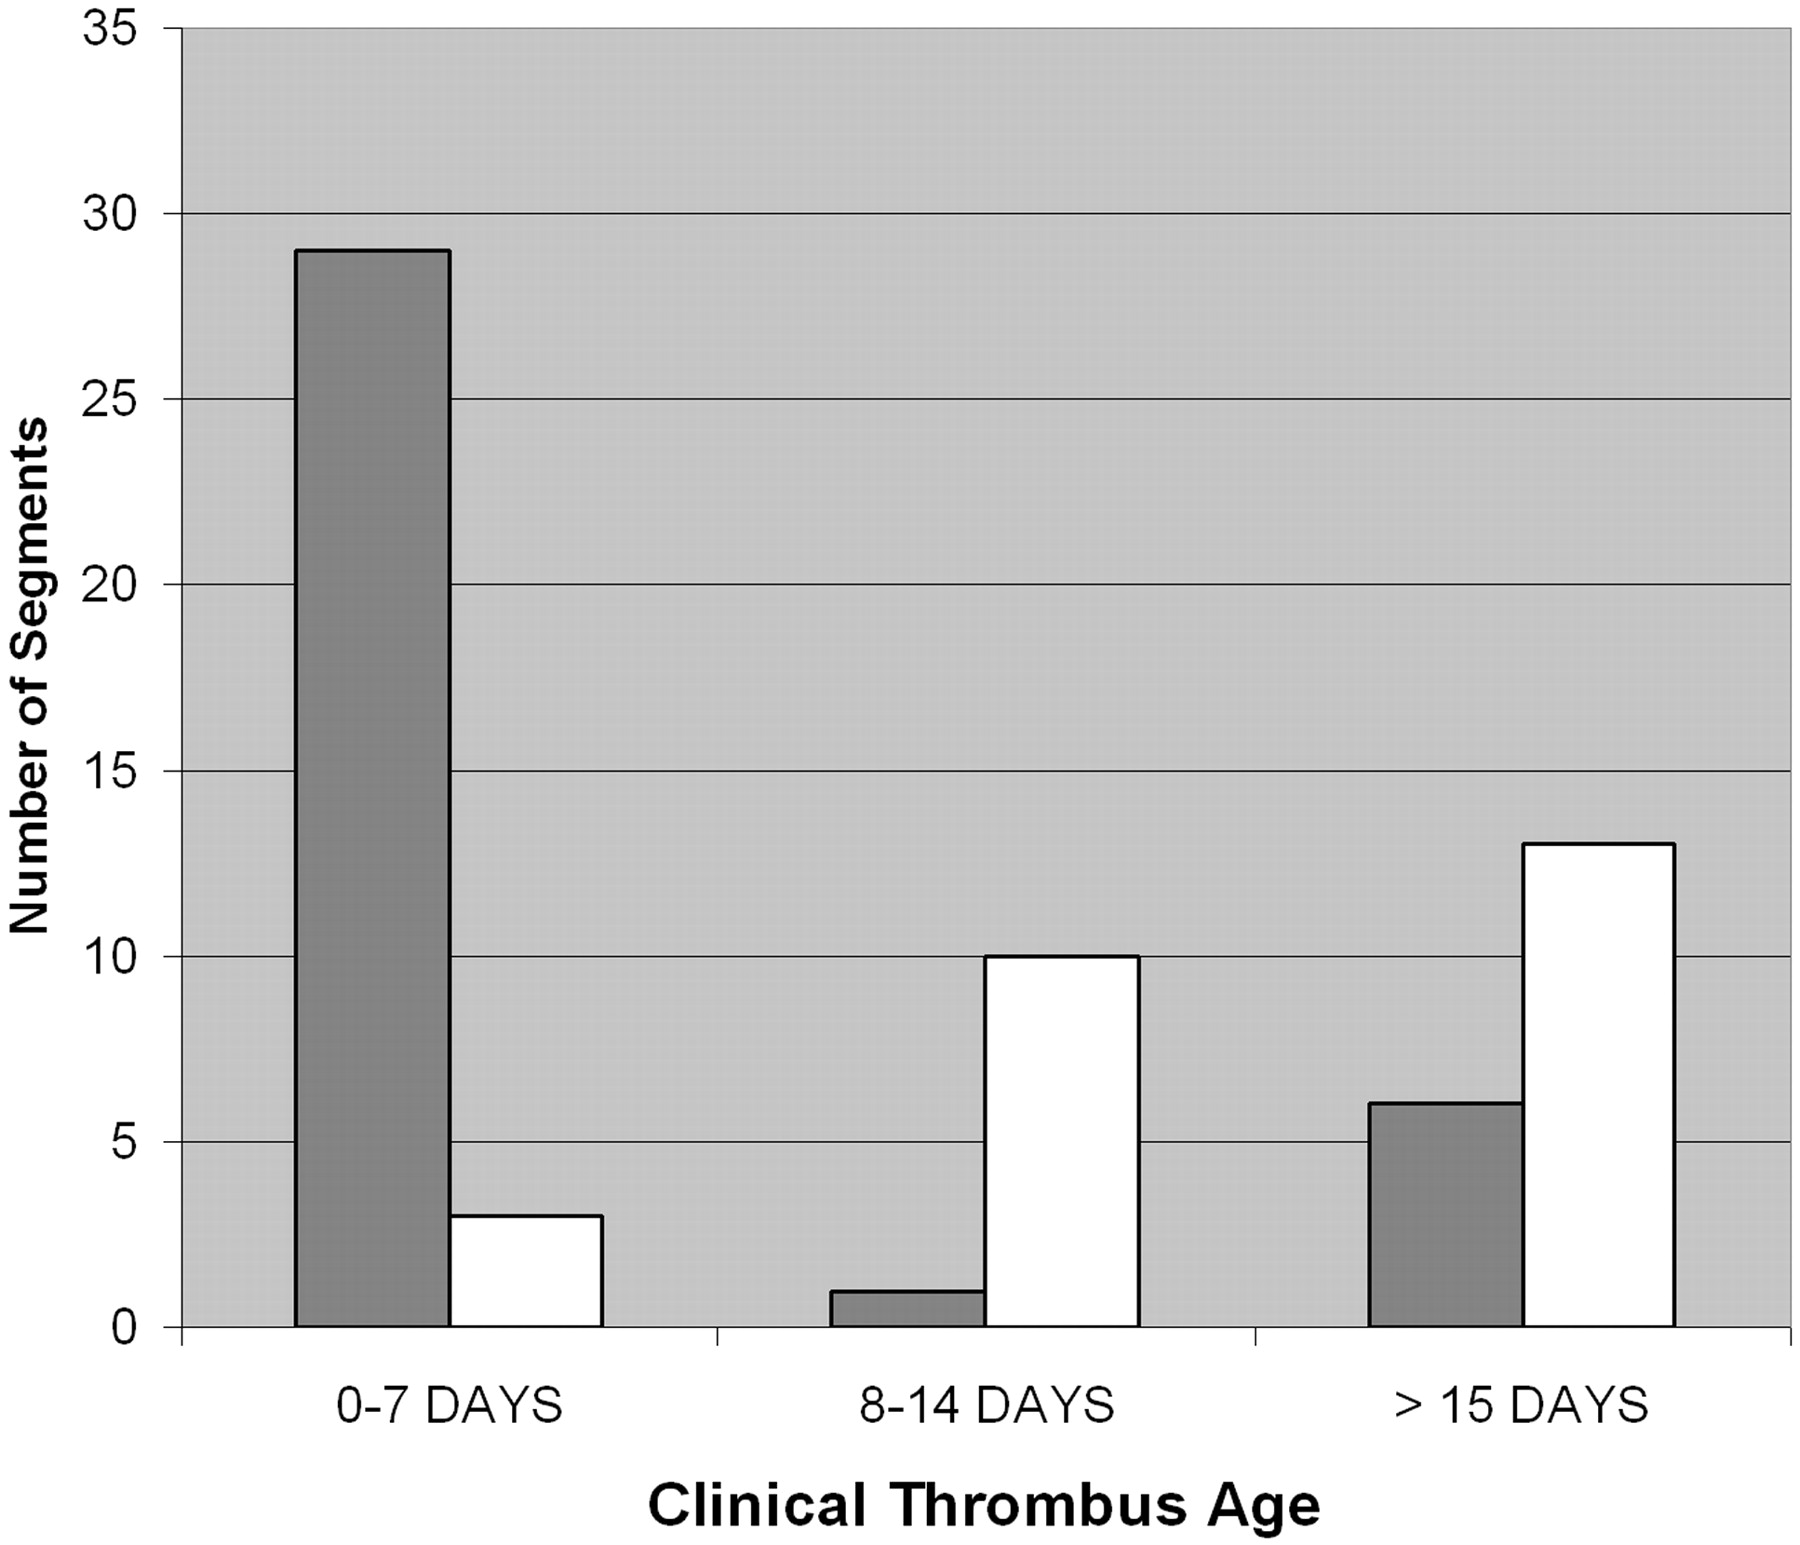
Accurate time from clinically referable symptom onset to imaging was obtainable in 16 patients (62 thrombosed segments). In one patient with incompletely recanalized thrombosis, no new symptoms were present; in another, no reliable symptom onset was available (Table 1). Twenty-nine of 36 (80.5%) SE+ segments had a clinical thrombus age of 0–7 days, versus 3 of 26 (11.5%) SE− segments (P < .001). Twenty-nine of 32 (90.6%) segments with clinical thrombus age of 0–7 days were SE+, versus 7 of 30 (23.3%) segments with a clinical thrombus age of ≥8 days (Fig 4). No significant difference in the number of SE+ segments was noted comparing those at 8–14 days versus those at >15 days. Average clinical thrombus age was 8.1 days in SE+ segments versus 24.6 days in SE− segments. (P = .003, 2-tailed t test). Segments with moderate or marked SE (2+, 3+) had an earlier average clinical thrombus age of 5.8 days versus 22.1 days for segments with minimal (1+) or no SE (P = .0002, 2-tailed t test). All thrombosed segments with clinical thrombus age of less than or equal to 7 days also appearing hypointense on T2WI (average 4.3 days) exhibited SE on GRE images. Fifteen of 19 (79%) of these segments exhibited moderate to marked SE (2+, 3+). SE was visible in 5 of 7 cases of cortical venous thrombosis (Fig 5). Moderate or marked (2+, 3+) SE was noted in all thrombosed cortical venous segments with acute (≤7 days) clinical thrombus age. Only 6 of 24 (25%) segments of definite chronic clinical thrombus age (15 days or greater, including 5 segments involved in 1 patient not included in other analysis without new symptoms but on follow-up of partially recanalized thrombosis 4 years earlier) exhibited SE. Four of these segments exhibited minimal (1+), and 2 exhibited moderate (2+) SE. No segment with chronic thrombus age exhibited marked (3+) SE.

Clinical thrombus age and susceptibility effect. Gray, susceptibility effect present; white, susceptibility effect absent.

A 20-year-old woman with 2-day history of severe headache. Thrombosis of the superior sagittal sinus and multiple cortical veins is present. Note the prominent hypointensity of the thrombosed superior sagittal sinus and cortical veins in B (arrows), much larger than the thrombosed venous structures on other sequences (A and C, arrows). Graded as 3+ susceptibility effect. Signal intensity of the thrombosed segments is hypointense on T2WI and isointense on T1WI. Note the normal parietal cortical vein on the left (arrowheads).
A, FSE T2-weighted image.
B, GRE T2*-weighted image.
C, T1WI after the administration of contrast.
Susceptibility effect on gradient recalled-echo MR images and clinical thrombus age
Normal Venous Segments
The imaging appearance and signal intensity of normal venous segments are given in Table 2. The signal intensity of normal venous segments was variable. The morphology was typically heterogeneous. Forty-five of 52 (86.5%) evaluated dural sinus segments were hyperintense or isointense to gray matter on GRE sequences. All evaluated cortical venous structures exhibited homogeneous hypointensity. The size of all venous segments on GRE sequences was similar to the size demonstrated on other sequences (no apparent SE).
Signal intensity of venographically normal venous segments on gradient recalled-echo images
Parenchymal Findings
Five patients had brain parenchymal abnormalities related to the thrombosed venous segments. Three patients had areas of intraparenchymal hemorrhage (temporal, temporal-occipital, and frontal), one with associated subarachnoid hemorrhage. Two patients had areas of edema in the brain parenchyma in areas drained by the thrombosed venous structure.
Discussion
MR imaging and MR venography are the primary current techniques used for the diagnosis of CVT.2 An important finding on MR is alteration of venous signal intensity secondary to thrombus formation; however, the signal intensity of CVT and normal flow states can both be variable, leading to diagnostic confusion.12 One of the major reasons for the variable appearances of venous thrombus is thought to be alterations in hemoglobin oxygenation and iron oxidation state within trapped red-blood cells or extracellularly within the thrombus itself.5, 6
CVT evolution has been described relating to time after symptom onset and histopathology15 and MR appearance on spin-echo sequences.5 In the acute stage (typically described between 0 and 7 days after symptom onset), thrombus is usually isointense on T1WI and hypointense on T2WI and relates to paramagnetic deoxyhemoglobin within trapped red blood cells within the thrombus. In the subacute phase (7–14 days), thrombus signal intensity on T1WI and T2WI is hyperintense and relates to extracellular methemoglobin in the evolving hyalinizing thrombus. An intermediary phase can also occur relating to intracellular methemoglobin, where there is hyperintense signal intensity on T1-weighting and hypointense signal intensity on T2-weighting.5 In the chronic stage (greater than 15 days), signal intensity is typically isointense on T1WI and hyperintense on T2WI and is probably related to the vascularized connective tissue of chronic thrombus.5, 14,15 There can be significant variability in the appearance of each stage in different segments in a given patient, and between patients in the same clinical stage.5, 12, 15 This variability is why a segmental assessment approach was used in this study to describe the differing appearances of venous thrombus encountered in each patient.
GRE T2*-weighted sequences are more sensitive to paramagnetic effects than those based on spin-echo techniques16 and would seem to be well-suited to evaluation of pathologic conditions such as intravascular thrombosis. Paramagnetic compounds (such as deoxyhemoglobin, intracellular methemoglobin, and hemosiderin) can produce significant signal intensity loss on GRE sequences secondary to locally nonuniform magnetic fields, resulting in a rapid dephasing of proton spins. This effect of magnetic susceptibility is more pronounced on GRE sequences secondary to lack of the 180° refocusing pulse that is used in spin-echo techniques. The T2* signal intensity loss seen on GRE sequences is greater with longer TE, smaller flip angle, and larger magnetic field strength.16 In stages of hemorrhage in which no paramagnetic products are present or where there is loss of compartmentalization of gradients of magnetic susceptibility (oxyhemoglobin, extracellular methemoglobin), the effect is less prominent or absent.16
Like parenchymal hemorrhage, intravascular thrombus can also exhibit susceptibility effects on GRE sequences.8 This technique may also be able to assess the difference between intravascular thrombus types.8 Two main thrombus subtypes have been described within the vascular system.13, 17 So-called “white thrombi” are primarily composed of platelet aggregates and are formed in areas of high shear stress, as in the arterial system, and can develop on ruptured or complicated atheromatous plaque. “Red thrombi” are richer in fibrin and trapped erythrocytes and typically form in low-pressure systems, such as cardiac or venous system, and result from activation of the coagulation cascade in areas of slow flow.8 It would seem that the intravascular susceptibility sign would be more pronounced in venous thrombus given the erythrocyte rich nature of venous thrombosis.
Our study demonstrates that a SE from venous thrombus (both within the dural sinuses and within the cortical veins) can be detected on standard GRE imaging techniques. This effect is most pronounced in venous segments with more acute thrombus (indicated by intrinsic hypointense T2-signal intensity and short time from symptoms to imaging), presumably relating to the paramagnetic effects of deoxyhemoglobin within trapped erythrocytes within the thrombus. In chronic thrombus (greater then 14 days clinical thrombus age), few segments exhibited the SE, and none was marked. Acute stage venous thrombus, because of its typical signal intensity (isointense or hypointense on T1WI and hypointense on T2WI), may be difficult to recognize on MR imaging.6 Application of GRE sequences and assessment of the SE may be useful in this stage for diagnosis given the pronounced SE seen in most segments in this time interval. Although not specifically addressed in this article, further studies using blinded multireviewer assessment would be necessary to further define this utility.
Two previous preliminary investigations have assessed GRE T2*-weighted techniques in the evaluation of CVT. Fellner et al9 assessed spin-echo GRE techniques similar to those applied in our study in 6 cases of CVT. Four cases involved superficial cortical venous thrombosis without or with dural sinus involvement. In these cases, the SE on GRE sequences in the thrombosed cortical veins was the most pronounced finding compared with other pulse sequences.9 Likewise, in our study, the susceptibility sign was marked in most cases of cortical venous involvement. The finding was less prominent in cases of dural sinus thrombosis in their study; however, symptom onset information, and thus clinical thrombus age, was not well documented, and no detailed description of thrombus signal intensity on other sequences was provided. In another study, Selim et al10 evaluated echo-planar GRE T2* -weighted sequences in 5 patients with CVT with clinical thrombus age of 9 days or less. All patients had dural sinus thrombosis, 3 of which also had cortical vein involvement. All thrombosed segments had prominent SE. Detailed signal intensity of the thrombus was not described for other sequences.
In our study, we note less GRE SE in cases of chronic thrombosis, a finding that has not been described previously. Only 25% of chronically thrombosed segments exhibited the SE and none were marked (3+). This may be secondary to the intense macrophage activity that occurs as the thrombus organizes,15 resulting in removal of blood breakdown products in this stage. Along with other findings of chronic thrombosis such as hyperintense T2 signal intensity and marked enhancement,14 the lack of SE may help correctly categorize thrombus as chronic and organized.
Application of a dual-echo GRE sequence in some of our cases allows us to determine the effects of altering TE to SE assessment. As expected, a longer TE (36 ms versus 26 ms) resulted in a more pronounced SE. This difference was not marked, however, and in no case was an effect noted only on the longer TE images. It may be advisable, however, to use a longer TE with this sequence to maximize detection of this effect.
Application of the SE on GRE sequences to help direct therapy of CVT has not been assessed. Recent prospective clinical studies have demonstrated that in acute sinus thrombosis, most recanalization occurs within the first 3 weeks of anticoagulation therapy, and further recanalization after 4 months of therapy rarely occurs.18, 19 Other authors have evaluated diffusion effects in venous thrombus and found that in those patients with diffusion restriction within the thrombus, the thrombus was typically older, and less recanalization occurred after anticoagulation therapy.20 In arterial thrombosis, the presence of arterial GRE susceptibility effect has been shown to be more common in cardioembolic thrombosis and may have a better recanalization rate than primary arterial thrombosis.8 Although intriguing, the characterization of vascular thrombus by MR imaging and how this can affect therapy is in its infancy. Whether the presence of SE on GRE images within venous thrombus (because it is seen primarily in acute thrombosis) may relate to better response to therapy remains to be proved.
There are some limitations to this study. Clinical aging of CVT can be inaccurate because of the variable symptoms and variable symptom onset relative to imaging that can occur in this disease.2 Fortunately, most of our patients had relatively defined onset of a single symptom (headache), increasing the accuracy of our temporal data. Nevertheless, thrombosis may be occurring for an undetermined length of time before symptom onset, complicating assessment. The SE assessment is subjective, though the signal intensity was graded by consensus opinion of experienced radiologists in this study. Susceptibility artifacts from the skull base may be significant, and in diagnostic application may limit assessment in the lower sigmoid sinuses and jugular bulb region. In our study, only 4 of 73 thrombosed venous segments (sigmoid sinus and jugular bulb) could not be accurately assessed because of calvarial artifact. Areas of adjacent air or hemorrhage may also limit this technique. It is of some interest that the SE can be most pronounced in cortical veins,9 which are not as hampered by potential air and skull base calvarial artifact.
The appearance of normal venous segments on GRE sequences was also assessed as used in our study. The signal intensity of normal dural sinuses is predominantly hyperintense or isointense to gray matter. The signal intensity within the sinuses was also heterogeneous, presumably related to turbulent flow effects. The signal intensity of normal cortical veins was more uniform and always hypointense. In no normal venous structure was there enlargement of the segment on GRE sequences relative to other sequences. The combination of marked intravascular hypointensity coupled with enlargement of the venous structure on GRE sequences relative to other sequences is important to properly identify the SE.
Ultimately, the application of GRE sequences to assess venous thrombosis does not replace confirmatory MRV or CT venography to provide additional evidence of sinus thrombosis, given the time-dependent signal intensity alterations on this technique.
Conclusion
SEs within CVT on low flip angle T2*-weighted GRE sequences can be identified. The effect is most prevalent in thrombosed venous segments with a clinical thrombus age of 7 days or less and in segments exhibiting hypointensity on T2-weighted sequences. It is identified in both dural sinus thrombus and in cortical venous thrombus. Application of GRE sequences and assessment of the SE in acute stage thrombus may aid in diagnosis of this stage. Application of GRE thrombus SEs to potentially direct therapy is intriguing but remains to be assessed.
References
- Received May 1, 2006.
- Accepted after revision September 19, 2006.
- Copyright © American Society of Neuroradiology
In this issue


Jump to section
Related Articles
Cited By...
- Child Neurology: Mimics of cerebral sinovenous thrombosis: A pediatric case series
- Pediatric Cortical Vein Thrombosis: Frequency and Association With Venous Infarction
- Cerebral Venous Thrombosis with Subarachnoid Hemorrhage: a Case Report
- Simultaneous Arteriovenous Shunting and Venous Congestion Identification in Dural Arteriovenous Fistulas Using Susceptibility-Weighted Imaging: Initial Experience
- Diagnosis and Management of Cerebral Venous Thrombosis: A Statement for Healthcare Professionals From the American Heart Association/American Stroke Association
- Cerebral Venous Thrombosis: Diagnostic Accuracy of Combined, Dynamic and Static, Contrast-Enhanced 4D MR Venography
- T2* Signal Hyperintensity in Subacute Cerebral Vein Thrombosis
- MR Imaging Features of Isolated Cortical Vein Thrombosis: Diagnosis and Follow-Up