
Abstract
BACKGROUND AND PURPOSE: Noninvasive radiologic evaluation of glioma can facilitate correct diagnosis and detection of malignant transformation. Although positron-emission tomography is considered valuable in the care of patients with gliomas, 18F-fluorodeoxyglucose and 11C-methionine have reportedly shown ambiguous results in terms of grading and prognostication. The present study compared the diagnostic and prognostic capabilities of diffusion tensor imaging, FDG, and 11C-methionine PET in nonenhancing gliomas.
MATERIALS AND METHODS: Thirty-five consecutive newly diagnosed, histologically confirmed nonenhancing gliomas that underwent both FDG and 11C-methionine PET were retrospectively investigated (23 grade II and 12 grade III gliomas). Apparent diffusion coefficient, fractional anisotropy, and tumor-to-normal tissue ratios of both FDG and 11C-methionine PET were compared between grade II and III gliomas. Prognostic values of these parameters were also tested by using progression-free survival.
RESULTS: Grade III gliomas showed significantly higher average tumor-to-normal tissue and maximum tumor2-to-normal tissue than grade II gliomas in 11C-methionine (P = .013, P = .0017, respectively), but not in FDG-PET imaging. There was no significant difference in average ADC, minimum ADC, average fractional anisotropy, and maximum fractional anisotropy. 11C-methionine PET maximum tumor-to-normal tissue ratio of 2.0 was most suitable for detecting grade III gliomas among nonenhancing gliomas (sensitivity, 83.3%; specificity, 73.9%). Among patients not receiving any adjuvant therapy, median progression-free survival was 64.2 ± 7.2 months in patients with maximum tumor-to-normal tissue ratio of <2.0 for 11C-methionine PET and 18.6 ± 6.9 months in patients with maximum tumor-to-normal tissue ratio of >2.0 (P = .0044).
CONCLUSIONS: 11C-methionine PET holds promise for World Health Organization grading and could offer a prognostic imaging biomarker for nonenhancing gliomas.
ABBREVIATIONS:
- MET
- 11C-methionine
- PFS
- progression-free survival
- T/N
- tumor-to-normal tissue
- T/Nave
- average tumor-to-normal tissue
- T/Nmax
- maximum tumor-to-normal tissue
Gliomas are categorized from grade I to IV according to the World Health Organization classification, which is based on histopathologic findings.1 Although molecular and genetic information is gaining importance,2 therapeutic strategy is still heavily based on World Health Organization grading. Biopsy is occasionally chosen instead of surgical resection due to various factors such as tumor location, and the heterogeneous features of the tumor often complicate accurate diagnosis, leading to undergrading of the tumor.3,4
MR imaging is one of the noninvasive methods for tumor grading and is now considered the criterion standard imaging procedure for glioma.5 Although contrast enhancement of the tumor is regarded as a hallmark of high-grade glioma, anaplastic tumors and even glioblastoma can lack contrast enhancement. Previous reports have shown that 32%–42% of nonenhancing gliomas are high-grade. In other words, as many as 92%–100% of nonenhancing gliomas are grade II or III gliomas.6⇓⇓⇓⇓–11 As a result, nonenhancing glioma contains various tumor grades ranging from grade II to IV. In the context of nonenhancing tumor, accurate preoperative diagnosis may change the initial management of the tumor, and if grade III is suspected, a more aggressive surgical resection, rather than biopsy, may be pursued. This treatment strategy poses a challenge to physicians to achieve a correct preoperative diagnosis and leads to a need for additional imaging modalities to visualize tumor characteristics. Although previous investigations have attempted to solve this problem by using various advanced MR imaging techniques such as diffusion tensor imaging, perfusion-weighted imaging, and MR spectroscopy,6,7,9,12 the clinical significance of these methods remains controversial. In this context, positron-emission tomography is considered a promising imaging technique supplementing MR imaging in the care of patients with gliomas. Past investigations, however, have analyzed mixtures of both high- and low-grade gliomas for their analyses, leading to inconclusive results in terms of its usefulness in clinical practice. The most important question to be answered is the clinical impact of PET on nonenhancing gliomas, in which tumor grading is difficult using conventional MR imaging alone. Hence, the current investigation was conducted to test the hypothesis that PET could be useful for both radiologic tumor grading and prognostication of nonenhancing gliomas. More specifically, our aim was to test the hypothesis that 11C-methionine (MET) PET not only has greater specificity and positive predictive power than 18F-fluorodeoxyglucose-PET for determination of grade in nonenhancing gliomas but also predicts progression-free survival in newly diagnosed nonenhancing gliomas receiving standard therapy. The results obtained from PET were further compared with apparent diffusion coefficient obtained by DTI.
Materials and Methods
Patients
Thirty-five patients with newly diagnosed, histologically confirmed nonenhancing supratentorial gliomas were retrospectively collected (18 men, 17 women; mean age, 39.9 ± 15.8 years; World Health Organization grade II, n = 23; grade III, n = 12). Four of the 23 grade II gliomas and 3 of the 12 grade III gliomas showed oligodendrocytic components. Histologic grading was performed according to the World Health Organization criteria after partial (<95% tumor removal) or total (≥95% tumor removal) resection of the lesion or stereotactic biopsy (total resection, n = 11; partial resection, n = 21; stereotactic biopsy, n = 3). Three patients with grade II gliomas and all patients with grade III gliomas received adjuvant therapy postoperatively, such as radiation therapy alone, radiation therapy with chemotherapy, or chemotherapy alone. Both FDG and MET PET were performed preoperatively except in 1 case, in which PET was performed 69 days after stereotactic biopsy. The mean duration of follow-up was 29.6 ± 18.1 months. “Tumor progression” was defined as either distinct enlargement of high-intensity lesions on T2 or fluid-attenuated inversion recovery imaging or the appearance of a contrast-enhancing lesion. “Progression-free survival” was defined as the duration between surgery and tumor progression. Detailed characteristics of patients are given in On-line Table 1. Use of clinical data was approved for research purposes by the local institutional review board.
PET Methods
PET studies were performed by using an Eminence-G (Shimadzu, Kyoto, Japan). Synthesis of MET was performed according to the method described by Berger et al,13 and MET was injected intravenously at a dose of 3 MBq/kg. Tracer accumulation was recorded for 12 minutes in 59 or 99 transaxial sections over the entire brain. Summed activity from 20 to 32 minutes after tracer injection was used for image reconstruction. For FDG-PET, after a 10-minute transmission scan, an amount of FDG determined in proportion to weight was injected intravenously (3.7 MBq/kg). Tracer accumulation was recorded in 3D mode for 12 minutes in 59 or 99 transaxial sections from the entire brain. Total activity from 45 to 57 minutes after tracer injection was used for image reconstruction. Both images were stored in 256 × 256 × 59 or 99 anisotropic voxels, with each voxel being 1 × 1 × 2.6 mm. The mean interval between preceding PET and an operation was 60.4 ± 68.8 days (range, −69 to 347 days).
MR Imaging
All patients were studied by using either a 1.5T or 3T MR imaging scanner within a week before the operation. T1-weighted imaging with gadolinium enhancement was used to select patients with nonenhancing gliomas. T2-weighted or FLAIR images were acquired in all cases for delineation of tumors. Diffusion tensor imaging was performed in all except 4 patients (21 with grade II glioma and 10 with grade III glioma) by using a 3T MR imaging scanner (Signa; GE Healthcare, Milwaukee, Wisconsin). Images were acquired by using a single-shot echo-planar imaging technique with TE = 80 and TR = 10,000. Diffusion gradient encoding in 25 directions with b=2000 s/mm2 and an additional measurement without the diffusion gradient (b=0 s/mm2) were performed.14 A parallel imaging technique was used to record data with a 128 × 128 spatial resolution for a 260 × 260 mm FOV. Fifty sections were obtained, with a section thickness of 3 mm and no intersection gap. Apparent diffusion coefficient was processed by using the Diffusion Toolkit (TrackVis; http://www.trackvis.org/dtk/).
Image Fusion and Analysis
After all images had been obtained, PET images, ADC, and FA maps were all registered to T2 or FLAIR images by using VINCI image analysis software (http://www.nf.mpg.de/vinci/). Correct coregistration of images was visually confirmed. After image registration was complete, all image sets were converted to anisotropic images (256 × 256 × 59 or 99, 1 × 1 × 2.6 mm), enabling further analysis. For PET images, the standard uptake value of the contralateral tumor-unaffected gray matter in the axial plane at the level of the thalamus was averaged, and the derived value was used to normalize standard uptake value in a voxelwise manner, enabling reconstruction of tumor-to-normal tissue (T/N) ratio images. All datasets were exported to in-house software written in Matlab 7.14 (MathWorks, Natick, Massachusetts) for further analysis. High-intensity lesions delineated in T2 or FLAIR images were semiautomatically segmented in 3D by image-intensity threshold as voxels of interest. Average tumor-to-normal tissue (T/Nave) and maximum tumor-to-normal tissue values (T/Nmax) of FDG and MET PET, average ADC, and minimum ADC within the VOI were calculated (Fig 1 and On-line Fig 1). In particular, the same VOIs were applied to all 4 images. All values are reported as mean ± SD.

Schematic overview of the image-analysis process. High-intensity lesions on T2/FLAIR imaging were semiautomatically segmented in 3D by an image-intensity threshold. The segmented voxels of interest were applied to registered PET images and ADC fractional anisotropy maps, followed by calculation of the average and maximum or minimal values of each parameter within the VOI.
Statistical Analysis
Statistical analysis was performed by using JMP Version 10 software (SAS Institute, Cary, North Carolina). A threshold level of .05 was established for statistical significance. The Mann-Whitney U test was used for group comparisons. Receiver operating characteristic analysis was performed to compare the performance of each imaging parameter in distinguishing grade III from grade II gliomas. The duration of progression-free survival (PFS; reported as median ± standard error) was analyzed by Kaplan-Meier curves, and log-rank testing was performed to determine the statistical significance of any observed differences in PFS between groups. Overall survival was not analyzed because most patients have not yet reached this end point.
Results
FDG Uptake is Not Statistically Different between Grade II and III Nonenhancing Gliomas
The T/Nave of FDG-PET for grade II and III gliomas was 0.68 ± 0.28 and 0.69 ± 0.06, and T/Nmax was 1.28 ± 0.33 and 1.25 ± 0.15, respectively (Fig 2 and Table 1). These differences were not significant (P = .11 and P = .72, respectively). Receiver operating characteristic analysis showed that the T/Nave of FDG-PET performed best at a cutoff value of 0.61, with an area under the curve of 0.67 for discriminating grade III from grade II gliomas (Table 2).

T/Nave (A) and T/Nmax (B) of FDG-PET in patients with grade II and III gliomas. No significant difference was seen between grade II and III gliomas (P = .11 and 0.72, respectively).
Various imaging modalities and tumor grade
ROC analysis to discriminate tumor grade
MET Uptake Was Statistically Significantly Higher in Grade III Nonenhancing Gliomas Than in Grade II Nonenhancing Gliomas
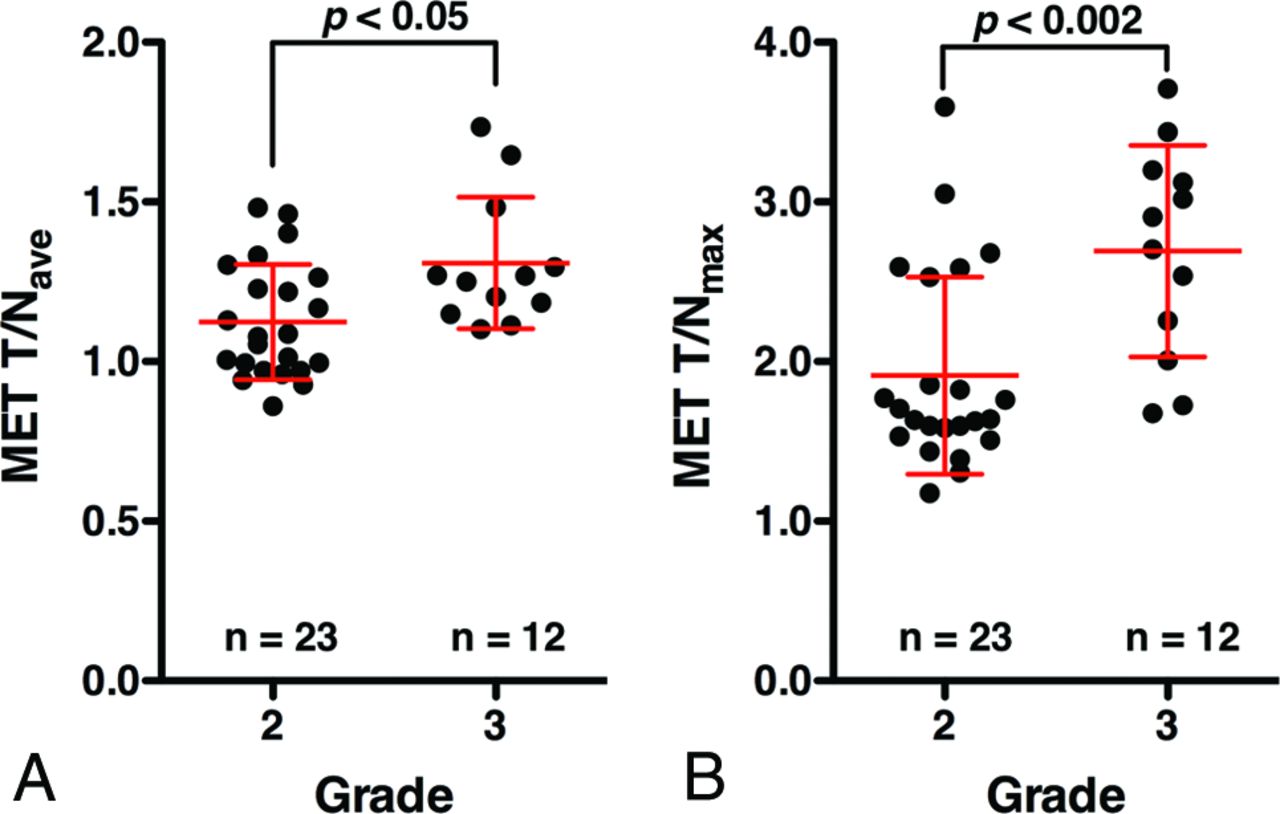
The T/Nave of MET PET for grade II and III gliomas was 1.12 ± 0.18 and 1.31 ± 0.21, and T/Nmax was 1.91 ± 0.62 and 2.69 ± 0.66, respectively (Fig 3 and Table 1). Grade III gliomas showed significantly higher MET T/Nave and T/Nmax than grade II gliomas (P = .013, P = .0017, respectively). Receiver operating characteristic analysis showed that the T/Nmax of MET PET performed best at a cutoff value of 2.0, with an area under the curve of 0.83 for discriminating grade III from grade II gliomas (Fig 4 and Table 2).

T/Nave (A) and T/Nmax (B) of MET PET in patients with grade II and III gliomas. Grade III gliomas show significantly higher T/Nave and T/Nmax than grade II gliomas (P = .013, P = .0017, respectively).

Receiver operating characteristic analysis of MET PET and FDG-PET T/Nmax was used for discriminating grade III from grade II gliomas. The area under the curve was 0.83, and the sensitivity and specificity were 83.3% and 73.9% at a cutoff T/Nmax of 2.0 for MET PET. FDG-PET was unable to discriminate grade III glioma from grade II.
ADC Did Not Show a Statistically Significant Difference between Grade II and III Nonenhancing Gliomas
Average ADCs for grade II and III gliomas were 1.09 ± 0.25 and 0.92 ± 0.22, and minimum ADCs were 0.18 ± 0.26 and 0.18 ± 0.23, respectively (Table 1). These differences were not statistically significant (P = .13 and P = .82, respectively). Receiver operating characteristic analysis based on ADC further supported these findings (Table 2).
MET PET Is Prognostic for PFS in Nonenhancing Gliomas
The median PFS for patients with grade II gliomas was 64.2 ± 6.0 months (95% CI, 20.6–64.2 months), while the median PFS for patients with grade III glioma was 36.3 ± 4.9 months (95% CI, 4.5 months not available). No difference in PFS was evident between grade II and III gliomas (P = .32) (Fig 5A).

Progression-free survival analysis by tumor grade and MET PET results. Progression-free survival is shown in Kaplan-Meier curves according to tumor grade (A). Patients with T/Nmax of <2.0 showed prolonged progression-free survival compared with those with T/Nmax of >2.0 (B, P = .006). This was also true when the analysis was restricted to patients who received no adjuvant therapy (C, P = .004).
On the other hand, median PFS was 64.2 ± 6.3 months (95% CI, 34.0–64.2 months) for patients with T/Nmax of <2.0 for MET PET (n = 19) and 18.8 ± 4.0 months (95% CI, 7.4–37.0 months) for patients with T/Nmax of >2.0 (n = 16). There was a statistically significant difference for the PFS between these groups (P = .006) (Fig 5B).
Because some patients underwent adjuvant therapy, which could affect PFS, such as radiation therapy alone, radiation therapy with chemotherapy, or chemotherapy alone, further analysis was performed for patients who did not receive any adjuvant therapy (n = 20, all grade II gliomas). Median PFS was 64.2 ± 7.2 months (95% CI, 34.0–64.2 months) for patients with T/Nmax of <2.0 for MET PET (n = 15) and 18.6 ± 6.9 months (95% CI, 7.4–37.0 months) for patients with T/Nmax of >2.0 (n = 5). This difference was statistically significant (P = .0044) (Fig 5C). On the other hand, MET PET was not prognostic among patients who received adjuvant therapy (P = .37). The above findings were confirmed even when PFS was calculated as the duration between PET examination and tumor progression (On-line Fig 2). Finally, MET PET was prognostic among patients with grade II gliomas but not among patients with grade III gliomas (P = .016 and P = .22, respectively). Detailed data are shown in On-line Table 2.
Discussion
The utility of FDG-PET in glioma was reported in 1982 by Di Chiro et al,15 followed by many reports confirming that FDG-PET is indeed useful for detection, grading, and prognostication for gliomas.8,16⇓⇓⇓⇓⇓⇓–23 On the other hand, MET PET was first reported in 1983 by Bergström et al24 as a useful imaging technique to delineate glioma. Because MET PET has a low normal cortical uptake and high uptake in gliomas, this method has been considered superior to FDG-PET for delineation of the lesion.25⇓–27
However, reports on grading and prognostication of gliomas by MET PET have been conflicting. Some reports have claimed that FDG-PET is better for grading and prognostication than MET PET,26,28⇓–30 while others have claimed otherwise.27,31⇓–33 In theory, accumulation of MET is influenced not only by specific carrier-mediated uptake but also by passive diffusion in areas with a disrupted blood-brain barrier,34⇓–36 while background normal cortical uptake of the tracer markedly interferes with accumulation of FDG in brain tumors. One possible reason for the above-mentioned controversy could be the patient populations analyzed in those studies, in which both enhancing and nonenhancing tumors were analyzed together.26⇓⇓⇓⇓⇓⇓–33 Moreover, from a clinical point of view, because contrast enhancement is one of the hallmarks of high-grade tumor, the most important clinical question to be answered would be the tumor grade in nonenhancing tumors, in which tumor grading is difficult by using conventional MR imaging alone.
When analysis was restricted to nonenhancing glioma by using a semiautomatic T2/FLAIR-based VOI segmentation, the presented results clearly proved the superb performance of MET PET for tumor grading (Figs 2⇑–4 and Tables 1 and 2). Receiver operating characteristic analysis further revealed that T/Nmax of MET PET was most efficient in extracting grade III gliomas among nonenhancing gliomas, with an area under the curve of 0.83 (Fig 4 and Table 2). These findings imply that MET PET could be a valuable noninvasive radiologic tool for making significant clinical judgments for nonenhancing gliomas because preoperative identification of grade III gliomas would justify clinicians putting those patients into radical treatment rather than biopsy or observation of the tumor. The considerable overlap of MET T/N between grade II and III gliomas (Fig 3), however, mandates cautious interpretation of MET PET to supplement conventional MR imaging for grading of nonenhancing gliomas. On the other hand, FDG-PET was not useful in this respect (Figs 2⇑–4 and Tables 1 and 2).
Similar to FDG-PET, ADC obtained from DTI was also incompetent to distinguish both grade II and III nonenhancing gliomas (Tables 1 and 2). Because glioma grading by using DTI can be heavily affected by the method used for VOI or ROI design,7,9,37,38 it could be that T2/FLAIR-based semiautomatic MR imaging intensity-based VOI segmentation was not sensitive for this purpose. Further investigation is indeed necessary to clarify the impact of the method used for VOI segmentation on analysis of both PET and MR imaging.
Finally, no significant difference in PFS was seen between grade II and III gliomas in our cohort. In the Long-Term Efficacy of Early versus Delayed Radiotherapy for Low-Grade Astrocytoma and Oligodendroglioma in Adults trial, a randomized controlled trial comparing early-versus-delayed radiation therapy for low-grade gliomas, median PFS was 5.3 years in the early radiation therapy group and 3.4 years in the delayed group.39 Among grade III gliomas, on the other hand, median PFS was reported as 7.6–36 months for patients treated by radiation therapy and chemotherapy and 13–18 months for patients treated by using radiation therapy alone.40⇓⇓⇓⇓–45 Considering that all except 3 patients with grade II gliomas were followed postoperatively with careful observation alone and that all except 1 patient with a grade III glioma were treated by using both radiation therapy and chemotherapy, PFS of our cohort for grade II and III gliomas seems to be in range with past studies. Early intervention by adjuvant therapy against grade III gliomas could have prolonged PFS of patients with grade III gliomas to a similar level of grade II gliomas. More important, MET PET was prognostic of PFS not only in all patients with nonenhancing gliomas but also in patients without adjuvant therapy; this outcome makes MET PET a potential prognostic imaging biomarker for nonenhancing gliomas.
Limitations of our study should also be noted. The present study compared radiologic with pathologic tumor grading under the assumption that correct pathologic diagnosis was obtained. Because there was only 1 patient in this cohort who was diagnosed as having grade II glioma by biopsy, it is highly unlikely that tissue-sampling error has occurred in our analysis. Possible pathologic undergrading, however, should always be considered, even if the tumor has been largely resected. Another limitation is in PFS analysis. Many potentially confounding factors influence PFS, such as age, extent of removal, histopathologic subtype, and molecular prognostic biomarkers, as well as adjuvant therapy. Because it has become clear that grade II and grade III gliomas exhibit different clinical courses according to their molecular subtypes,46,47 future studies should incorporate this information when conducting survival analysis on the basis of radiologic findings. Finally, prognostic values of imaging parameters should be analyzed not only with PFS but also with overall survival, which requires further future investigation.
Conclusions
MET PET holds promise as a noninvasive World Health Organization grading technique and prognostic imaging biomarker, offering valuable information in determining treatment strategy for nonenhancing gliomas, while FDG-PET or ADC offer little diagnostic and prognostic value.
Footnotes
Disclosures: Manbu Kinoshita—RELATED: Grant: Aichi Cancer Research Foundation, SENSIN Medical Research Foundation,* Life Science Foundation of Japan,* Japanese Foundation for Multidisciplinary Treatment of Cancer and Japan Society for the Promotion of Science KAKENHI (25462256).* Koji Takano—UNRELATED: Grants/Grants Pending: KAKENHI grant No. 26670642. Haruhiko Kishima—UNRELATED: Grants/Grants Pending: Grants-in-Aid for Scientific Research (T 26462207) from the Ministry of Education, Culture, Sports, Science and Technology of Japan. Yonehiro Kanemura—UNRELATED: Grants/Grants Pending: Kaneka Corp, Japan,* Comments: This is a research grant for stem cell technology. The author declares no conflicts of interest associated with this article; Patents (planned, pending, or issued): Kaneka Corp, Japan,* Comments: This is a patent for stem cell technology. The author declares no conflicts of interest associated with this article. *Money paid to the institution.
This investigation was supported by the Aichi Cancer Research Foundation, the SENSIN Medical Research Foundation, the Life Science Foundation of Japan, the Japanese Foundation for Multidisciplinary Treatment of Cancer, and Japan Society for the Promotion of Science KAKENHI (25462256).
Indicates open access to non-subscribers at www.ajnr.org
References
- Received March 2, 2015.
- Accepted after revision May 7, 2015.
- © 2016 by American Journal of Neuroradiology


Jump to section
Related Articles
Cited By...
- Prognostic Value of the Metabolic and Volumetric Parameters of 11C-Methionine Positron-Emission Tomography for Gliomas: A Systematic Review and Meta-Analysis
- Glioma Survival Prediction with Combined Analysis of In Vivo 11C-MET PET Features, Ex Vivo Features, and Patient Features by Supervised Machine Learning