
Abstract
BACKGROUND AND PURPOSE: Iron-mediated oxidative stress plays a pivotal role in the pathogenesis of amyotrophic lateral sclerosis. This study aimed to assess iron deposition qualitatively and quantitatively by using SWI and microstructural changes in the corticospinal tract by using DTI in patients with amyotrophic lateral sclerosis.
MATERIALS AND METHODS: Seventeen patients with amyotrophic lateral sclerosis and 15 age- and sex-matched controls underwent brain MR imaging with SWI and DTI. SWI was analyzed for both signal-intensity scoring and quantitative estimation of iron deposition in the anterior and posterior banks of the motor and sensory cortices and deep gray nuclei. The diffusion measurements along the corticospinal tract at the level of pons and medulla were obtained by ROI analysis.
RESULTS: Patients with amyotrophic lateral sclerosis showed reduced signal-intensity grades in the posterior bank of the motor cortex bilaterally. Quantitative analysis confirmed significantly higher iron content in the posterior bank of the motor cortex in patients with amyotrophic lateral sclerosis. In contrast, no significant differences were noted for the anterior bank of the motor cortex, anterior and posterior banks of the sensory cortex, and deep nuclei. Receiver operating characteristic comparison showed a cutoff of 35μg Fe/g of tissue with an area under the curve of 0.78 (P = .008) for the posterior bank of the motor cortex in discriminating patients with amyotrophic lateral sclerosis from controls. Fractional anisotropy was lower in the pyramidal tracts of patients with amyotrophic lateral sclerosis at the pons and medulla on either side, along with higher directionally averaged mean diffusivity values. The combination of SWI and DTI revealed an area under the curve of 0.784 for differentiating patients with amyotrophic lateral sclerosis from controls.
CONCLUSIONS: Measurements of motor cortex iron deposition and diffusion tensor parameters of the corticospinal tract may be useful biomarkers for the diagnosis of clinically suspected amyotrophic lateral sclerosis.
ABBREVIATIONS:
- ALS
- amyotrophic lateral sclerosis
- CST
- corticospinal tract
- Dav
- directionally averaged mean diffusivity
- FA
- fractional anisotropy
- PBMC
- posterior bank of the motor cortex
Amyotrophic lateral sclerosis (ALS) is a fatal neurodegenerative disorder of the motor system characterized by progressive degeneration of corticospinal tracts, brain stem, and lower motor neurons in the spinal cord.1,2 The clinical presentation of ALS includes progressive involvement of the upper motor neuron, lower motor neuron, and craniobulbar musculature due to degeneration of the anterior horn cells and motor neurons. The disease shows great variation in its onset, clinical presentation, and survival, with diagnosis usually depending on changes in needle electromyography from various muscles sampled, which include even the tongue and paraspinal muscles. Needle electromyography is invasive and rather cumbersome to perform. Hence, a reliable and objective noninvasive surrogate biomarker of motor neuron dysfunction, if available, may play a pivotal role in the diagnosis and monitoring of disease progression in ALS.
Recent investigations proved that ALS pathology is associated with abnormal iron homeostasis inducing excessive oxidative stress in the motor neurons.3,4 There is also evidence to suggest that reduced fractional anisotropy (FA) and increased directionally averaged mean diffusivity (Dav) along the pyramidal tracts indicate microstructural tissue changes in ALS.5⇓–7 Hence, detection of elevated iron levels in the motor cortex and associated corticospinal tract (CST) degeneration in these patients could be useful for demonstrating the underlying pathology.
MR imaging techniques that can quantify this tissue iron include T2, T2*, magnetic field correlation, field-dependent relaxation rate increase, and SWI.8⇓⇓⇓⇓⇓–14 Recent studies advocated SWI as a potential in vivo marker to detect susceptibility changes among tissues, which aids in the identification of paramagnetic nonheme iron (ferritin and transferrin), which would appear hyperintense on filtered phase images.15⇓⇓–18 These finding opened a new window to estimate the regional changes in iron content associated with ALS. The aim of this study was to measure iron in various GM regions in ALS by using qualitative and quantitative SWI and to investigate the microstructural tissue changes in CST by DTI.
Materials and Methods
Study Participants
The study was approved by the Institutional Ethics Committee. Seventeen patients (7 men and 10 women) with definite or probable ALS according to revised EI Escorial criteria19 were included in this retrospective analysis. All had undergone a detailed clinical and psychometric evaluation to exclude any associated neurologic conditions. We have subclassified the cohort (On-line Table) according to the latest phenotypic classification of ALS by Chiò et al,20 though the staging proposed by Roche et al21 was not possible in this retrospective cohort. Clinical and imaging data were retrieved from the electronic medical records and PACS, respectively. Imaging and demographic data of 15 age- and sex-matched healthy volunteers (8 men, 7 women) were also included from another prospective Institutional Ethics Committee–approved study (R. Sheelakumari, MPhil, unpublished data, 2014).
Image Acquisition
MR imaging was performed on a 1.5T (Avanto; Siemens, Erlangen, Germany) whole-body scanner by using a transmit-receive head coil array with 12 elements. All participants had undergone multisection diffusion tensor imaging by using a single-shot spin-echo echo-planar sequence. For the acquisition, diffusion sensitizing gradients were applied in 30 noncollinear directions with the following imaging parameters: TR, 6000 ms; TE, 88 ms; matrix, 128 × 128; FOV, 230 mm; 3-mm section thickness with a 1.5-mm gap averaged twice with b-values of 0 and 1000 s/mm2.
SWI was obtained with a 3D spoiled gradient recalled-echo sequence (TR/TE, 49 ms/40 ms; flip angle, 20°; section thickness, 2.1 mm; number of sections, 56; matrix, 260 × 320). We selected both SWI and corrected phase images for the analysis. In the corrected phase images, there is a direct correlation between the phase and iron content of the tissue.
For left-hand MR systems, the phase is given by the following relation:
 where γ, ΔB, TE represents the gyromagnetic ratio, the magnetic field change between tissues, and echo time, respectively. Iron being a paramagnetic element, it aligns with the main magnetic field and thus creates a positive ΔB. Thus, the larger the iron content in the tissue, the larger will be the value of ΔB and thus the larger the phase change ϕ will be relative to its surroundings.
 where Δχ is the change in susceptibility and c is the concentration of iron.
Our MR imaging processing uses the phase convention
 where Φ varies from −π to +π and φ varies from 0 to 4096. We take 180 U (0.276 radians) of phase to be equivalent to 60 μg Fe/g of tissue.13,15 The iron content is then given by the relation
 A simplification of the above equation shows that 3 Siemens phase units are equal to 1 μg Fe/g tissue.14,15 The phase images obtained were high-pass-filtered by a 64 × 64 k-space filter and resulted in an SWI filtered phase image.
Image Analysis
Qualitative Assessment of SWI.
All the SWI was visually examined in the regular clinical settings by an experienced neuroradiologist (B.T.) and a neurologist (A.R.) with >15 years of experience in their respective fields. Qualitative visual rating scores were assigned at the posterior bank of the motor cortex (PBMC), globus pallidus, putamen, and caudate nucleus. The central sulcus was used as an anatomic landmark to identify the motor cortex. Each observation was independent and blinded to the diagnosis (patients or controls). The magnitude of hypointensity was graded as 0 = absent, 1 = present (mild to moderate), 2 = present (marked) (Fig 1).
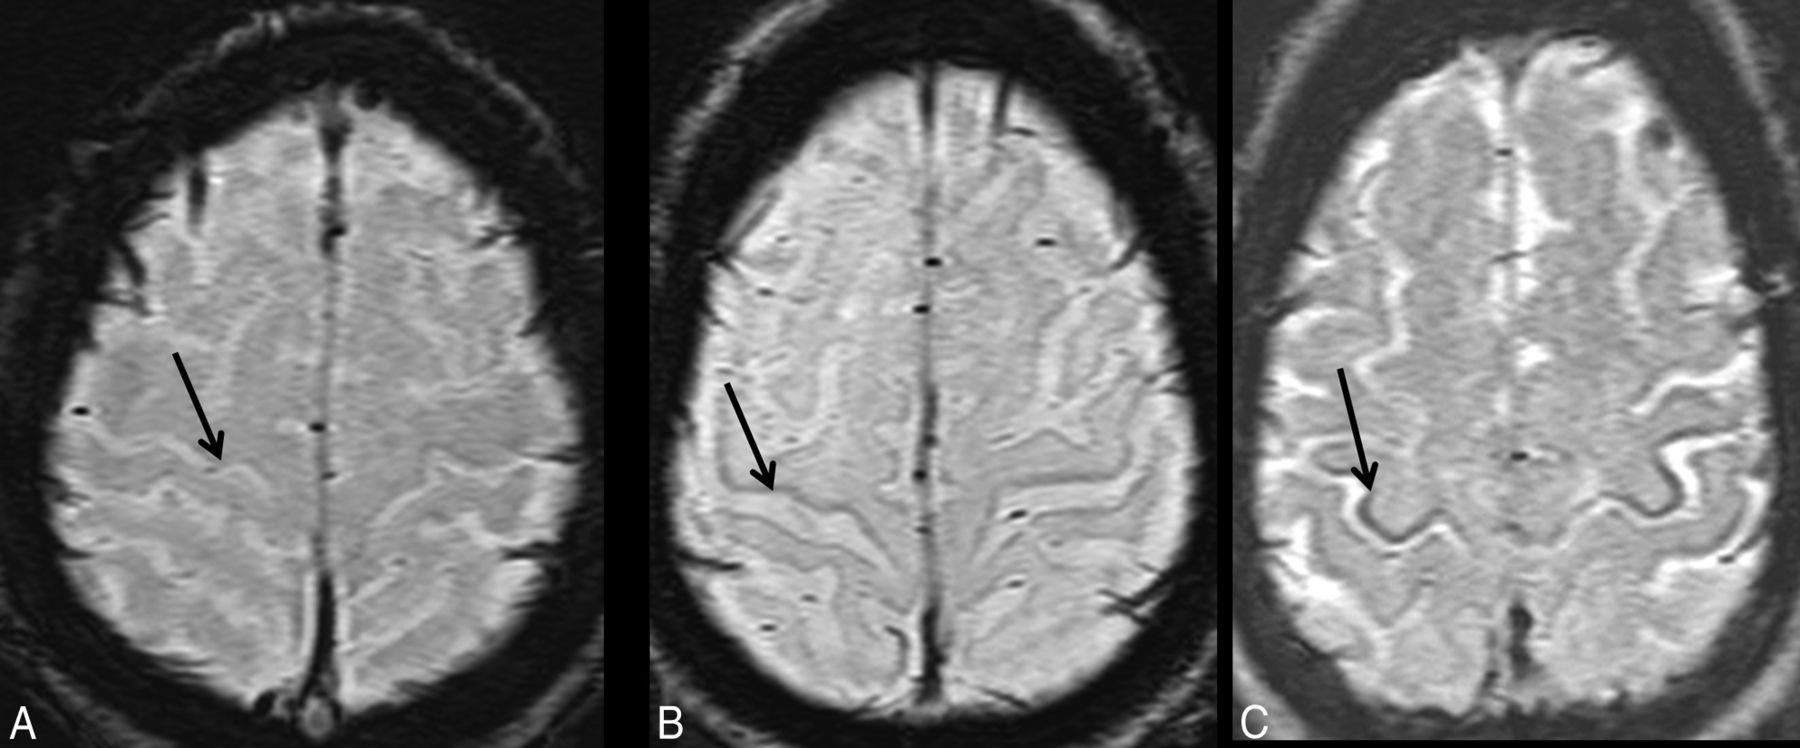
Motor cortex hypointensity visual scoring on SWI: absent (grade 0) (A), mild to moderately present (grade 1) (B), and severely present (grade 2) (C).
Quantitative Regional Assessment of Iron Content (Microgram Iron/Gram of Tissue).
ROI-based quantitative analysis of regional iron (Fe) content was performed by using Signal Processing In NMR software (SPIN; MR Imaging Institute for Biomedical Research, Detroit, Michigan). The ROIs were drawn manually by 2 doctoral scholars (R.S. and M.M.), who were trained in the procedure. The images were magnified 2 times, and the phase values obtained from 9 structures in both hemispheres included the following: GM at the PBMC, adjacent subcortical WM and CSF in the central sulcus, GM of anterior bank of the motor cortex, anterior bank of the sensory cortex, posterior bank of the sensory cortex, and basal ganglia regions (On-line Fig 1), with extreme care to minimize partial volume effects. For all the subjects, phase values were measured by the 2 observers to determine the interobserver agreement.
The ROIs were copied to phase images to obtain the mean phase shift values within. To compare data across patients, we assumed that the CSF in each patient contained zero iron.14 Thus the iron content in an ROI was directly proportional to the shift in phase between the CSF and the particular ROI. Mean phase shift values were calculated for each ROI by averaging the values obtained from both hemispheres.
DTI ROI Analysis of CST.
DTI data were transferred to a Leonardo workstation (Siemens) and postprocessed with Neuro3D software (Siemens). The off-line tensor images and color maps were generated by using the built-in “DTI Task Card” (Version 1). T1-weighted images were coregistered on the color maps for selecting the ROI in the specific anatomic region. The datasets were then analyzed by 2 observers blinded to patients or controls. On the basis of the prior anatomic knowledge and relevant literature,5,22 2 circular ROIs of same size, 3 mm2, were placed along the CST on FA and Dav maps in the brain stem at the level of cerebellar peduncles and medullary pyramids (On-line Fig 2); care was taken to exclude non-structure-of-interest pixels. The FA and Dav values were calculated on a pixel-by-pixel basis, and average values for each position on both sides were tabulated for statistical analysis.
Statistical Analysis
Statistical analyses of all datasets were performed by using SPSS, Version 20.0 (IBM, Armonk, New York). We used the Student t test and χ2 test, respectively, to compare age and sex distributions between patients and controls. Interrater agreement of visual scoring of the hypointensity of gray matter on SWI was determined by κ statistics. To investigate whether the visual rating is effective to discriminate between groups of hypointensity scores on SWI (absent versus present, ie, group 0 versus groups 1 + 2), we performed sensitivity and specificity analysis by using crosstabs. Analyses were also repeated for the absent or mild to moderately present group versus the markedly present group (ie, 0 + 1 versus group 2). The combined hemispheric mean values of iron in micrograms/gram and FA and Dav values of each ROI were compared between subjects with ALS and controls by using the Mann-Whitney U test for independent samples with Bonferroni correction for multiple comparisons. In addition, we compared the estimated means of iron values in the posterior motor cortex with the visual rating score by using 1-way ANOVA. Furthermore, the correlation between quantitative iron and diffusion values in the CST was performed by the Pearson correlation coefficient. In addition, receiver operating characteristic analysis curves were computed to calculate the cutoff values of iron in the motor cortex in distinguishing patients and controls. To establish a best cutoff value, we considered a value that presented with the highest sum of sensitivity and specificity. Finally, a combined receiver operating characteristic was obtained with SWI and DTI measures [iron + {(1-FA) + ADC}].
Results
Subject Characteristics
Patients were in the age range of 32–76 years (mean, 54.41 ± 13.99 years), and controls were 45–75 years of age (mean, 56.8 ± 8.28 years). Patients and controls were comparable in age (P = .551) and sex (P = .492). The average age at onset of ALS was 51.94 years. The demographic and clinical information of the patients is shown in On-line Table 1.
Visual Rating Measurements of the Motor Cortex
Between the 2 observers in SWI, visual scoring for hypointensity showed excellent agreement for PBMC (κ = 0.97, P < .001), while other regions such as the caudate nucleus (κ = 0.75, P < .001), putamen (κ = 0.75, P < .001), and globus pallidus (κ = 0.7, P < .001) also revealed good interrater agreement.
Sensitivity and Specificity Analysis
The visual assessment of hypointensity scores in the PBMC was highly sensitive (91.15%) in differentiating patients with ALS from healthy controls while considering absent-versus-present groups. However, the specificity was less (13.35%) when the magnitude of hypointensity was considered this way. Similar analysis between the absent/mild to moderately present versus the markedly present group showed 100% specificity but very low sensitivity (20.55%). There was no statistically significant correlation among Fe scores in other GM regions.
Quantitation of Regional Iron Deposition in Gray Matter Structures
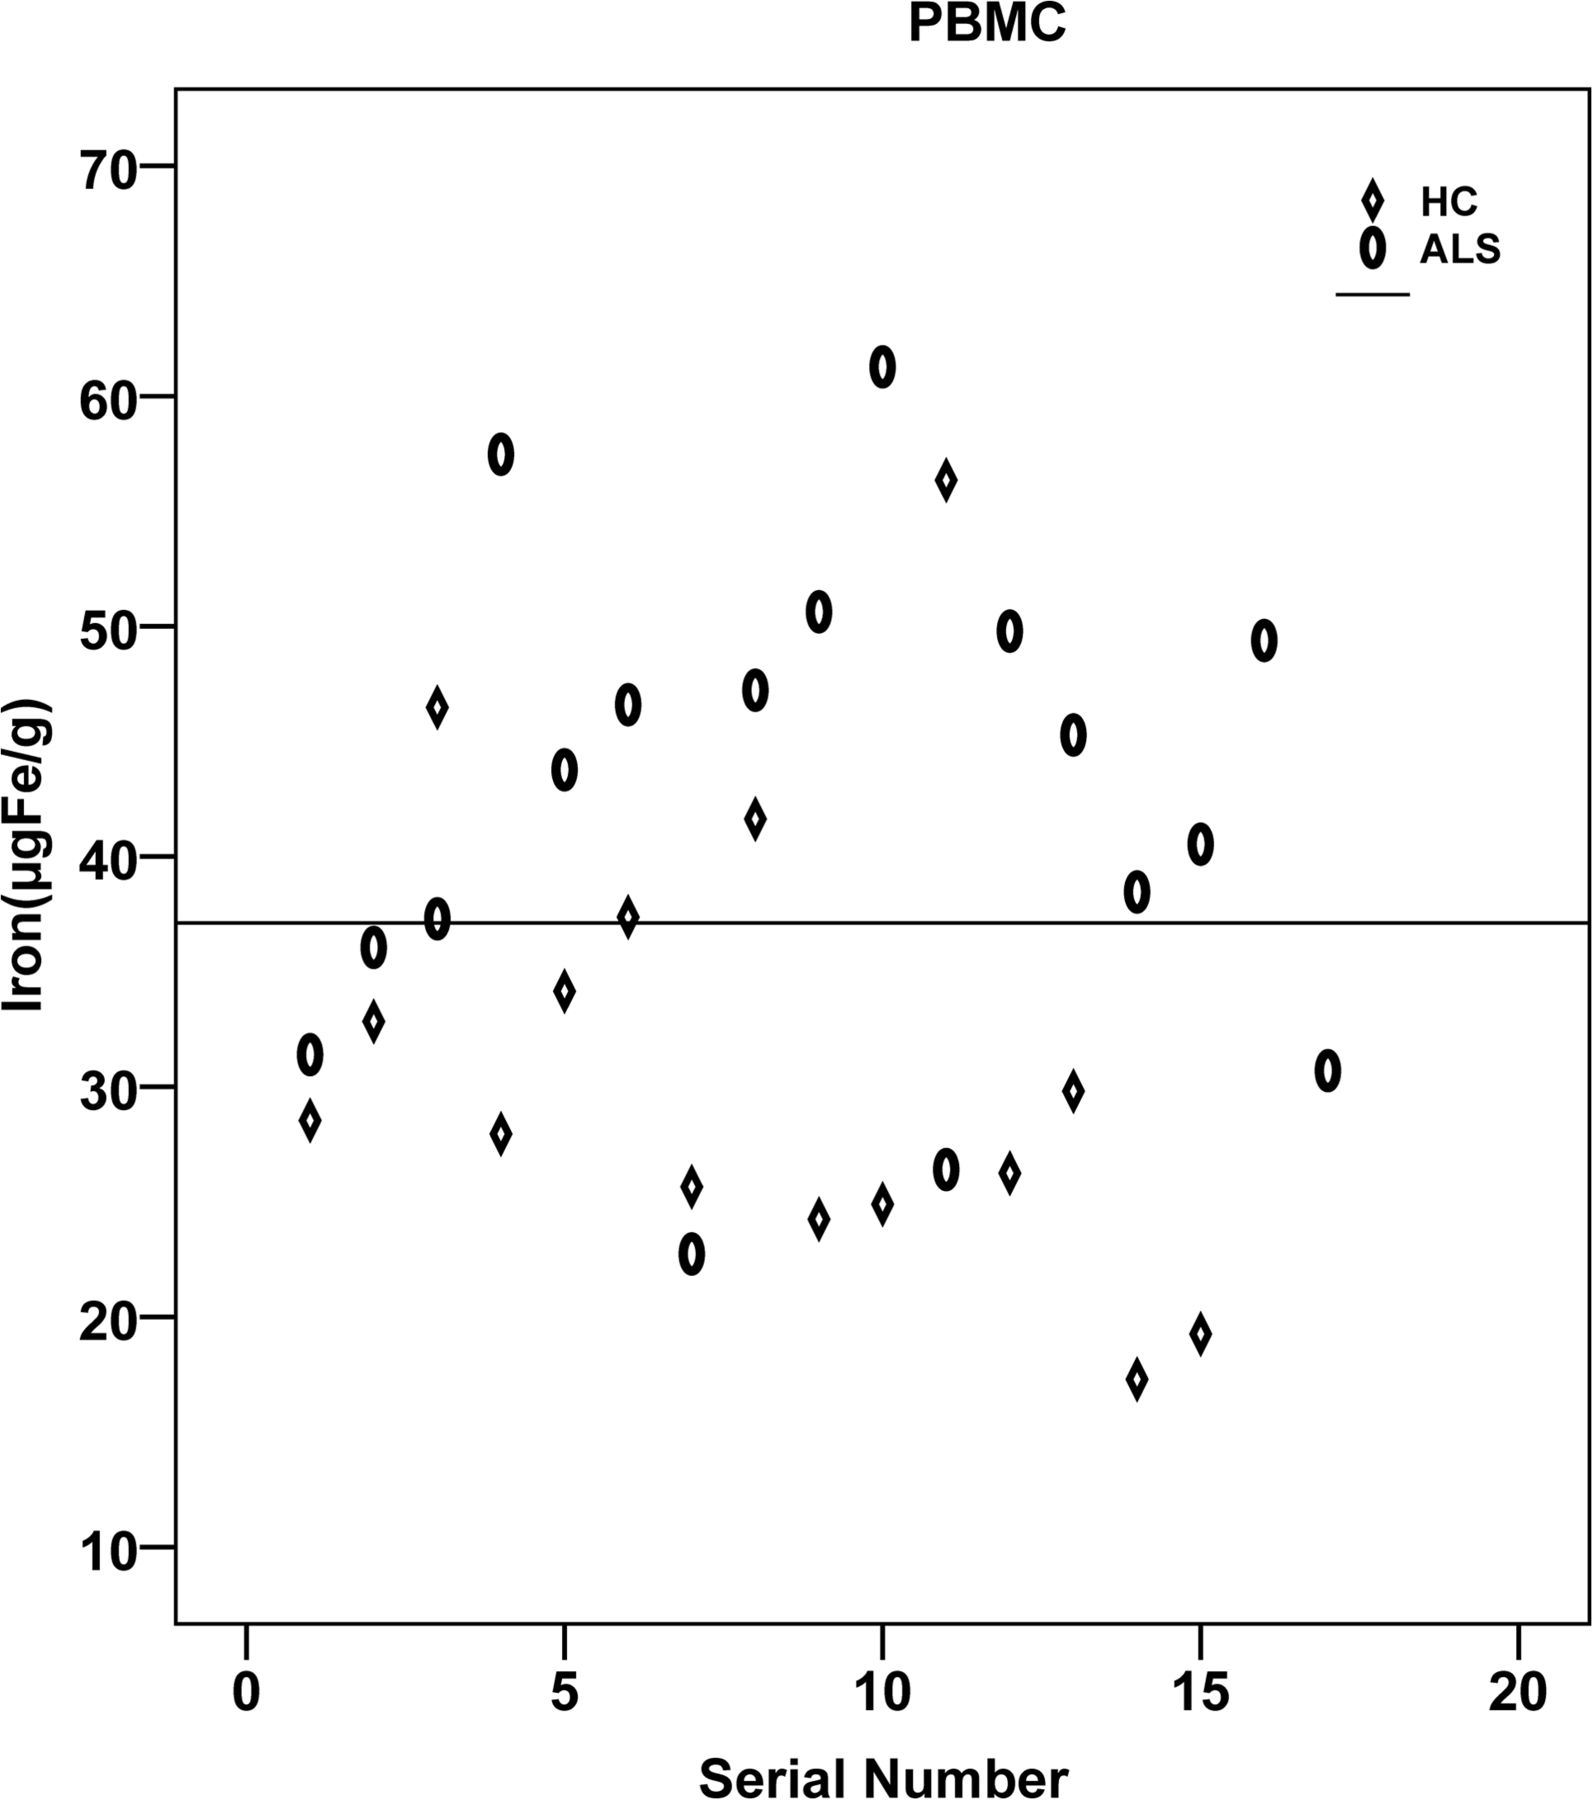
The regional assessment of iron content (micrograms iron/gram of tissue) in various gray matter regions revealed significantly increased iron deposition in the PBMC (P = .007) in patients with ALS compared with controls (Figs 2 and 3). However, the iron deposition in the anterior bank of the motor cortex, anterior bank of the sensory cortex, posterior bank of the sensory cortex, globus pallidus, putamen, and caudate nucleus, though higher than that in the control group, was not statistically significant (Table 1). One-way ANOVA of estimated means of iron values, and the visual rating score in the PBMC also revealed a significant difference between groups (P = .004).

Distribution of iron content in the posterior bank of the motor cortex plotted for patients and controls. HC indicates healthy controls.

Boxplot showing group comparison of iron content in the posterior banks of motor cortex in patients and controls. HC indicates healthy controls.
Iron content (μg Fe/g of tissue) of each ROI in the ALS and control groupsa
Diffusion Measurements of the Corticospinal Tract
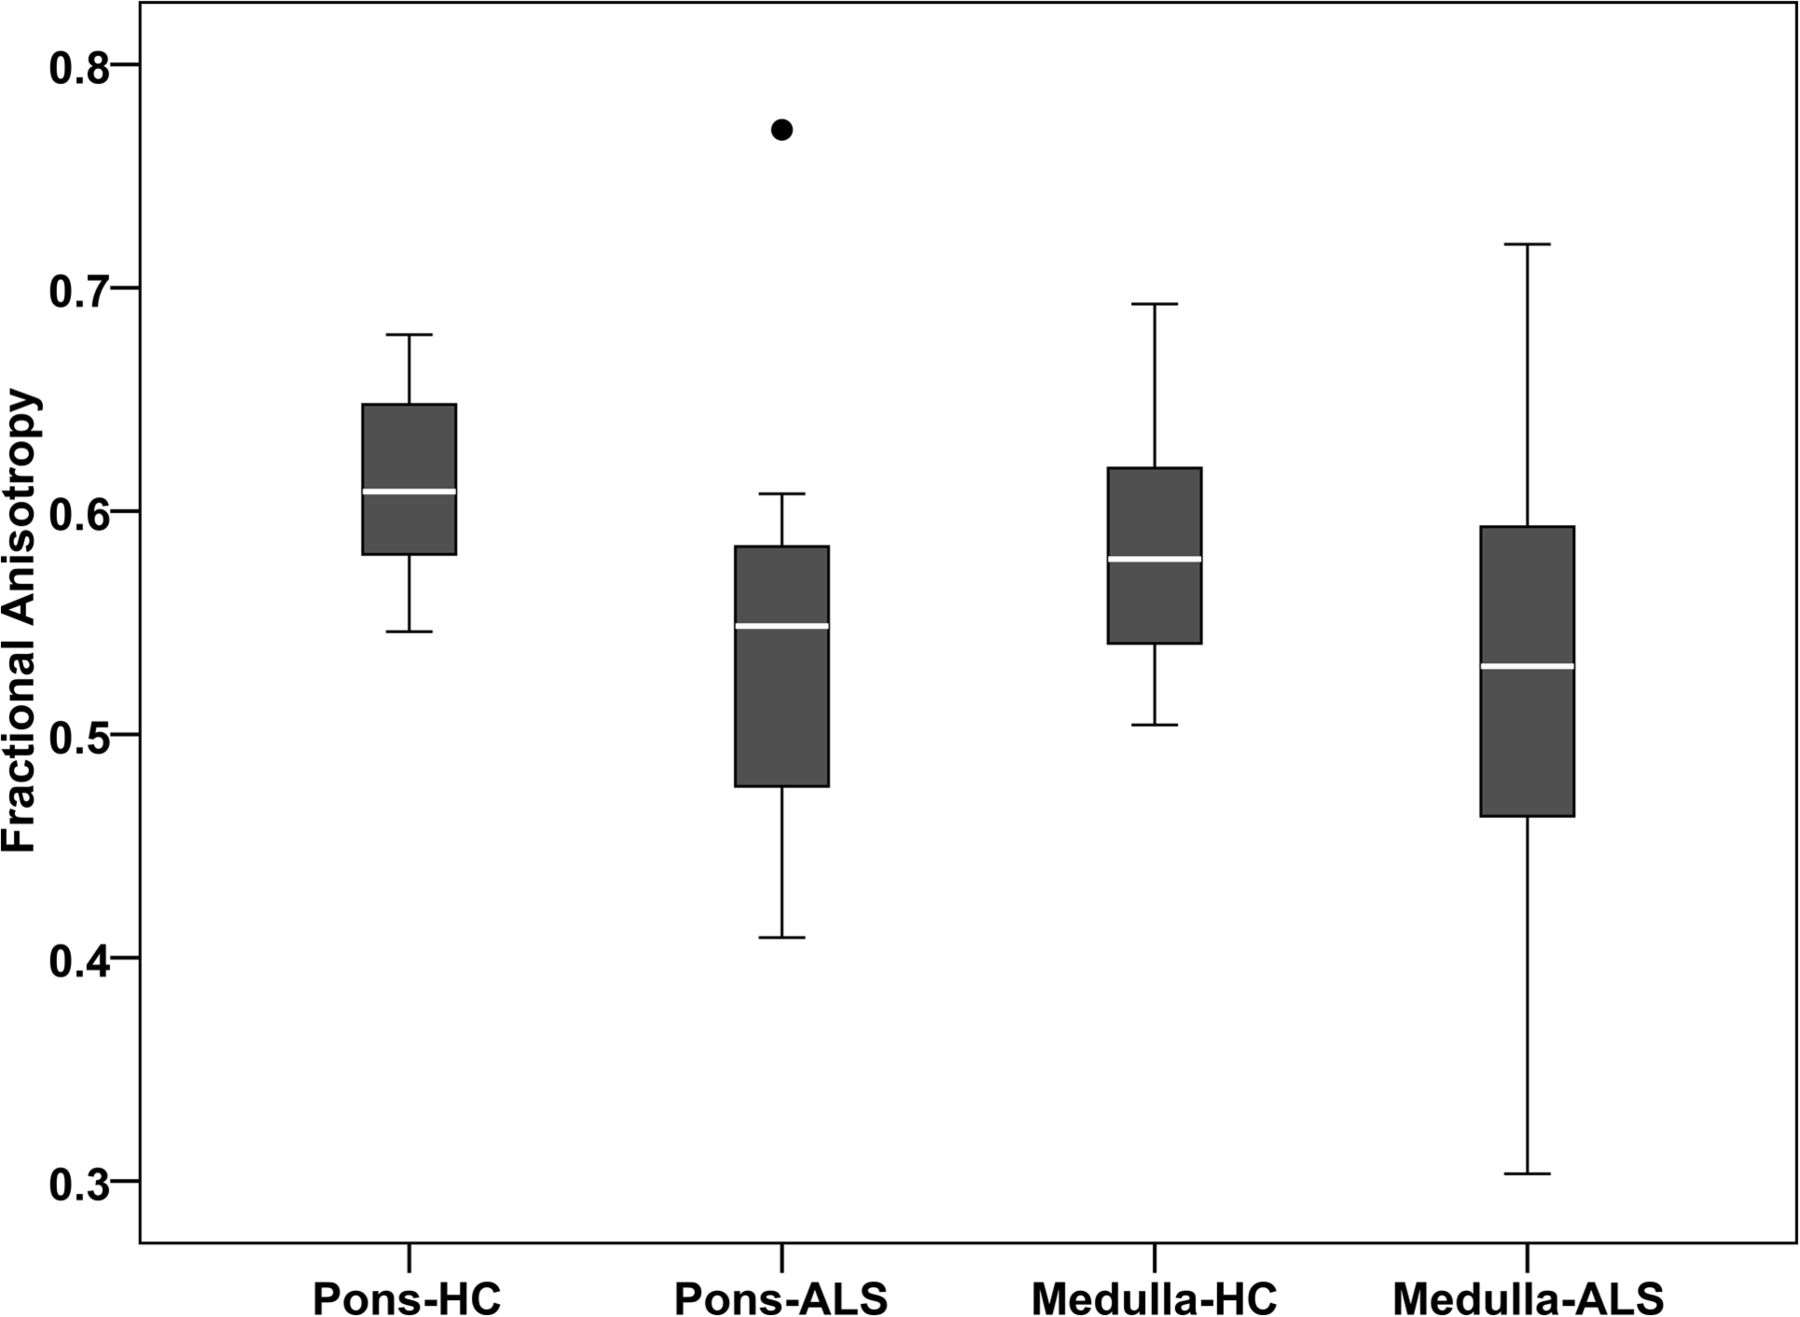
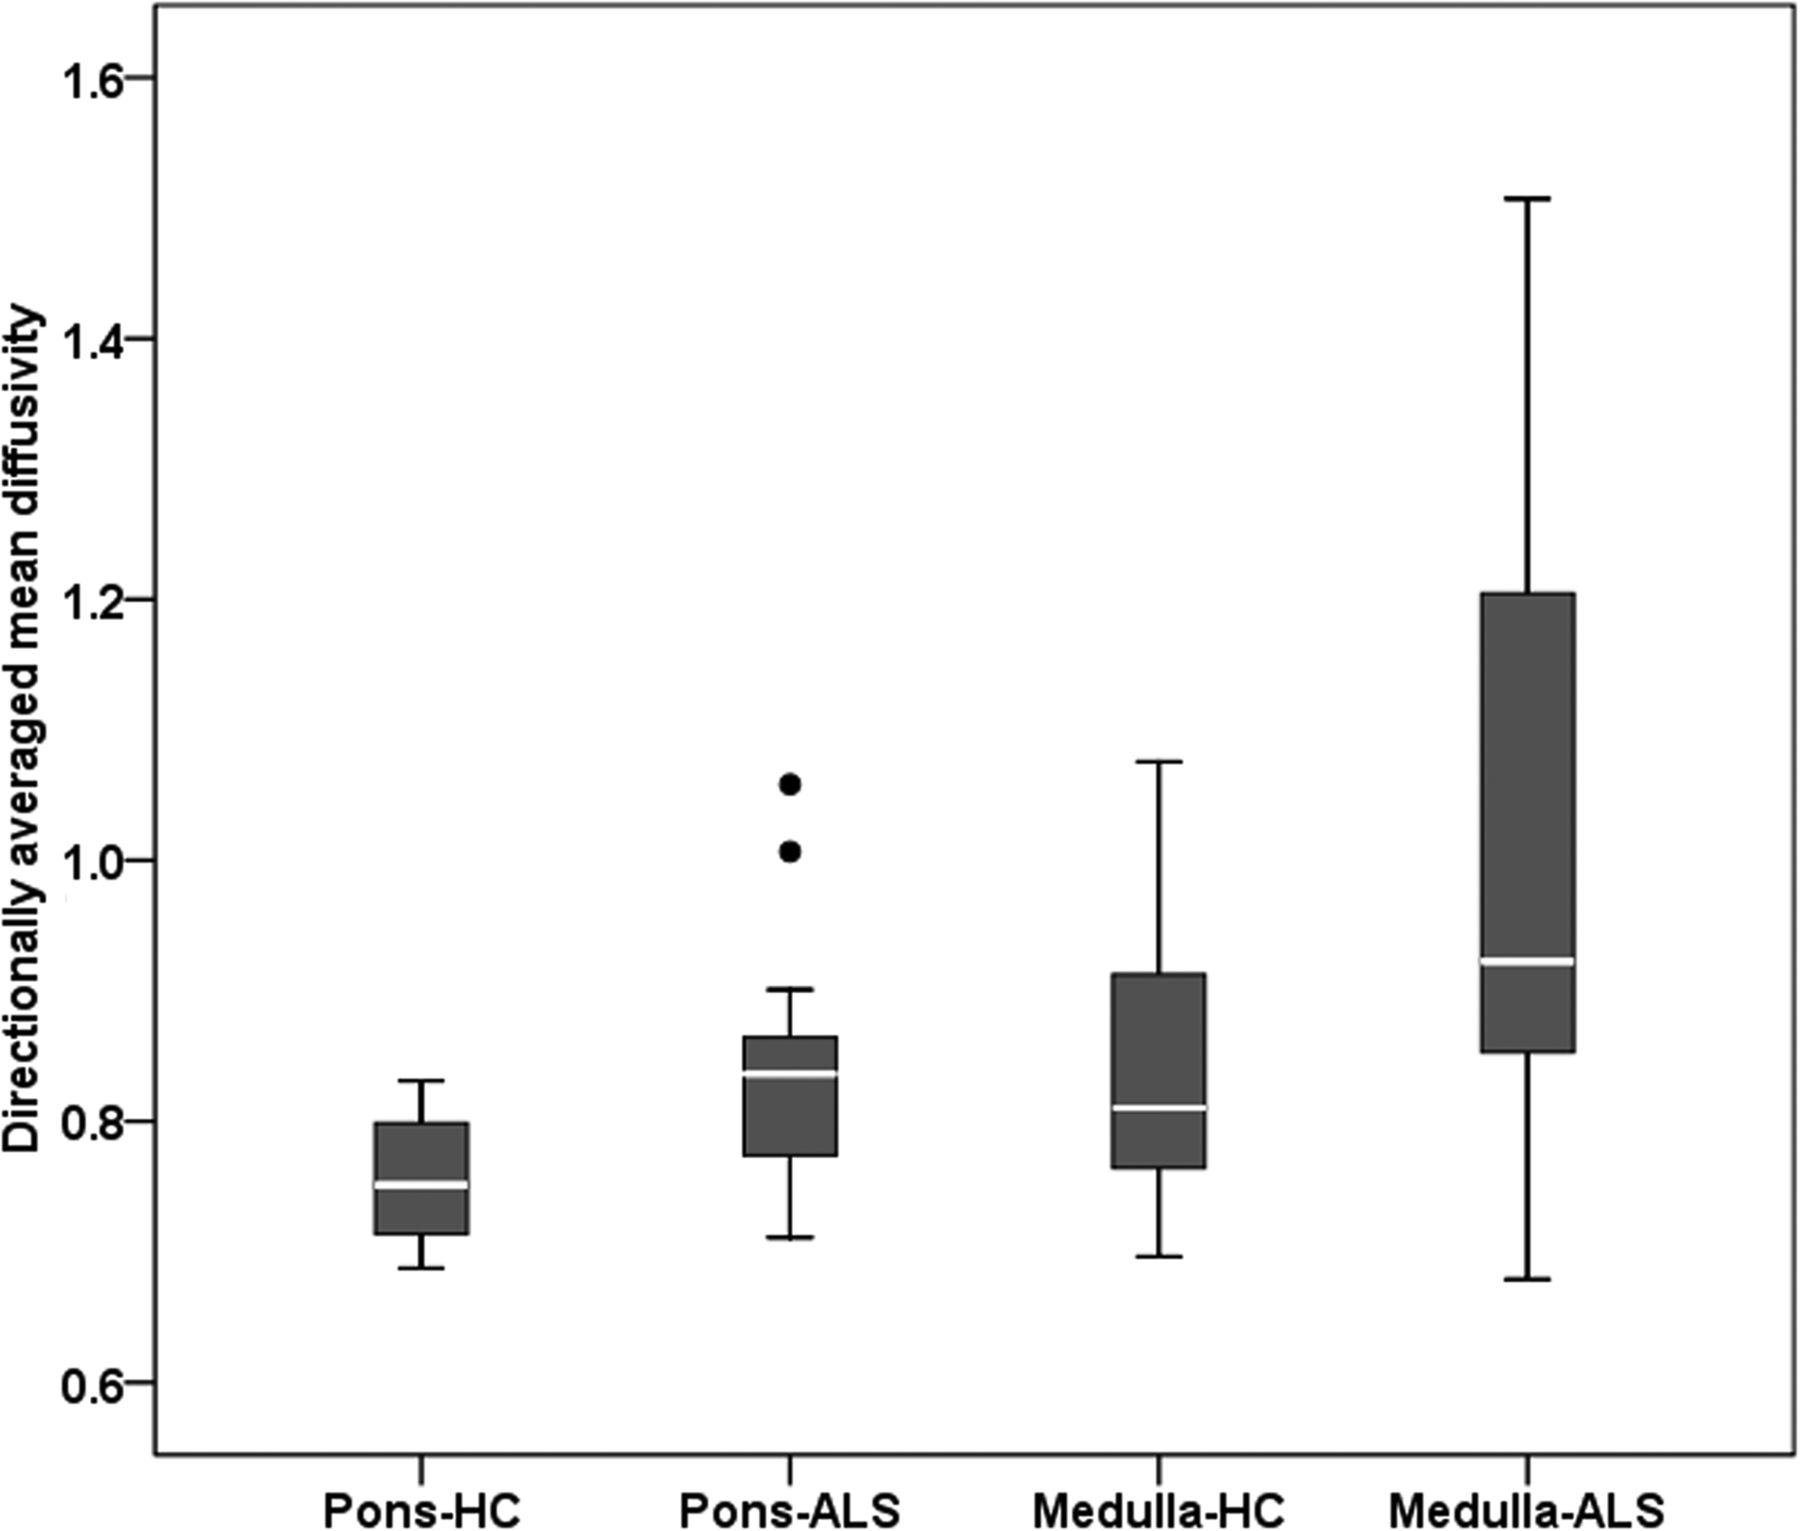
The mean values of FA and Dav for patients with ALS and controls at various levels of the CST are shown in Table 2. Patients with ALS showed lower FA values than controls along the CST in the pons (P = .001). A similar trend was observed for the medullary pyramid (Fig 4), though this did not survive after multiple comparisons. In addition, the Dav values were significantly elevated in the pons (P = .003) and pyramid (P = .011) (Fig 5). No significant correlation was found in any of the ROIs between the amount of iron deposition and FA values in the CST. A similar pattern was observed between Dav and iron values.
Diffusion property measurement of corticospinal tract by ROI analysisa

Boxplot showing group comparison of fractional anisotropy along the corticospinal tracts at the levels of pons and medulla. HC indicates healthy controls.

Boxplot showing group comparison of directionally averaged mean diffusivity (×10−3 mm2/s) along the corticospinal tracts at the levels of the pons and medulla. HC indicates healthy controls.
Receiver Operating Characteristic Curve Analysis
The receiver operating characteristic curve analysis predicted the cutoff of iron in the PBMC and FA values. Identification of the greatest sum of sensitivity and specificity determined an iron value of ≥35 μg Fe/g of tissue as the best cutoff value for the PBMC, with a sum of sensitivity and specificity of 149% and area under the curve = 0.78 (95% CI, 0.61–0.94; P = .008). Of the 17 patients, 13 presented with an iron content of ≥35 μg Fe/g of tissue for the PBMC. Of the values of the 15 controls, only 4 were at or above the cutoff for the PBMC. When DTI measurements were added to SWI, only marginal improvement was observed in the area under the curve = 0.784 (95% CI, 0.62–0.95; P = .006) with a sum of sensitivity and specificity of 150.6% (Fig 6).

Receiver operating characteristics curve for the combined SWI in the PBMC and DTI values in the CST.
Discussion
In this study, we qualitatively and quantitatively assessed the putative iron content in various gray matter structures, especially the motor cortex of the brain in patients with ALS in conjunction with microstructural changes along the CST by using SWI and DTI, respectively. A few earlier cross-sectional studies have investigated the phase differences between tissues in a number of regions of the human brain as a means of detecting iron abnormalities and CST degeneration by using MR imaging separately. To the best of our knowledge, no previous studies have performed the simultaneous assessment of brain iron content in the motor cortex and the changes in the CST by using SWI and DTI together.
It is well-known that degenerative brain disorders like Alzheimer disease,23 Parkinson disease,16 multiple sclerosis,24 and ALS have been associated with region-specific iron accumulation.25 Increased iron deposition in the motor cortex of patients with ALS has been proved in histologic analysis,26 MR imaging studies,17 and postmortem examinations.27 Conventional MR imaging sequences such as FLAIR,28 T2-weighted,29 proton-density weighted,30 and magnetization transfer imaging have revealed signal-intensity changes and a reduced magnetization transfer ratio31 in the internal capsule in patients with ALS. However, the clinical utility of these techniques in individual patient management is questionable.32 Advanced imaging techniques like MR spectroscopy33 and DTI have shown a significantly reduced NAA-to-creatine ratio and FA at various locations of CST, respectively,34 in patients with ALS. In ALS, the signal alteration in the deeper layers of the motor cortex is correlated with accumulation of iron-laden microglia. The microglial cells in the motor cortex play a vital role in maintaining iron homeostasis, and enhanced microglial iron accumulation leads to the pathologic changes in ALS. In addition, excessive iron deposition in the motor cortex is considered a marker of disruption in the regulatory pathways of iron in the brain. Approximately 20% of familial ALS is caused by mutations in the superoxide dismutase gene. Earlier observations confirmed such findings in which elevated levels of ferritin transcripts were found in the SOD1G93A mouse model.35 Moreover, lines of evidence indicate the presence of polymorphism in HFE genes and increased expression of the H63D variant of HFE genes with abnormal ion metabolism contributing to ALS pathology.36
Compared with other imaging sequences, SWI is more robust and has been shown to provide sensitive measures of iron on the order of micrograms iron/gram of tissue. Adachi et al17 proved the supremacy of SWI to detect the iron deposition in the precentral cortex in ALS. They described much lower signal intensity on SWI than on T2- and T2*-weighted images and proved the presence of Fe-laden microglia and macrophages in the precentral cortex after staining with antiferritin antibody. A more recent analysis of DTI data by using tract-based spatial statistics determined reduced FA at the distal portion of CST in patients with ALS compared with those with primary lateral sclerosis. Regional analysis of diffusion characteristics along the CST in ALS revealed a marked reduction of FA values at the levels of the internal capsule and pyramids.37
We performed the visual assessment of hypointensities in patients with ALS as a measure of iron deposition in ALS, to analyze its clinical utility as a quick visual imaging tool to differentiate patients with ALS from age-matched healthy individuals. The hypointensity scoring in bilateral PBMC regions was found to be highly sensitive in differentiating patients with ALS from individuals with normal brains. The overall specificity was, however, low, but it improved once severe hypointensity was considered for the diagnosis of ALS. We also found no significant difference between the visual rating of Fe content in patients with ALS and controls in the caudate nucleus, putamen, and globus pallidus regions. To confirm these results and to make it more objective, we performed a quantitative analysis of iron content in terms of phase shift values in the motor cortex and basal ganglia regions. Our observations of significantly increased iron accumulation in the motor cortex of patients with ALS are in agreement with recent findings.12 However, no significant differences were noted between patients with ALS and controls in other regions, including the anterior motor and sensory cortices, posterior sensory cortex, globus pallidus, putamen, and caudate nucleus. Yu et al,12 who used the phase shift values of SWI by a 3T scanner, found that there was no difference in the iron levels in the globus pallidus, putamen, head of caudate nucleus, substantia nigra, and red nucleus in patients with ALS compared with controls. In contrast, a previous study by R2* mapping reported increased iron deposition in the caudate nucleus of patients with ALS compared with age- and sex-matched controls.1
Besides iron deposition in the PBMC, there were significantly reduced FA and increased Dav in the CST of patients with ALS compared with controls,5,38,39 and the pattern was maintained from the pons to the medulla. When one considered multiple comparisons, the significance of FA in the medulla disappeared due to lack of statistical power. A previous report showed significant changes in FA and Dav in the bulbar-onset groups and correlated FA changes with measures of disease severity and the upper motor neuron index.40 It is evident that FA is highly variable among the sections of the pons and medulla.39 Increased Dav probably detects striking and chronic changes at these levels.
No correlation was found between regional iron values and any of the diffusion characteristics. The exact cause of this remains unexplained; however, they might represent relatively independent processes of degeneration within the natural course of the disease progression. Hence, we think that combined assessment of iron deposition and diffusion characteristics might be useful as a potential biomarker for the diagnosis and characterization of motor neuron diseases. However, this needs confirmation with future prospective studies.
The present study has a few limitations. These results were established in a relatively small cohort of clinically probable cases of ALS in this retrospective study, but a higher sample size would have contributed further to the validity. Second, this was a cross-sectional image-analysis study of patients with various clinical presentations in differing stages of the disease; hence, it is unable to provide details on the dynamic changes expected in correlation with the clinical progression of the disease. The data were from a 1.5T scanner, and better results could be expected on a 3T scanner by improving the SNR and susceptibility effects. Our results need to be confirmed in future prospective studies by using larger samples.
Conclusions
This study demonstrates the usefulness of analysis of SWI and DTI in estimating motor cortex iron deposition and CST changes in patients with ALS. Quantitative estimation showed abnormal brain iron deposition in the posterior bank of the motor cortex in patients with ALS. The diffusion characteristics suggest altered microstructural organization of the CST at different brain stem levels. However, no statistically significant correlation was found among these processes, suggesting their possible independent evolution. Hence, a combined analysis of them might provide meaningful insights into the pathophysiologic changes in ALS and can serve as an in vivo objective biomarker for the diagnosis of ALS. Moreover, combining multimodal neuroimaging techniques along with clinical, genetic, and pathologic markers is a promising way to understand the underlying disease mechanisms, which might lead to the development of more robust biomarkers for the diagnosis and staging of this disease. However, future longitudinal prospective studies are warranted to prove this.
Acknowledgments
We thank Dr Ravi Prasad Varma for his valuable suggestions on the statistical analysis.
References
- Received March 14, 2015.
- Accepted after revision July 9, 2015.
- © 2016 by American Journal of Neuroradiology


