
Abstract
BACKGROUND AND PURPOSE: Motor deficits in patients with brain tumors are caused mainly by irreversible infiltration of the motor network or by indirect mass effects; these deficits are potentially reversible on tumor removal. Here we used a novel multimodal imaging approach consisting of structural, functional, and metabolic neuroimaging to better distinguish these underlying causes in a preoperative setting and determine the predictive value of this approach.
MATERIALS AND METHODS: Thirty patients with malignant brain tumors involving the central region underwent a hybrid O-(2-[18F]fluoroethyl)-L-tyrosine–PET-MR imaging and motor mapping by neuronavigated transcranial magnetic stimulation. The functional maps served as localizers for DTI tractography of the corticospinal tract. The spatial relationship between functional tissue (motor cortex and corticospinal tract) and lesion volumes as depicted by structural and metabolic imaging was analyzed.
RESULTS: Motor impairment was found in nearly all patients in whom the contrast-enhanced T1WI or PET lesion overlapped functional tissue. All patients who functionally deteriorated after the operation showed such overlap on presurgical maps, while the absence of overlap predicted a favorable motor outcome. PET was superior to contrast-enhanced T1WI for revealing a motor deficit before the operation. However, the best correlation with clinical impairment was found for T2WI lesion overlap with functional tissue maps, but the prognostic value for motor recovery was not significant.
CONCLUSIONS: Overlapping contrast-enhanced T1WI or PET-positive signals with motor functional tissue were highly indicative of motor impairment and predictive for surgery-associated functional outcome. Such a multimodal diagnostic approach may contribute to the risk evaluation of operation-associated motor deficits in patients with brain tumors.
ABBREVIATIONS:
- CE
- contrast-enhanced
- CST
- corticospinal tract
- FA
- fractional anisotropy
- FET
- O-(2-[18F]fluoroethyl)-L-tyrosine
- KPS
- Karnofsky Performance Scale
- M1
- primary motor area
- nTMS
- navigated transcranial magnetic stimulation
- SPACE
- T2-weighted sampling perfection with application-optimized contrasts using different flip angle evolution
Multimodal imaging is a criterion standard in the diagnosis of brain tumors.1 The combination of anatomic, functional, and metabolic imaging by MR imaging and PET helps differentiate tumor tissue from functionally relevant brain regions (eg, the primary motor cortex [M1]).2 A frequently encountered phenomenon in patients presenting with tumors in the vicinity of motor regions is that some of them have motor impairment while others do not, and some deteriorate after the operation while others may even improve.3⇓–5 In some patients, motor deficits can be explained by direct infiltration of the tumor into the motor cortex or corticospinal tract (CST), while in other patients, compression effects resulting from the tumor mass and/or perifocal edema may cause motor symptoms.5 Differentiating causes is, however, highly relevant with respect to the reversibility of symptoms and planning of operations.6⇓⇓–9
In clinical practice, such preoperative diagnostics usually rely on analyses of structural MR imaging sequences such as T1- or T2-weighted scans without integrating individual information on functional anatomy. Direct cortical stimulation remains the criterion standard for motor function mapping but is limited to the intraoperative setting and, thus, not suitable for preoperative planning and risk evaluation. However, the repertoire of methods available in brain mapping has considerably advanced in the past decade and now allows elaborate analyses of structure-function relationships. For example, a useful tool for assessing the functional anatomy of the primary motor cortex in a noninvasive fashion is navigated transcranial magnetic stimulation (nTMS).10⇓–12 This technique has a reliability similar to that of fMRI mapping, however, with less demand for the cooperation of patients who may have reduced alertness, compliance, and functional impairment such as those with brain tumors.13,14 Another technique that adds information to structure-function relationships is diffusion imaging, especially DTI.9,15,16 For example, DTI-based tractography has been developed to visualize the subcortical fiber tracts in individual subjects; this is especially useful in conditions in which the functional anatomy can be heavily distorted such as in patients with brain tumors.17,18 In addition, DTI can also be used to characterize the altered diffusion metrics within the tumor mass and the surrounding tissue, thereby allowing quantification of the integrity of fiber tracts.19,20
In summary, there are currently rather limited data on how to preoperatively evaluate patients with brain tumors for operation-associated risks related to motor impairment and recovery thereof.7,12,21⇓–23 Thus, the objective of our study was to use a multimodal imaging setup to delineate malignant brain tumor lesions from functionally relevant motor cortex and fibers in patients undergoing an operation. As such, the study was based on a multimodal imaging approach by the coregistered integration of the following: 1) MR imaging data for anatomically defining lesion extent (T2WI and T1WI) and allowing structural analysis by DTI tractography; 2) O-(2-[18F]fluoroethyl)-L-tyrosine (FET)-PET for outlining the metabolic extent of the tumor because FET is the most evaluated 18F-labeled amino acid for PET of brain tumors, in particular in treatment planning and monitoring22⇓⇓–25; and 3) nTMS data for a functional definition of the M1 region and allowing nTMS-based DTI tractography. We hypothesized the following: 1) The integration of FET-PET and nTMS data advances the preoperative evaluation of motor impairment more than with MR imaging alone by contrast-enhanced T1WI (T1-CE), T2WI, and DTI; and 2) lesional signal within primary motor functional tissue as depicted by the multimodal approach may then serve as a potential predictive imaging marker for motor function outcome.
Materials and Methods
Patient Enrollment and Study Design
We prospectively examined 30 consecutive patients (16 men; mean age, 60 years) enrolled by referral for tumor removal in the vicinity of the M1 and/or the CST between November 2011 and September 2013 (see On-line Tables 1 and 2 for clinical characteristics and study criteria). While 25 patients were diagnosed for the first time, 5 were referred due to suspicious recurrent tumor growth. At admission and at discharge, upper limbs, lower limbs, and facial muscles were tested for strength and scored according to the widely used Medical Research Council scale from 0 to 5 by the same experienced individual neurosurgeon. Any score <5 in any body part defined the presence of a motor deficit. In addition, the Karnofsky Performance Scale (KPS) was assessed at both time points (On-line Table 1).
The study was approved by the University of Cologne ethics committee. Written informed consent was obtained from all patients. Three patients were not scanned by PET due to a recently performed PET before the study. All other patients underwent a standardized hybrid MRI-PET protocol followed by an nTMS motor cortex mapping shortly thereafter, on average within 1 week before the operation. One patient declined surgical tumor removal; hence, this patient was excluded when testing for relationships to postoperative outcome. All other patients underwent a standard tumor-removal operative protocol with the use of state-of-the-art neurosurgical and technical equipment for a brain tumor operation in eloquent brain regions, including intraoperative navigation and neurophysiologic monitoring.
Hybrid MRI-PET Imaging and nTMS Data Acquisition
The hybrid 3T MRI-PET scanner used in the present study consisted of a commercially available 3T MR imaging system (Magnetom Tim Trio; Siemens, Erlangen, Germany) and a PET insert for brain imaging as described elsewhere.25 In summary, the BrainPET (Siemens, Erlangen, Germany) ring consisted of 32 copper-shielded detector cassettes coupled with an array of Avalanche Photodiodes (Excelitas Technologies, Asslar, Germany) at the front end so that it was not sensitive to the magnetic field of the MR imaging system (FOV diameter, 31.4 cm; length, 19.2 cm), which allows a central image resolution of approximately 3 mm.2,25
FET-PET
PET was performed by using FET (see Neuner et al25 for details). In brief, after the intravenous injection of 200 MBq of FET, a hybrid MRI-PET protocol was performed with a duration of 40–50 minutes (see On-line Table 3 for the protocol summary). The corrections for a component-based normalization, attenuation, and scatter, dead-time, and decay were performed within the reconstruction process thereafter.25 The reconstructed images had 256 × 256 × 153 isotropic voxels of 1.25 mm3 and were subsequently filtered with a 3D Gaussian kernel (filter width, 3 mm) to increase the SNR.
MR Imaging
Anatomic MR images were acquired by using a T2WI spin-echo sampling perfection with application-optimized contrasts using different flip angle evolution (SPACE; Siemens) sequence and a T1WI MPRAGE sequence before and after intravenous injection of a gadolinium-based contrast-enhancing agent (T1-CE) (gadoterate meglumine, Dotarem; Guerbet, Aulnay-sous-Bois, France).
For DTI tractography, whole-brain volumes were acquired with a double spin-echo diffusion-weighted EPI sequence (2 averages jointly used). Thirty diffusion gradient directions were used with a b-value of 800 s/mm2 and a single acquisition with a b-value of zero (On-line Table 3).
nTMS Motor Mapping
nTMS was performed by using the eXimia NBS System (V4.2; Nexstim, Helsinki, Finland). As in earlier studies,13,17 motor-evoked potentials were recorded of the abductor pollicis brevis muscle as the M1 hand representation, the plantar toe flexors representing the foot M1 region, and the anterior lateral tongue muscles as the M1 face representation. The “hotspot” was defined as the cortical stimulation site at which coil positioning, orientation, and tilt yielded the highest amplitude of the motor-evoked potentials. In areas of critical interest such as the tumor border, the spatial attenuation of stimulation was increased and the coil orientation and tilt were varied to maximize topographic accuracy.10 The outer margin of a given functional area was determined by 2 adjacent negative stimulation spots (On-line Table 3).
Functional Tractography
Functional tractography was performed deterministically on the basis of the DTI and nTMS data by using the iPlan fibertracking software (V2.6; Brainlab, Feldkirchen, Germany).17,26,27 For each M1 muscle representation, a 5-mm sphere centered around the nTMS hotspot was concentrically enlarged by 5 mm to form a standardized seed volume for the tractography in an anterograde direction for each voxel in the respective ROI (vector step length, 1.6 mm; angular threshold, 30°).15,26 The course of the reconstructed fibers was verified as part of the CST by an experienced neuroradiologist. The minimum fractional anisotropy (FA) value in the CST voxels was determined by increasing the FA threshold stepwise up in 0.01 U until it resembled the thinnest tract possible in each individual.27 This procedure allows exclusion of aberrant non-CST fibers.17
Image Volumetry
For each subject, the volumes of the tumor and the peritumoral T2WI lesion and the nTMS mapping volumes of both M1 and the CST were calculated by using the iPlan software volumetry tool, which is based on the Cavalieri principle to provide unbiased volume estimates.28 Briefly, the lesion contours were manually segmented on sequential axial images and verified in the coronal and sagittal reconstruction planes by an experienced neuroradiologist, blinded to the patient's clinical status and confirmed by a neurosurgeon. The sum of tumor contour surfaces of an MR imaging study was multiplied by the section thickness to obtain the estimated volume in cubic centimeters. T1-CE tumor volumes were determined on the MPRAGE sequence on the basis of the hyperintense T1WI signal of the gadolinium-enhanced acquisition compared with the baseline MPRAGE as a measure of tumor extent with a disrupted blood-brain barrier. The FET-PET hotspot volume was resolved on the fused PET image set on the basis of a significant FET uptake at a tumor-to-brain-ratio of at least 1:6 to represent the extent of the tumor with upregulated amino acid metabolism.24 The T2WI lesion volume was calculated according to the alteration of the tumoral and peritumoral signal intensity compared with normal brain tissue in the SPACE sequence. Its volume served as a measure of the extent of peritumoral edema and diffuse infiltrative glial tumor growth. The overlap volumes of the lesions with the CST and the M1 ROI were calculated with the use of the overlap calculation tool of the iPlan software.
Statistical Analyses
Patients were dichotomized according to their initial clinical presentation in regard to the presence of motor impairment. The contingency tables were used to determine the sensitivity, specificity, and negative and positive predictive values. The 2-tailed Fisher exact probability test was used to determine whether there were nonrandom associations between the spatial overlap of lesional and functional tissue and the presence of motor impairment before and the change in motor performance after the operation. Differences in total lesional and functional tissue volumes, their overlapping volumes, the FA values, or the resting motor threshold between the groups of patients with motor impairment versus unaffected patients were calculated separately by the independent t tests. The potential influences of confounding factors on the presented results were tested by 1-way ANOVA (F[DFn, DFd]). Statistical significance was considered when passing a threshold of P < .05 (Bonferroni-corrected for multiple comparisons if appropriate) with the use of the SPSS software (V20.0; IBM, Armonk, New York).
Results
Clinical Findings
Eight of the 30 patients enrolled in this study did not show any affection of motor function at clinical presentation, while most (n = 22) demonstrated an isolated motor weakness of the face or limbs, or a hemiparesis, respectively. At discharge after surgery (mean hospital length of stay, 8.5 ± 2.6 days), 4 patients (14%) had new or worsened motor deficits, while the others benefited from tumor removal with their motor performance either remaining unchanged or improved (n = 25, 86%). In subgroup analysis, the factor “tumor entity” (metastases versus high-grade gliomas) had no significant effect on the patients' motor functions after surgery (F[2,53] = 0.16, P = .85).
In 55% of patients (n = 16), a gross total tumor resection could be achieved, indicated by complete removal of the contrast-enhancing tumor parts in postoperative MR imaging. In 45% of patients (n = 13), resection remained subtotal (see On-line Table 1 for further clinical characteristics). However, there was no significant effect of the factor “extent of tumor removal” (gross total versus subtotal resection) on postsurgical motor function (F[2,55] = 0.15, P = .87).
nTMS Motor Mapping
Motor mapping by nTMS was feasible in all subjects for the hand representation area but not for all in the foot and face regions. In 3 patients, the resting motor threshold of the foot representation area exceeded the maximum stimulator output intensity so that motor maps could not be obtained for this body part in these patients.13 Likewise, detailed cartography of the cortical tongue representation could only be obtained in 83% of the patients (n = 25). In the remaining patients (n = 5), stimulation thresholds of facial nerve fibers were lower than those of the M1 representation, leading to false-positive motor-evoked potentials in the lateral tongue as evident by very short latencies (range, 3–6 ms). Overall, nTMS motor mapping did not cause any seizures or neurologic side effects. The average resting motor threshold of the muscle representations of the hand, tongue, and foot did not differ between patients with motor impairment and those without deficits (P > .1) (On-line Fig 1).
Functional Tractography and MR Imaging Volumetry
Total Volumes.
There was no statistical difference found in the comparison of the total tumor size based on the T1-CE or FET-PET lesion volumes between the patients with (T1-CE: 17.9 ± 15.1 cm3; FET-PET: 9.4 ± 5.6 cm3) and without a motor deficit (T1-CE: 9.7 ± 14.9 cm3; FET-PET: 5.2 ± 5.7 cm3; P > .1). Yet, there was a statistical trend for a greater extent of the perifocal T2WI lesion in patients with a motor deficit (60.9 ± 34.8 cm3) compared with the others (38.1 ± 27.2, P = .08) (On-line Fig 2A). Cortical M1 representations (3.4 ± 1.1 versus 3.6 ± 0.8 cm3) and the mean CST volumes (0.7 ± 0.3 versus 0.5 ± 0.2 cm3) were of equal size between the 2 groups (P > .1) (On-line Fig 2B).
Clinical Correlation of the Spatial Overlap between M1/CST Volumes and Lesional Tissue on FET-PET/T1-CE
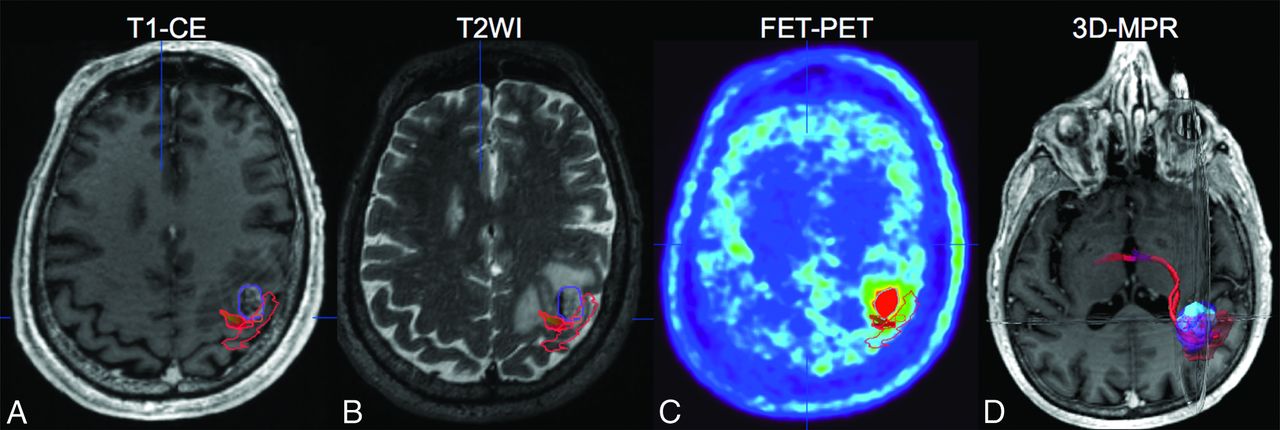
Nearly all patients who showed an overlap between the T1-CE or the FET-PET-defined lesion and the functional tissue as depicted by the nTMS M1 volumes and the DTI-defined CST had a motor deficit (T1-CE/FET-PET: positive predictive value = 91.7%/100%, sensitivity = 50%/63.2%) (Fig 1 and On-line Table 4). In contrast, in patients without motor deficits, functional tissue maps rarely overlapped the anatomically defined FET-PET or T1-CE extent of the tumor (T1-CE/FET-PET: 1/0, specificity = 87.5%/100%, negative predictive value = 38.9%/53.3%). Statistically, FET-PET lesion signal within functional tissue showed a significant effect on the likelihood of a motor deficit (P < .01) (On-line Table 4). In contrast, the effect of the T1-CE lesion signal within the functional tissue on the likelihood of a motor deficit was limited to a statistical trend (P = .099) (On-line Table 4).

A 72-year-old male patient with contralateral upper limb weakness as depicted by an overlap between his carcinoma-metastasis on T1-CE (purple in A, B, and D) and FET-PET (light blue in C and D) and the hand-motor representation (red in A–D). 3D multiplanar reconstruction image with integration of functional, metabolic, and anatomic data is shown in (D).
Quantitatively, the relative overlap of the FET-PET-based tumor volume and the functional tissue was significantly higher in the patients with (2.4 ± 4.3%) compared with patients without (P < .05) motor deficits (Fig 3). With regard to T1-CE lesion signal within the M1 or the CST, we found only a statistical trend for greater overlaps in patients with motor impairments (3.2 ± 8.2%) compared with patients without deficits (0.04 ± 0.1%, P = .09).

No overlap between the extent of the tumor on T1-CE and motor tissue is found in a 51-year-old female patient with glioblastoma and contralateral hemiparesis (B). The M1 representation of the hand (red in A–D) and CST of the face (purple in A–D) border the FET-PET lesion (C) but do not overlap the thresholded pathologic volume. However, the M1 representation of the hand (red in A–D) and the CST of the foot (yellow in A–D) are affected by the peritumoral T2WI lesion (pink in A and D) as the 3D multiplanar reconstruction image with integration of multimodal data reveals (D). The motor deficit proved reversible; this patient fully recovered her motor function on tumor removal.
With respect to the postoperative outcome at discharge, all patients who had new or deteriorated motor deficits after the operation (n = 4) showed an overlap between tumor extent on FET-PET and T1-CE and the functional tissue (M1 and/or CST) before the operation (T1-CE/FET-PET: sensitivity = 100%/100%, positive predictive value = 33.3%/33.3%) (On-line Table 5). In other words, in the group of patients with functional tissue being affected by FET-PET and/or a T1-CE lesion before the operation (n = 12), the operation-associated risk of motor deterioration was 33.3% and, thus, more than double compared with the overall operation-associated risk of new or worsened motor deficits of all operated patients (13.8%, n = 29). On the other hand, all patients who did not show an overlap between the functional tissue and the lesion extent on T1-CE or FET-PET on preoperative maps (n = 16) benefited from tumor removal with their motor function remaining unchanged or even improved after surgery (T1-CE/FET-PET: negative predictive value = 100%/100%, specificity = 68.0/65.2%) (On-line Table 5). In summary, the presence of T1-CE and FET-PET signal overlapping functional tissue on preoperative maps showed a significant impact on the likelihood of operation-associated motor deterioration, while the absence of such overlaps on preoperative maps indicated a higher chance of preserved motor function after the operation.
Clinical Correlation of the Spatial Overlap between M1/CST Volumes and Lesional Tissue on T2WI
Most (n = 21) patients with motor impairment (n = 22) showed an overlap between the T2WI lesion and the functional M1 and/or CST volumes (sensitivity = 95.5%, positive predictive value = 91.3%, specificity = 75.0%, negative predictive value = 85.7%) (Fig 2 and On-line Table 6). Overall, T2WI lesion signal within the M1 representation and/or the CST showed a significant effect with respect to the likelihood of a motor deficit before the operation (P < .001) (On-line Table 6). Quantitatively, the mean relative overlap volume between the T2WI lesion and the functional tissue in the group of patients with motor impairment (21.6 ± 22.2%) was significantly higher compared with patients without motor deficits before the operation (0.9 ± 1.7%, P < .01) (Fig 3).

The overlapping volume of the motor functional tissue with the T2WI lesion and with the FET-PET lesion, respectively, is significantly greater in the motor-impaired group than the preserved group. Double asterisks indicate P < .01; asterisk, P < .05. The difference of the overlap volume between functional tissue and T1-CE tumor extent in the patients with motor weakness compared with the preserved patients is limited to a statistical trend (P = .09).
Within the group of patients with motor impairment who showed an overlap between functional tissue and the T2WI lesion on preoperative maps (n = 20), we found that nearly all of those who were affected by the T2WI lesion only and showed no additional overlap with the T1-CE or FET-PET lesion (n = 7) improved in motor function after the operation (positive predictive value = 87.5%, sensitivity = 53.8%, specificity = 85.7%, negative predictive value = 50.0%) (On-line Table 7). However, there were almost as many patients (n = 6) found to improve in motor impairment after the operation despite an overlap between functional tissue and T1-CE and/or the FET-PET lesion. Thus, the value of the functional/T2WI overlap in predicting the reversibility in motor deficits due to tumor removal did not reach statistical significance (P = .16) (On-line Table 7).
Fractional Anisotropy
The mean minimum FA value of the CST was found to be significantly lower in the group of patients with a motor deficit (0.22 ± 0.06 U) than in patients without motor impairment (0.28 ± 0.06 U, P = .04) (On-line Fig 3). The FA values of the CST affected by altered T2WI signal overlap and by T1-CE or FET-PET tumor bulk are reported in On-line Fig 4. Moreover, no difference was found in the FA values of the CST in the patients with metastases versus those with high-grade gliomas (On-line Fig 5).
Discussion
The understanding of the spatial relationship of lesional and motor function tissue in neuro-oncologic patients is critical for preoperative planning to choose the best therapeutic approach and to reduce postoperative morbidity. The deterioration of existing or newly developed motor deficits does not only reduces the quality of life but also reduces overall survival of the affected patients independent of the extent of resection and the adjuvant therapy.3,29 Tumor size, location, and infiltrative growth patterns have been discussed as underlying causes of neurologic impairment in those patients.5 Here, we found that patients with tumor masses directly within motor functional tissue as depicted by FET-PET or T1-CE merely accounted for approximately half of the patients with motor deficits. In this subgroup, FET-PET lesion signal within the M1 representation or the CST was associated with the presence of a motor deficit with high specificity. With regard to T1-CE, this effect was less robust (statistical trend). Therefore, FET-PET was superior to T1-CE MR imaging in revealing a motor deficit before the operation. This observation is in line with previous studies and suggests that the combined use of PET and MR imaging is better for delineating tumor extent.30 However, both T1-CE and FET-PET were of equal value for the prediction of postoperative functional outcome: While the absence of overlap with functional tissue maps predicted a favorable outcome, the presence of overlap before the operation was associated with a considerably higher risk of motor deterioration after the operation (33%) compared with the risk of the entire sample (14%) or with the risk reported in the literature, ranging from 6% to 19%.3⇓–5 These findings need to be confirmed in a larger series but may be of great value in more wisely selecting and advising patients with brain tumors in the proximity of the CST or M1 for operative tumor removal.
Not surprising, the sensitivity of either FET-PET or T1-CE in revealing motor deficits before the operation was limited. In half of patients, motor impairment could not be explained by an overlap of FET-PET or T1-CE lesion extent with functional tissue maps. Hence, factors other than the lesion itself seem to contribute to motor impairment. In fact, we found almost all of the patients with motor impairment demonstrated T2WI signal hyperintensity within the motor functional tissue. This observation may serve as a highly sensitive measure to mirror motor impairment. In this regard, T2WI may have demonstrated superiority to FET-PET and T1-CE due to its ability to account for peritumoral edema formation and diffuse tumor cell infiltration, which may have caused motor function tissue disturbance in those cases.16,19,31 However, the potential of T2WI lesion overlap with functional tissue to serve as an imaging marker to predict the reversibility of motor impairment was limited: On one hand, most patients with motor impairment and a T2WI overlap but no involvement of FET-PET or T1-CE signal within the functional tissue maps improved in motor impairment after tumor resection. On the other hand, almost as many patients improved as well despite an overlap between functional tissue and the T1-CE and/or FET-PET lesion. Thus, despite such a relatively high positive predictive value, predictions were not statistically significant.
The findings were supported by the diffusion metrics of the CST. Malignant brain tumors are usually surrounded by a hyperintense signal of varying extent on T2WI, implying the presence of at least a minimum amount of extra- or intracellular water excess. Diffusion metrics such as FA have been shown to be significantly altered in these peritumoral regions. Such a lesion leads to an increasing magnitude of diffusion and, thus, to a decreasing directionality, expressed by a lower FA value in DTI.20 Accordingly, the patients of the present sample with altered signals in T2WI voxels within the CST demonstrated a significantly lower FA value than those with CST voxels without T2WI overlap. With regard to motor impairment, we were able to verify that the FA was significantly lower in the group of patients with motor impairment than in the patients without motor deficits. This finding may, thus, support the hypothesis that the cause of motor impairment in the group of patients without overlaps of FET-PET/T1-CE with motor functional tissue is an indirect effect resulting from, for example, edema interfering with the structural integrity of the motor system.6⇓–8,32
Moreover, there has been an ongoing debate about the utility of diffusion metrics in the differentiation of glial-versus-metastatic growth patterns in the white matter. While some authors found the FA to be reduced in the surroundings of glial tumors compared with metastatic lesions,19,31 others found the opposite.33 In contrast, very low FA values were found not only in tumor-infiltrated T2WI lesions of gliomas but also in purely vasogenic edema, implying the limitation in differentiating the 2 on the basis of diffusion metrics alone.16 Accordingly, we did not find a difference in the FA values of the CST surrounded by high-grade glioma compared with metastases.
This observation also implied 2 of the limitations of our study: 1) the heterogeneity of the tumor entities within our study population; and 2) the small number of patients with respect to the tumor entities included in the study, the nonglial lesions in particular (ranging from 1 lymphoma to 7 metastases). While malignant cerebral lesions of different entities have various imaging features in common, some imaging features may also significantly differ depending on the tumor entity, for example, in T2WI and DWI as previously mentioned.16,32,33 Differences in the growth patterns of various tumor entities (eg, diffuse infiltration of glioblastoma versus less cell invasion in the brain-to-tumor interface of metastases) with infiltrated tissue below the detection threshold of current neuroimaging techniques certainly limit the diagnostic value of MR imaging and PET in tumor surgery. In addition, our study design was limited in providing control for the steroid therapy that was administered in 80% of the patients before inclusion in the study because steroids are known to potentially reduce the content of extracellular water in the brain tissue and, thus, for example, potentially affect imaging features on T2WI and DWI.
Overall, our findings are in line with those in other studies in which motor performance of patients with brain tumor correlated with structural or anatomic MR imaging parameters.6⇓–8 However, most studies did not consider functional maps. The anatomic appearance of brain tissue can be heavily distorted by the tumor mass, especially for lesions close to the M1 and CST.12 Likewise, previous studies did not consider nTMS mappings—that is, in putative lesions to motor cortical regions. Furthermore, previous studies primarily relied on T1-CE lesion volumes but did not consider metabolic information provided by PET.30 We here intended to overcome these limitations by the integration of functional data of the M1 with a combined FET-PET and MR imaging dataset. The present study demonstrates the feasibility of a multimodal imaging approach, integrating functional information obtained by nTMS. The reliability of localizing the M1 region by nTMS has previously been shown to be of a value comparable with that of fMRI in healthy subjects.13 In patients with brain tumors, fMRI might be less useful due to the patients' motor impairments (leading to stronger task-related head movement artifacts), reduced alertness/compliance, and potential changes in neurovascular coupling.14 These effects are much less present in nTMS mapping performed in patients with brain tumors.11 Hence, the combination of FET-PET, MR imaging, and nTMS may help in the future to select patients more wisely for an operation and plan operations more precisely to possibly prevent operation-associated neurologic deterioration.
Only 1 patient's motor deficit could not be sufficiently explained on the basis of the multimodal imaging data obtained in this study. The patient showed neither FET-PET, T1-CE, nor T2WI signal alterations affecting the primary motor pathway. One alternative explanation could be a general disruption of the motor network connectivity itself rather than a single component—that is, diaschisis involving the premotor cortex, the supplemental motor cortex, the superior parietal lobule, and their interhemispheric connections.34 Functional connectivity MR imaging seems to be a promising tool in this respect to further study the underlying network behind primary and secondary motor function, with the aim of predicting operative risks under these circumstances as well in the future.
Conclusions
The multimodal imaging approach demonstrated in this study allows insight into the spatial relationship between lesional and functional tissue and, thus, the putative cause of motor deficits in patients with brain tumors. The present study demonstrates that tumor infiltration of the M1 region or the CST as depicted by FET-PET is highly indicative of motor impairment, better than T1-CE alone, and is of predictive value for operative-risk evaluation. Furthermore, we also found the presence of motor deficits to be well-mirrored by the overlap of the peritumoral T2WI signal alteration with functional tissue. However, such overlap of functional tissue and T2WI signal alteration was of limited value in predicting tumor-removal-associated reversibility of motor impairment in our series. Further studies are required to evaluate the value of this approach for the preservation of function in patients with brain tumors.
Acknowledgments
We thank the MR imaging staff of the Forschungszentrum Jülich for the acquisition of the MR imaging and PET data and their technical support.
Footnotes
Disclosures: Volker Neuschmelting—UNRELATED: Grants/Grants Pending: Deutsche Forschungsgemeinschaft, Comments: research fellowship grant. Carolin Weiss Lucas—RELATED: Grant: German Research Foundation (Deutsche Forschungsgemeinschaft),* Comments: funding for a TMS machine; no personal grant; UNRELATED: Payment for Lectures (including service on Speakers Bureaus): Roche Pharma, Comments: Young Advisory Board Meeting; compensation for presentation (single event/payment; amount <€1000); Travel/Accommodations/Meeting Expenses Unrelated to Activities Listed: University of Cologne, German Society for Neurosurgery, Nexstim, Comments: travel costs regarding scientific meetings as an invited speaker. Roland Goldbrunner—UNRELATED: Board Membership: Roche, Comments: medical treatment of brain tumors; Travel/Accommodations/Meeting Expenses Unrelated to Activities Listed: Roche, Comments: travel expenses for the Society for NeuroOncology Annual Meetings 2013 and 2014. Christian Grefkes—UNRELATED: Grants/Grants Pending: German Research Foundation.* *Money paid to the institution.
This work was supported by a Deutsche Forschungsgemeinschaft grant No. INST 1856/50-1 LAGG (R.G.) and a Deutsche Forschungsgemeinschaft research fellowship grant No. NE 1922/2-1 (V.N.).
Indicates open access to non-subscribers at www.ajnr.org
References
- Received May 5, 2015.
- Accepted after revision July 14, 2015.
- © 2016 by American Journal of Neuroradiology


Jump to section
Related Articles
Cited By...
- No citing articles found.