Advertisement

Main menu

  • Home
  • Content
    • Current Issue
    • Accepted Manuscripts
    • Article Preview
    • Past Issue Archive
    • Video Articles
    • AJNR Case Collection
    • Case of the Week Archive
    • Case of the Month Archive
    • Classic Case Archive
  • Special Collections
    • AJNR Awards
    • ASNR Foundation Special Collection
    • Most Impactful AJNR Articles
    • Photon-Counting CT
    • Spinal CSF Leak Articles (Jan 2020-June 2024)
  • Multimedia
    • AJNR Podcasts
    • AJNR SCANtastic
    • Trainee Corner
    • MRI Safety Corner
    • Imaging Protocols
  • For Authors
    • Submit a Manuscript
    • Submit a Video Article
    • Submit an eLetter to the Editor/Response
    • Manuscript Submission Guidelines
    • Statistical Tips
    • Fast Publishing of Accepted Manuscripts
    • Graphical Abstract Preparation
    • Imaging Protocol Submission
    • Author Policies
  • About Us
    • About AJNR
    • Editorial Board
    • Editorial Board Alumni
  • More
    • Become a Reviewer/Academy of Reviewers
    • Subscribers
    • Permissions
    • Alerts
    • Feedback
    • Advertisers
    • ASNR Home

User menu

  • Alerts
  • Log in

Search

  • Advanced search
American Journal of Neuroradiology

American Journal of Neuroradiology

ASHNR American Society of Functional Neuroradiology ASHNR American Society of Pediatric Neuroradiology ASSR
  • Alerts
  • Log in

Advanced Search

  • Home
  • Content
    • Current Issue
    • Accepted Manuscripts
    • Article Preview
    • Past Issue Archive
    • Video Articles
    • AJNR Case Collection
    • Case of the Week Archive
    • Case of the Month Archive
    • Classic Case Archive
  • Special Collections
    • AJNR Awards
    • ASNR Foundation Special Collection
    • Most Impactful AJNR Articles
    • Photon-Counting CT
    • Spinal CSF Leak Articles (Jan 2020-June 2024)
  • Multimedia
    • AJNR Podcasts
    • AJNR SCANtastic
    • Trainee Corner
    • MRI Safety Corner
    • Imaging Protocols
  • For Authors
    • Submit a Manuscript
    • Submit a Video Article
    • Submit an eLetter to the Editor/Response
    • Manuscript Submission Guidelines
    • Statistical Tips
    • Fast Publishing of Accepted Manuscripts
    • Graphical Abstract Preparation
    • Imaging Protocol Submission
    • Author Policies
  • About Us
    • About AJNR
    • Editorial Board
    • Editorial Board Alumni
  • More
    • Become a Reviewer/Academy of Reviewers
    • Subscribers
    • Permissions
    • Alerts
    • Feedback
    • Advertisers
    • ASNR Home
  • Follow AJNR on Twitter
  • Visit AJNR on Facebook
  • Follow AJNR on Instagram
  • Join AJNR on LinkedIn
  • RSS Feeds

AJNR is seeking candidates for the AJNR Podcast Editor. Read the position description.

Research ArticleADULT BRAIN

Combining Diffusion Tensor Metrics and DSC Perfusion Imaging: Can It Improve the Diagnostic Accuracy in Differentiating Tumefactive Demyelination from High-Grade Glioma?

S.B. Hiremath, A. Muraleedharan, S. Kumar, C. Nagesh, C. Kesavadas, M. Abraham, T.R. Kapilamoorthy and B. Thomas
American Journal of Neuroradiology April 2017, 38 (4) 685-690; DOI: https://doi.org/10.3174/ajnr.A5089
S.B. Hiremath
aFrom the Departments of Imaging Sciences and Interventional Radiology (S.B.H., A.M., S.K., C.N., C.K., T.R.K., B.T.)
  • Find this author on Google Scholar
  • Find this author on PubMed
  • Search for this author on this site
  • ORCID record for S.B. Hiremath
A. Muraleedharan
aFrom the Departments of Imaging Sciences and Interventional Radiology (S.B.H., A.M., S.K., C.N., C.K., T.R.K., B.T.)
  • Find this author on Google Scholar
  • Find this author on PubMed
  • Search for this author on this site
  • ORCID record for A. Muraleedharan
S. Kumar
aFrom the Departments of Imaging Sciences and Interventional Radiology (S.B.H., A.M., S.K., C.N., C.K., T.R.K., B.T.)
  • Find this author on Google Scholar
  • Find this author on PubMed
  • Search for this author on this site
  • ORCID record for S. Kumar
C. Nagesh
aFrom the Departments of Imaging Sciences and Interventional Radiology (S.B.H., A.M., S.K., C.N., C.K., T.R.K., B.T.)
  • Find this author on Google Scholar
  • Find this author on PubMed
  • Search for this author on this site
  • ORCID record for C. Nagesh
C. Kesavadas
aFrom the Departments of Imaging Sciences and Interventional Radiology (S.B.H., A.M., S.K., C.N., C.K., T.R.K., B.T.)
  • Find this author on Google Scholar
  • Find this author on PubMed
  • Search for this author on this site
  • ORCID record for C. Kesavadas
M. Abraham
bNeurosurgery (M.A.), Sree Chitra Tirunal Institute for Medical Sciences and Technology, Trivandrum, Kerala, India.
  • Find this author on Google Scholar
  • Find this author on PubMed
  • Search for this author on this site
  • ORCID record for M. Abraham
T.R. Kapilamoorthy
aFrom the Departments of Imaging Sciences and Interventional Radiology (S.B.H., A.M., S.K., C.N., C.K., T.R.K., B.T.)
  • Find this author on Google Scholar
  • Find this author on PubMed
  • Search for this author on this site
  • ORCID record for T.R. Kapilamoorthy
B. Thomas
aFrom the Departments of Imaging Sciences and Interventional Radiology (S.B.H., A.M., S.K., C.N., C.K., T.R.K., B.T.)
  • Find this author on Google Scholar
  • Find this author on PubMed
  • Search for this author on this site
  • ORCID record for B. Thomas
  • Article
  • Figures & Data
  • Supplemental
  • Info & Metrics
  • Responses
  • References
  • PDF
Loading

Abstract

BACKGROUND AND PURPOSE: Tumefactive demyelinating lesions with atypical features can mimic high-grade gliomas on conventional imaging sequences. The aim of this study was to assess the role of conventional imaging, DTI metrics (p:q tensor decomposition), and DSC perfusion in differentiating tumefactive demyelinating lesions and high-grade gliomas.

MATERIALS AND METHODS: Fourteen patients with tumefactive demyelinating lesions and 21 patients with high-grade gliomas underwent brain MR imaging with conventional, DTI, and DSC perfusion imaging. Imaging sequences were assessed for differentiation of the lesions. DTI metrics in the enhancing areas and perilesional hyperintensity were obtained by ROI analysis, and the relative CBV values in enhancing areas were calculated on DSC perfusion imaging.

RESULTS: Conventional imaging sequences had a sensitivity of 80.9% and specificity of 57.1% in differentiating high-grade gliomas (P = .049) from tumefactive demyelinating lesions. DTI metrics (p:q tensor decomposition) and DSC perfusion demonstrated a statistically significant difference in the mean values of ADC, the isotropic component of the diffusion tensor, the anisotropic component of the diffusion tensor, the total magnitude of the diffusion tensor, and rCBV among enhancing portions in tumefactive demyelinating lesions and high-grade gliomas (P ≤ .02), with the highest specificity for ADC, the anisotropic component of the diffusion tensor, and relative CBV (92.9%). Mean fractional anisotropy values showed no significant statistical difference between tumefactive demyelinating lesions and high-grade gliomas. The combination of DTI and DSC parameters improved the diagnostic accuracy (area under the curve = 0.901). Addition of a heterogeneous enhancement pattern to DTI and DSC parameters improved it further (area under the curve = 0.966). The sensitivity increased from 71.4% to 85.7% after the addition of the enhancement pattern.

CONCLUSIONS: DTI and DSC perfusion add profoundly to conventional imaging in differentiating tumefactive demyelinating lesions and high-grade gliomas. The combination of DTI metrics and DSC perfusion markedly improved diagnostic accuracy.

ABBREVIATIONS:

AUC
area under curve
FA
fractional anisotropy
HGG
high-grade glioma
L
total magnitude of diffusion tensor
NAWM
normal-appearing white matter
p
isotropic component of diffusion tensor
q
anisotropic component of diffusion tensor
rCBV
relative cerebral blood volume
ROC
receiver operating characteristic
SI
signal intensity
TDL
tumefactive demyelinating lesion

Tumefactive demyelinating lesions (TDLs) are demyelinating lesions of >2 cm and can mimic high-grade gliomas (HGGs) on conventional MR imaging.1 Classic conventional and advanced imaging findings may not be present in all cases.2⇓–4 Because TDLs can be mistaken for gliomas on histopathology, demonstration of the intact axonal process and myelin breakdown products within macrophages is confirmative of demyelination.5⇓–7 This diagnostic dilemma might lead to a biopsy, an inadvertent operation, and even radiation therapy, which eventually can exacerbate demyelination.

Diffusion tensor imaging is a noninvasive method for analyzing the architectural integrity and orientation of axons in white matter. The eigenvalues can be used to calculate various scalar measures of DTI metrics such as ADC, fractional anisotropy (FA), the isotropic component of the diffusion tensor (p), the anisotropic component of the diffusion tensor (q), and the total magnitude of the diffusion tensor (L).8⇓–10 The most commonly used DTI parameters include ADC (ie, the magnitude of diffusion independent of tissue orientation) and FA (ie, anisotropic diffusion against the total magnitude of diffusion). Less often used measures include total magnitude of diffusion tensor (L) and its isotropic (p) and anisotropic (q) components.

The use of FA as a sole measure of anisotropic diffusion can be fallacious because it varies with changes in the anisotropic component and the total magnitude of diffusion.9,10 The utility of DTI parameters (ie, FA, p, q, and L) has been evaluated in the differentiation of various brain tumors.11⇓–13 Toh et al14 evaluated the role of FA in differentiating TDL from HGG by using DTI. However, to the best of our knowledge, there are no studies available evaluating the role of p, qd , and L in differentiating TDL and HGG.

Dynamic-susceptibility contrast perfusion imaging allows evaluation of relative cerebral blood volume (rCBV), a marker of neoangiogenesis, and aids in the differentiation of low- and high-grade gliomas.15,16 TDLs usually have decreased rCBV values due to the absence of neovascular proliferation, which allows differentiation of TDL from HGG.17 However, TDL can also present with elevated rCBV values and mimic HGG on DSC perfusion, making differentiation difficult.4

The purpose of this study was to evaluate the efficacy of conventional imaging, diffusion tensor metrics (ADC, FA, p, q, and L), and DSC perfusion (rCBV) in differentiating TDL and HGG. We also assessed the effect of combining imaging parameters—DTI and DSC perfusion imaging—on diagnostic accuracy.

Materials and Methods

Study Participants

The institutional ethics committee of Sree Chitra Tirunal Institute for Medical Sciences and Technology, Trivandrum, India, approved this retrospective study. The study group included 14 consecutive patients with TDL and 21 consecutive patients with biopsy-proved HGG (ie, World Health Organization grade III and IV tumors) with contrast-enhancing lesions, from January 2011 to December 2015. The diagnosis of TDL was confirmed by either histopathology, CSF analysis, and/or resolution on posttherapy follow-up, as detailed in On-line Table 1. The patients with nonenhancing lesions, those without prior imaging/suboptimal quality or nonavailability of DTI/DSC perfusion data, and those started on therapy or having undergone a previous brain biopsy at the time of the index clinical MR imaging were excluded.

Image Acquisition

All subjects underwent MR imaging (ie, DTI and DSC perfusion) with conventional sequences (T1, T2, FLAIR, and postcontrast T1-weighted images) on a 1.5T scanner (Avanto Tim; Siemens, Erlangen, Germany). The clinical imaging protocol of DTI and DSC perfusion imaging is described in On-line Table 2.

Image Analysis

Conventional Imaging.

Two blinded neuroradiologists (B.T. and C.K. with >15 years' experience) evaluated the conventional imaging sequences. The images were assessed for various imaging characteristics: size range (2–5 cm, >5 cm); T1 signal intensity (SI) as isointense, hypointense, or heterogeneous in relation to normal white matter; T2 sequences for intralesional hyper-/heterogeneous SI; the presence or absence of a hypointense rim; perilesional hyperintensity (mild, 1 cm; moderate, 1–3 cm; and severe, >3 cm); postcontrast enhancement (solid, uniform enhancement; ringlike, open/complete/incomplete enhancement of the rim; and heterogeneous, diffuse/patchy, or punctate areas); and mass effect (mild sulcal effacement; moderate, uncal/falcine herniation of <1 cm; and severe herniation of >1 cm). By imaging features, patients were then grouped into TDL and HGG categories. Interrater differences were resolved through consensus.

DTI Analysis.

Data of patients were postprocessed with the Neuro 3D application on a syngo workstation (Siemens). The DTI maps were reviewed alongside FLAIR and contrast-enhanced T1-weighted images. Multiple ROIs (3–5) of 4–10 mm2 were then placed on the hyperintense zone on trace images corresponding to enhancing areas on contrast-enhanced T1-weighted images to obtain the mean eigenvalues (λ1, λ2, λ3), as shown in On-line Fig 1. The ROIs were drawn manually in consensus by 2 senior residents (S.B.H. and A.M.). The central nonenhancing areas were not evaluated in the study. The averages of the multiple eigenvalues were used to calculate the diffusion metrics (ie, ADC, FA, p, q, and L) in the enhancing areas. The same procedure was repeated in perilesional FLAIR hyperintense areas beyond enhancing margins and contralateral normal-appearing white matter (NAWM).

DSC Perfusion Imaging.

T2* DSC perfusion imaging data were postprocessed with motion correction by using the perfusion application on the syngo workstation. Postprocessing algorithms were not applied for leakage correction. Circular ROIs were placed on areas of maximum CBV within the lesion and contralateral NAWM as shown in On-line Fig 1. The normal vessels and necrotic areas were avoided during placement of ROIs. The rCBV values were calculated as the ratio of maximum CBV within the lesion to the CBV in the contralateral NAWM.

Statistical Analysis

Statistical analysis of all datasets was performed with SPSS, Version 22 (IBM, Armonk, New York). We used the Student t test and χ2 test, respectively, to compare age and sex distributions between TDL and HGG. The χ2 test was used to assess the significance of imaging findings on conventional imaging. A 2 × 2 contingency table was used to determine the sensitivity, specificity, and positive and negative predictive values of conventional imaging sequences to diagnose HGG. The Cohen κ coefficient was used for interrater agreement of various imaging findings.

Comparisons between diffusion metrics in enhancing, perilesional hyperintense areas and the rCBV between TDL and HGG for statistical significance were performed by using 1-way ANOVA. A P value < .05 indicated a statistically significant difference. When the statistical difference was significant, receiver operating characteristic (ROC) curves were used to estimate the area under the curve (AUC) and to calculate the cutoff levels. The highest sum of sensitivity and specificity was considered to establish cutoff values in differentiating TDL and HGG. Finally, combined ROCs were obtained with DTI and DSC parameters and a combination of DTI, DSC parameters, and a heterogeneous enhancement pattern.

Results

Age and Sex Distribution

The Student t test and χ2 analysis were not significant for the differences in age groups (TDL versus HGG; mean age, 37.5 ± 16.6 years versus 45.6 ± 15.1 years; P = .508) and sex distribution (P = .342) between TDL and HGG.

Conventional Imaging Sequences

The results of conventional imaging analysis and interrater reliability are given in Table 1 and On-line Table 3. The lesion size, intralesional T2 SI, mass effect, and perilesional hyperintensity failed to show statistical significance. T1 SI, T2 hypointense rim, and enhancement pattern showed statistical significance with P < .05. Conventional imaging sequences had a sensitivity of 80.9% (95% CI, 57.4%–93.7%), a specificity of 57.1% (95% CI, 29.6%–81.1%), a positive predictive value of 73.9% (95% CI, 51.3%–88.9%), and a negative predictive value of 66.6% (95% CI, 35.4%–88.7%) with P = .049 in diagnosing HGG. The interrater reliability ranged from 0.68 for edema and T1 SI to 0.95 for lesion size.

View this table:
  • View inline
  • View popup
Table 1:

Analysis of conventional imaging sequences

Diffusion Metrics and Perfusion Analysis

The mean values of ADC, FA, p, q, L, and rCBV and results of 1-way ANOVA for the enhancing, perilesional hyperintense areas and the contralateral NAWM of TDL and HGG are detailed in Table 2. Examples of conventional imaging, DTI eigen maps, and DSC perfusion of TDL and HGG used in the study are shown in On-line Figs 2, 3, and 4. The mean values of p, L, and ADC of the enhancing portions of both TDL and HGG were variably higher; q was lower, compared with contralateral NAWM (Table 3 and Fig 1). The mean values of ADC, p, q, and L demonstrated a significant statistical difference between enhancing portions in TDL and HGG (P ≤ .02).

View this table:
  • View inline
  • View popup
Table 2:

Summary of results, mean ± SD

View this table:
  • View inline
  • View popup
Table 3:

ROC curve results on sensitivity and specificity to differentiate high-grade gliomas and TDLs

Fig 1.
  • Download figure
  • Open in new tab
  • Download powerpoint
Fig 1.

The boxplots for DTI metrics with statistical significance: p (A), q (B), L (C), and ADC (D) values of the enhancing areas and normal-appearing white matter in TDL and HGG, respectively.

The mean FA values were lower in both TDL and HGG compared with NAWM and showed no statistically significant difference (P = .34) between enhancing portions in TDL (0.21 ± 0.06) and HGG (0.23 ± 0.06).

All the mean values of DTI metrics except q were higher in perilesional hyperintensity compared with NAWM and showed no statistically significant difference between TDL and HGG. The mean values of rCBV were higher in HGG compared with tumefactive demyelination (P < .01).

Receiver Operating Characteristic Curve Analysis

The ROC curve analysis for ADC, p, q, L, and rCBV values between TDL and high-grade gliomas is shown in Fig 2. The sensitivity, specificity, and area under the curve for the same are detailed in Table 3. The AUC of ROC analysis was fair for ADC, p, and L (0.70–0.80) and good for q (>0.80) in differentiating between them.18 The sensitivity was highest for L; the specificity was highest for ADC, q, and rCBV, with diagnostic accuracy being highest for q (AUC = 0.823). When the DTI measurements were combined with rCBV, significant improvement was made in the AUC (0.901) with the sum of sensitivity and specificity of 164.3%. Addition of heterogeneous enhancement pattern to DTI and DSC parameters improved diagnostic accuracy, AUC (0.966) and sensitivity (85.7%).

Fig 2.
  • Download figure
  • Open in new tab
  • Download powerpoint
Fig 2.

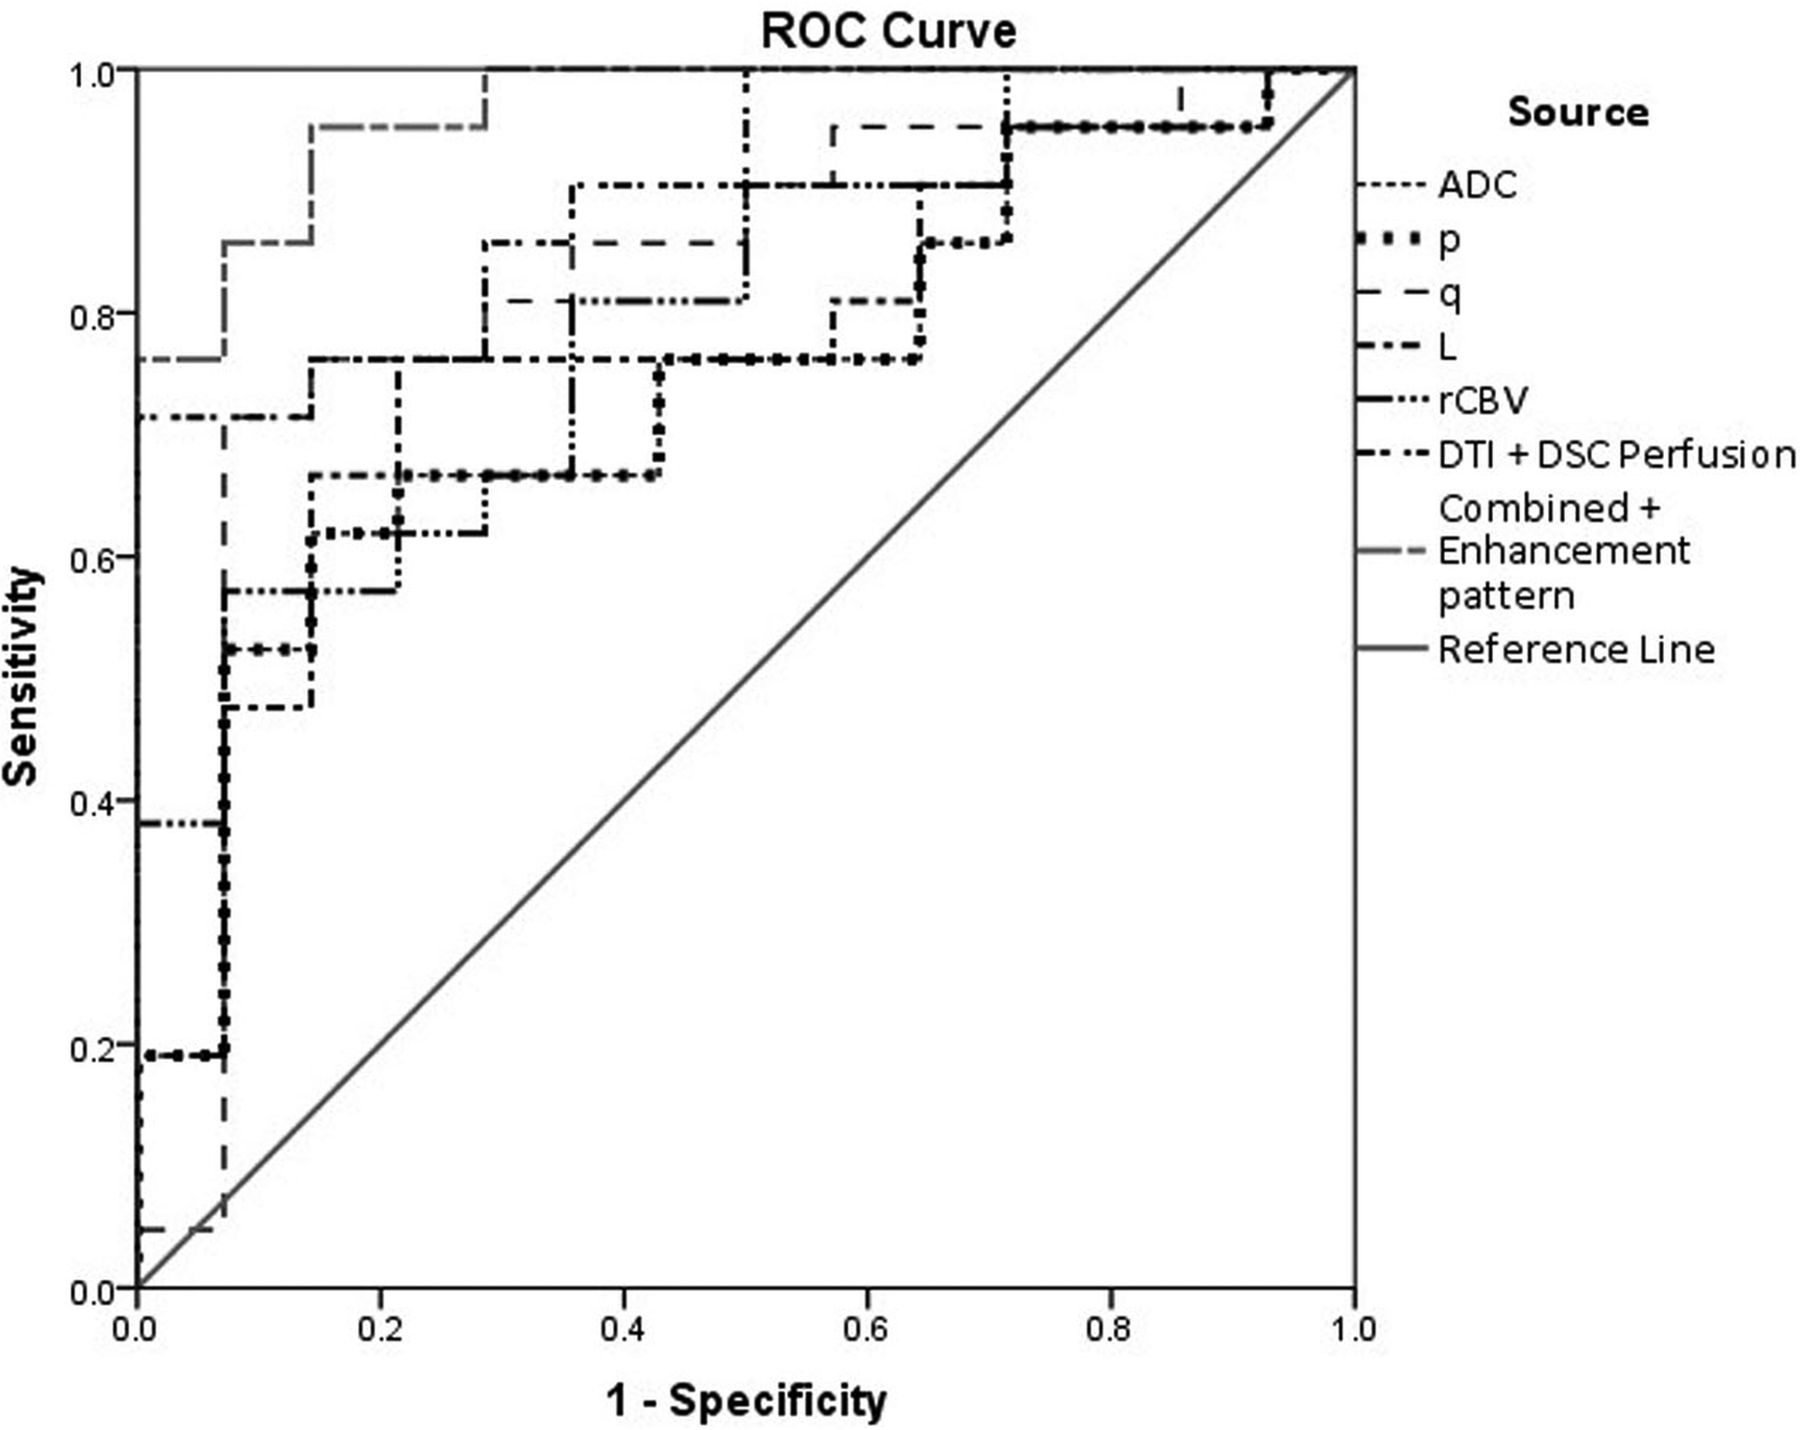
ROC curve for the diffusion tensor metrics: rCBV, combined ROC of DTI metrics and DSC perfusion, and combined ROC of enhancement pattern with DTI metrics and DSC perfusion.

Discussion

The present study analyzes the role of conventional imaging, diffusion metrics, and p:q tensor decomposition in differentiating TDL and HGG, along with rCBV values.

Conventional Imaging

Among the imaging features, T1 SI, the presence of T2 hypointense rim, and enhancement pattern showed statistical significance. TDLs were mostly hypointense (78.6%), and HGGs were commonly hypointense (52.4%), followed by heterogeneous SI (32.4%) on T1-weighted images. No similar studies are available for comparison between T1 SI in TDL and HGG, to our knowledge. The higher incidence of heterogeneous SI in HGG could be attributed to intralesional hemorrhage. We report a higher incidence of a T2 hypointense rim in TDLs than in HGGs. A heterogeneous enhancement was seen in almost all patients with HGG, and ring enhancement, in 50% of patients with TDL, in line with results of Lucchinetti et al.19 The conventional imaging sequences showed high sensitivity with low specificity, which can be attributed to atypical findings in TDL, such as large size, nodular ring, or heterogeneous enhancement and significant mass effect with edema.

DTI Metrics in Enhancing and Perilesional Hyperintense Areas

This study shows an increase in mean ADC and p with a decrease in q in both TDL and HGG compared with contralateral NAWM. The magnitude of total diffusion is increased compared with contralateral NAWM in TDL and HGG. Mabray et al20 reported a significant reduction in minimum ADC values in HGG, attributing it to high tumor cellularity. However, the mean ADC values in HGG were similar to those in our study.

The enhancing rim comprises cellular areas with interspersed necrosis and microvascular proliferation. Hence, we used the average of mean DTI values, which are more representative of lesional heterogeneity because the minimum diffusion values depict only the cellular areas of the lesion.

FA values showed no statistically significant difference between TDL and HGG in the present study. The variations in DTI metrics in the nonenhancing center were not analyzed as in Saini et al21; however, there was no statistical difference in mean diffusivity of the enhancing areas (P = .21) and NAWM (P = .09) in both the studies. The DTI metrics showed no statistically significant difference in perilesional hyperintense areas between TDL and HGG.

Pathologic Basis for Changes in DTI Metrics

On histopathology, the active TDL shows abundant inflammatory infiltrates comprising lymphocytes, activated macrophages, and some plasma cells, with near-total myelin loss and macrophages containing remnants of phagocytosed myelin and axons.6,22 The extent of axonal loss ranges from 20% to 80%, with pronounced reduction in the active stage, with an average decrease of 30%.23,24 TDL also shows disruption of the blood-brain barrier due to inflammatory infiltrates with postgadolinium enhancement. HGG is characterized by hyperchromatic nuclei, irregularly distributed neoplastic astrocytes, atypical mitotic figures with necrosis, and microvascular proliferation.7

The mean ADC values were higher due to an increase in interstitial water in TDL and HGG compared with NAWM. However, the ADC in enhancing areas was lower in TDL than in HGG. Similar high ADC values in HGG were reported by Murakami et al,25 which could be attributed to increased microvascular proliferation and interspersed areas of necrosis in highly cellular heterogeneously enhancing rim. Likewise, a reduction in ADC in TDL could be due to accentuated inflammatory infiltrates and microglial proliferation, contributing to the reduced free motion of water. The mean values of p were more reduced in TDL than in HGG as expected; this difference was attributable to changes in cellularity. The mean value of q was also decreased in TDL compared with HGG. The integrity of myelin is a major determinant of anisotropy; hence, changes in q can be attributed to near-complete myelin loss, which usually occurs more often in TDL than in HGG. Because L is the sum of isotropic and anisotropic components of diffusion, a decrease in both p and q leads to a decrease in L within the enhancing areas of the lesion. The results of our study show that diffusion metrics (ie, ADC, p, q, and L) are reliable biomarkers for differentiating TDL and HGG, with q being the single best marker.

Many studies reported decreased mean FA values in enhancing areas compared with NAWM in TDL and HGG, with significant variability.11⇓⇓–14,26⇓–28 The reduction in mean FA values is due to axonal degeneration and reactive glial proliferation in TDL and tissue destruction, infiltration, and displacement of adjacent white matter by tumor cells in HGG. Hence, the mean values of FA are determined by the balance between factors causing decreased anisotropy, such as tissue destruction and increased anisotropy, such as increased cellularity (ie, FA varies as a function of the ratio of q and L, FA = Embedded Image). Hence, we prefer p:q tensor decomposition to ADC and FA measurements alone for assessing microstructural alterations.

DSC Perfusion

In our study, the mean rCBV in TDL was 2.11 ± 1.12, similar to findings of Blasel et al,4 who reported high rCBV with a mean of 2.89 ± 1.79 and maximum of 6.74 in TDL compared with previous studies with rCBV < 2.18,29 The high rCBV in TDL is possibly due to angiogenesis and vasodilation in both acute and chronic demyelinating plaques, which contribute to disease progression.6,30⇓⇓–33 The mean value of rCBV in HGG in our study was 3.77 ± 1.65, which is similar to that in previous studies.34

ADC, q, and rCBV values showed the highest specificity (92.9% each) in differentiating these lesions in the present study. The combination of DTI and DSC parameters significantly improved the AUC (0.901), with increased AUC (0.966) and sensitivity (85.7%) after the addition of a heterogeneous enhancement pattern to DTI and DSC parameters. Due to significant variability in ADC and FA values, we prefer p:q tensor decomposition and a combination of DTI metrics and DSC perfusion because they might contribute significantly toward differentiating TDL and HGG.

The potential directions of future research could be toward development of a clinical workstation–based application for quantitative DTI analysis. A recent study has suggested the possibility of predicting grades of meningiomas by ADC values derived from a clinical workstation.35 Future studies could evaluate the feasibility of automated segmentation of lesions and computer-aided diagnosis by using DTI parameters and other variables included in our study.

The present study has a few limitations. A relatively small number of subjects with enhancing lesions were included in this retrospective study, accounting for the possible inflation in predictive values. A prospective study with a larger population should address the matter. Second, we did not have histopathologic confirmation in all TDLs. Third, the absence of leakage correction in DSC perfusion could lead to spurious high rCBV values. However, rCBV values of TDL and HGG in our study were similar to those in previous studies. Fourth, study results might be biased due to manual placement of ROIs, which affects all such ROI-based studies. Finally, further studies with minimum or maximum values of diffusion in the enhancing areas are needed to evaluate their usefulness as indicators of pathologic changes in both of these lesions.

Conclusions

Diffusion tensor imaging is a noninvasive method of evaluating myelin and axonal integrity. TDLs are large demyelinating lesions that can mimic HGGs on conventional imaging and can show higher rCBV values. Evaluation of ADC, p, q, and L may be helpful in differentiating TDLs from HGG in such cases. The combination of diffusion tensor metrics and DSC perfusion can significantly improve the diagnostic accuracy and might improve treatment planning by avoiding the need for an invasive biopsy.

Footnotes

  • Disclosures: Tirur Raman Kapilamoorthy—UNRELATED: Grants/Grants Pending: GE Healthcare,* Comments: research project grant. Bejoy Thomas—UNRELATED: Grants/Grants Pending: GE Healthcare,* Comments: research project grant; Patents (Planned, Pending, or Issued): Sree Chitra Tirunal Institute for Medical Sciences and Technology,* Comments: intramural project, Indian patent application filed. *Money paid to the institution.

REFERENCES

  1. 1.↵
    1. Dagher AP,
    2. Smirniotopoulos J
    . Tumefactive demyelinating lesions. Neuroradiology 1996;38:560–65 doi:10.1007/BF00626098 pmid:8880719
    CrossRefPubMed
  2. 2.↵
    1. Given CA 2nd.,
    2. Stevens BS,
    3. Lee C
    . The MRI appearance of tumefactive demyelinating lesions. AJR Am J Roentgenol 2004;182:195–99 doi:10.2214/ajr.182.1.1820195 pmid:14684539
    CrossRefPubMed
  3. 3.↵
    1. Masdeu JC,
    2. Quinto C,
    3. Olivera C, et al
    . Open-ring imaging sign: highly specific for atypical brain demyelination. Neurology 2000;54:1427–33 doi:10.1212/WNL.54.7.1427 pmid:10751251
    Abstract/FREE Full Text
  4. 4.↵
    1. Blasel S,
    2. Pfeilschifter W,
    3. Jansen V, et al
    . Metabolism and regional cerebral blood volume in autoimmune inflammatory demyelinating lesions mimicking malignant gliomas. J Neurol 2011;258:113–22 doi:10.1007/s00415-010-5703-4 pmid:20803026
    CrossRefPubMed
  5. 5.↵
    1. Zagzag D,
    2. Miller DC,
    3. Kleinman GM, et al
    . Demyelinating disease versus tumor in surgical neuropathology: clues to a correct pathological diagnosis. Am J Surg Pathol 1993;17:537–45 doi:10.1097/00000478-199306000-00001 pmid:8333553
    CrossRefPubMed
  6. 6.↵
    1. Hu W,
    2. Lucchinetti CF
    . The pathological spectrum of CNS inflammatory demyelinating diseases. Semin Immunopathol 2009;31:439–53 doi:10.1007/s00281-009-0178-z pmid:19779719
    CrossRefPubMed
  7. 7.↵
    1. Neelima R,
    2. Krishnakumar RK,
    3. Nair MD, et al
    . Tumefactive demyelinating lesions: a clinicopathological correlative study. Indian J Pathol Microbiol 2012;55:496–500 doi:10.4103/0377-4929.107788 pmid:23455787
    CrossRefPubMed
  8. 8.↵
    1. Bahn MM
    . Invariant and orthonormal scalar measures derived from magnetic resonance diffusion tensor imaging. J Magn Reson 1999;141:68–77 doi:10.1006/jmre.1999.1875 pmid:10527745
    CrossRefPubMed
  9. 9.↵
    1. Green HA,
    2. Peña A,
    3. Price CJ, et al
    . Increased anisotropy in acute stroke: a possible explanation. Stroke 2002;33:1517–21 doi:10.1161/01.STR.0000016973.80180.7B pmid:12052984
    Abstract/FREE Full Text
  10. 10.↵
    1. Peña A,
    2. Green HA,
    3. Carpenter TA, et al
    . Enhanced visualization and quantification of magnetic resonance diffusion tensor imaging using the p:q tensor decomposition. Br J Radiol 2006;79:101–09 doi:10.1259/bjr/24908512 pmid:16489190
    Abstract/FREE Full Text
  11. 11.↵
    1. Price SJ,
    2. Peña A,
    3. Burnet NG, et al
    . Tissue signature characterisation of diffusion tensor abnormalities in cerebral gliomas. Eur Radiol 2004;14:1909–17 pmid:15221264
    PubMed
  12. 12.↵
    1. Wang W,
    2. Steward CE,
    3. Desmond PM
    . Diffusion tensor imaging in glioblastoma multiforme and brain metastases: the role of p, q, L, and fractional anisotropy. AJNR Am J Neuroradiol 2009;30:203–08 pmid:18842762
    Abstract/FREE Full Text
  13. 13.↵
    1. Toh CH,
    2. Castillo M,
    3. Wong AM, et al
    . Primary cerebral lymphoma and glioblastoma multiforme: differences in diffusion characteristics evaluated with diffusion tensor imaging. AJNR Am J Neuroradiol 2008;29:471–75 doi:10.3174/ajnr.A0872 pmid:18065516
    Abstract/FREE Full Text
  14. 14.↵
    1. Toh CH,
    2. Wei KC,
    3. Ng SH, et al
    . Differentiation of tumefactive demyelinating lesions from high-grade gliomas with the use of diffusion tensor imaging. AJNR Am J Neuroradiol 2012;33:846–51 doi:10.3174/ajnr.A2871 pmid:22173757
    Abstract/FREE Full Text
  15. 15.↵
    1. Law M,
    2. Yang S,
    3. Wang H, et al
    . Glioma grading: sensitivity, specificity, and predictive values of perfusion MR imaging and proton MR spectroscopic imaging compared with conventional MR imaging. AJNR Am J Neuroradiol 2003;24:1989–98 pmid:14625221
    Abstract/FREE Full Text
  16. 16.↵
    1. Hakyemez B,
    2. Erdogan C,
    3. Ercan I, et al
    . High-grade and low-grade gliomas: differentiation by using perfusion MR imaging. Clin Radiol 2005;60:493–502 doi:10.1016/j.crad.2004.09.009 pmid:15767107
    CrossRefPubMed
  17. 17.↵
    1. Cha S,
    2. Pierce S,
    3. Knopp EA, et al
    . Dynamic contrast-enhanced T2*-weighted MR imaging of tumefactive demyelinating lesions. AJNR Am J Neuroradiol 2001;22:1109–16 pmid:11415906
    Abstract/FREE Full Text
  18. 18.↵
    The Area Under an ROC Curve. http://gim.unmc.edu/dxtests/ROC3.htm. Accessed February 2, 2016.
  19. 19.↵
    1. Lucchinetti CF,
    2. Gavrilova RH,
    3. Metz I, et al
    . Clinical and radiographic spectrum of pathologically confirmed tumefactive multiple sclerosis. Brain 2008;131:1759–75 doi:10.1093/brain/awn098 pmid:18535080
    Abstract/FREE Full Text
  20. 20.↵
    1. Mabray MC,
    2. Cohen BA,
    3. Villanueva-Meyer JE, et al
    . Performance of apparent diffusion coefficient values and conventional MRI features in differentiating tumefactive demyelinating lesions from primary brain neoplasms. AJR Am J Roentgenol 2015;205:1075–85 doi:10.2214/AJR.14.13970 pmid:26496556
    CrossRefPubMed
  21. 21.↵
    1. Saini J,
    2. Chatterjee S,
    3. Thomas B, et al
    . Conventional and advanced magnetic resonance imaging in tumefactive demyelination. Acta Radiol 2011;52:1159–68 doi:10.1258/ar.2011.110007 pmid:22025739
    CrossRefPubMed
  22. 22.↵
    1. Lassmann H
    . Pathologic substrate of magnetic resonance alterations in multiple sclerosis. Neuroimaging Clin N Am 2008;18:563–76, ix doi:10.1016/j.nic.2008.06.005 pmid:19068402
    CrossRefPubMed
  23. 23.↵
    1. Ferguson B,
    2. Matyszak MK,
    3. Esiri MM, et al
    . Axonal damage in acute multiple sclerosis lesions. Brain 1997;120:393–99 doi:10.1093/brain/120.3.393 pmid:9126051
    Abstract/FREE Full Text
  24. 24.↵
    1. Kornek B,
    2. Storch M,
    3. Weissert R, et al
    . Multiple sclerosis and chronic autoimmune encephalomyelitis: a comparative quantitative study of axonal injury in active, inactive and remyelinated lesions. Am J Pathol 2000;157:267–76 doi:10.1016/S0002-9440(10)64537-3 pmid:10880396
    CrossRefPubMed
  25. 25.↵
    1. Murakami R,
    2. Hirai T,
    3. Sugahara T, et al
    . Grading astrocytic tumors by using apparent diffusion coefficient parameters: superiority of a one- versus two-parameter pilot method. Radiology 2009;251:838–45 doi:10.1148/radiol.2513080899 pmid:19318585
    CrossRefPubMed
  26. 26.↵
    1. Beppu T,
    2. Inoue T,
    3. Shibata Y, et al
    . Measurement of fractional anisotropy using diffusion tensor MRI in supratentorial astrocytic tumours. J Neurooncol 2003;63:109–16 doi:10.1023/A:1023977520909 pmid:12825815
    CrossRefPubMed
  27. 27.↵
    1. Goebell E,
    2. Fiehler J,
    3. Ding XQ, et al
    . Disarrangement of fiber tracts and decline of neuronal density correlate in glioma patient: a combined diffusion tensor imaging and 1H-MR spectroscopy study. AJNR Am J Neuroradiol 2006;27:1427–31 pmid:16908551
    PubMed
  28. 28.↵
    1. Ceccarelli A,
    2. Rocca M,
    3. Falini A, et al
    . Normal appearing white and grey matter damage in MS: a volumetric and diffusion tensor MRI study at 3.0 Tesla. J Neurol 2007;254:513–18 doi:10.1007/s00415-006-0408-4 pmid:17401516
    CrossRefPubMed
  29. 29.↵
    1. Tsui EY,
    2. Leung WH,
    3. Chan JH, et al
    . Tumefactive demyelinating lesions by combined perfusion-weighted and diffusion weighted imaging. Comput Med Imaging Graph 2002;26:343–46 doi:10.1016/S0895-6111(02)00017-4 pmid:12204240
    CrossRefPubMed
  30. 30.↵
    1. Kirk J,
    2. Plumb J,
    3. Mirakhur M, et al
    . Tight junctional abnormality in multiple sclerosis white matter affects all calibres of vessel and is associated with blood-brain barrier leakage and active demyelination. J Pathol 2003;201:319–27 doi:10.1002/path.1434 pmid:14517850
    CrossRefPubMed
  31. 31.↵
    1. Proescholdt MA,
    2. Jacobson S,
    3. Tresser N, et al
    . Vascular endothelial growth factor is expressed in multiple sclerosis plaques and can induce inflammatory lesions in experimental allergic encephalomyelitis rats. J Neuropathol Exp Neurol 2002;61:914–25 doi:10.1093/jnen/61.10.914 pmid:12387457
    CrossRefPubMed
  32. 32.↵
    1. Jackson JR,
    2. Seed MP,
    3. Kircher CH, et al
    . The codependence of angiogenesis and chronic inflammation. FASEB J 1997;11:457–65 pmid:9194526
    Abstract
  33. 33.↵
    1. Ludwin S,
    2. Henry J,
    3. McFarland H
    . Vascular proliferation and angiogenesis in MS: clinical and pathogenic implications [abstract]. J Neuropathol Exp Neurol 2001;60:505
  34. 34.↵
    1. Mangla R,
    2. Ginat DT,
    3. Kamalian S, et al
    . Correlation between progression free survival and dynamic susceptibility contrast MRI perfusion in WHO grade III glioma subtypes. J Neurooncol 2014;116:325–31 doi:10.1007/s11060-013-1298-9 pmid:24178441
    CrossRefPubMed
  35. 35.↵
    1. Hirunpat S,
    2. Sanghan N,
    3. Watcharakul C, et al
    . Is apparent diffusion coefficient value measured on picture archiving and communication system workstation helpful in prediction of high-grade meningioma? Hong Kong J Radiol 2016;19:84–90 doi:10.12809/hkjr1615346
    CrossRef
  • Received June 22, 2016.
  • Accepted after revision December 4, 2016.
  • © 2017 by American Journal of Neuroradiology
View Abstract
PreviousNext
Back to top

In this issue

American Journal of Neuroradiology: 38 (4)
American Journal of Neuroradiology
Vol. 38, Issue 4
1 Apr 2017
  • Table of Contents
  • Index by author
  • Complete Issue (PDF)
Advertisement
Print
Download PDF
Email Article

Thank you for your interest in spreading the word on American Journal of Neuroradiology.

NOTE: We only request your email address so that the person you are recommending the page to knows that you wanted them to see it, and that it is not junk mail. We do not capture any email address.

Enter multiple addresses on separate lines or separate them with commas.
Combining Diffusion Tensor Metrics and DSC Perfusion Imaging: Can It Improve the Diagnostic Accuracy in Differentiating Tumefactive Demyelination from High-Grade Glioma?
(Your Name) has sent you a message from American Journal of Neuroradiology
(Your Name) thought you would like to see the American Journal of Neuroradiology web site.
CAPTCHA
This question is for testing whether or not you are a human visitor and to prevent automated spam submissions.
Cite this article
S.B. Hiremath, A. Muraleedharan, S. Kumar, C. Nagesh, C. Kesavadas, M. Abraham, T.R. Kapilamoorthy, B. Thomas
Combining Diffusion Tensor Metrics and DSC Perfusion Imaging: Can It Improve the Diagnostic Accuracy in Differentiating Tumefactive Demyelination from High-Grade Glioma?
American Journal of Neuroradiology Apr 2017, 38 (4) 685-690; DOI: 10.3174/ajnr.A5089

Citation Manager Formats

  • BibTeX
  • Bookends
  • EasyBib
  • EndNote (tagged)
  • EndNote 8 (xml)
  • Medlars
  • Mendeley
  • Papers
  • RefWorks Tagged
  • Ref Manager
  • RIS
  • Zotero
0 Responses
Respond to this article
Share
Bookmark this article
Combining Diffusion Tensor Metrics and DSC Perfusion Imaging: Can It Improve the Diagnostic Accuracy in Differentiating Tumefactive Demyelination from High-Grade Glioma?
S.B. Hiremath, A. Muraleedharan, S. Kumar, C. Nagesh, C. Kesavadas, M. Abraham, T.R. Kapilamoorthy, B. Thomas
American Journal of Neuroradiology Apr 2017, 38 (4) 685-690; DOI: 10.3174/ajnr.A5089
del.icio.us logo Twitter logo Facebook logo Mendeley logo
  • Tweet Widget
  • Facebook Like
  • Google Plus One
Purchase

Jump to section

  • Article
    • Abstract
    • ABBREVIATIONS:
    • Materials and Methods
    • Results
    • Discussion
    • Conclusions
    • Footnotes
    • REFERENCES
  • Figures & Data
  • Supplemental
  • Info & Metrics
  • Responses
  • References
  • PDF

Related Articles

  • PubMed
  • Google Scholar

Cited By...

  • DSC MR Perfusion at 7T MRI: An Initial Single-Center Study for Validity and Practicability
  • Tumefactive demyelinating lesions: A literature review of recent findings
  • MRI Findings in Tumefactive Demyelinating Lesions: A Systematic Review and Meta-Analysis
  • Crossref (26)
  • Google Scholar

This article has been cited by the following articles in journals that are participating in Crossref Cited-by Linking.

  • Clinical applications of artificial intelligence and radiomics in neuro-oncology imaging
    Ahmed Abdel Khalek Abdel Razek, Ahmed Alksas, Mohamed Shehata, Amr AbdelKhalek, Khaled Abdel Baky, Ayman El-Baz, Eman Helmy
    Insights into Imaging 2021 12 1
  • MRI Findings in Tumefactive Demyelinating Lesions: A Systematic Review and Meta-Analysis
    C.H. Suh, H.S. Kim, S.C. Jung, C.G. Choi, S.J. Kim
    American Journal of Neuroradiology 2018 39 9
  • A Review of Clinical and Imaging Findings in Tumefactive Demyelination
    Mariko Nakayama, Shotaro Naganawa, Michelle Ouyang, Karra A. Jones, John Kim, Aristides A. Capizzano, Toshio Moritani
    American Journal of Roentgenology 2021 217 1
  • ABCD1 dysfunction alters white matter microvascular perfusion
    Arne Lauer, Xiao Da, Mikkel Bo Hansen, Gregoire Boulouis, Yangming Ou, Xuezhu Cai, Afonso Liberato Celso Pedrotti, Jayashree Kalpathy-Cramer, Paul Caruso, Douglas L Hayden, Natalia Rost, Kim Mouridsen, Florian S Eichler, Bruce Rosen, Patricia L Musolino
    Brain 2017 140 12
  • Arterial spin labeling perfusion: Prospective MR imaging in differentiating neoplastic from non-neoplastic intra-axial brain lesions
    Neetu Soni, Karthika Srindharan, Sunil Kumar, Prabhakar Mishra, Girish Bathla, Jyantee Kalita, Sanjay Behari
    The Neuroradiology Journal 2018 31 6
  • Distinguishing brain inflammation from grade II glioma in population without contrast enhancement: a radiomics analysis based on conventional MRI
    Yu Han, Yang Yang, Zhe-sheng Shi, An-ding Zhang, Lin-feng Yan, Yu-chuan Hu, Lan-lan Feng, Jiao Ma, Wen Wang, Guang-bin Cui
    European Journal of Radiology 2021 134
  • Atypical inflammatory demyelinating lesions and atypical multiple sclerosis
    X. Ayrignac, C. Carra-Dallière, P. Labauge
    Revue Neurologique 2018 174 6
  • Hemodynamic Imaging in Cerebral Diffuse Glioma—Part A: Concept, Differential Diagnosis and Tumor Grading
    Lelio Guida, Vittorio Stumpo, Jacopo Bellomo, Christiaan Hendrik Bas van Niftrik, Martina Sebök, Moncef Berhouma, Andrea Bink, Michael Weller, Zsolt Kulcsar, Luca Regli, Jorn Fierstra
    Cancers 2022 14 6
  • Differential imaging of atypical demyelinating lesions of the central nervous system
    Matteo Paoletti, Shaun Ivan Muzic, Francesca Marchetti, Lisa Maria Farina, Stefano Bastianello, Anna Pichiecchio
    La radiologia medica 2021 126 6
  • Multiple sclerosis with atypical MRI presentation: Results of a nationwide multicenter study in 57 consecutive cases
    Pekes Codjia, Xavier Ayrignac, Clarisse Carra-Dalliere, Mikael Cohen, Mahmoud Charif, Anais Lippi, Nicolas Collongues, Lucas Corti, Jerome De Seze, Christine Lebrun, Sandra Vukusic, Francoise Durand-Dubief, Pierre Labauge
    Multiple Sclerosis and Related Disorders 2019 28

More in this TOC Section

  • Diagnostic Neuroradiology of Monoclonal Antibodies
  • Clinical Outcomes After Chiari I Decompression
  • Segmentation of Brain Metastases with BLAST
Show more Adult Brain

Similar Articles

Advertisement

Indexed Content

  • Current Issue
  • Accepted Manuscripts
  • Article Preview
  • Past Issues
  • Editorials
  • Editor's Choice
  • Fellows' Journal Club
  • Letters to the Editor
  • Video Articles

Cases

  • Case Collection
  • Archive - Case of the Week
  • Archive - Case of the Month
  • Archive - Classic Case

Special Collections

  • AJNR Awards
  • ASNR Foundation Special Collection
  • Most Impactful AJNR Articles
  • Photon-Counting CT
  • Spinal CSF Leak Articles (Jan 2020-June 2024)

More from AJNR

  • Trainee Corner
  • Imaging Protocols
  • MRI Safety Corner

Multimedia

  • AJNR Podcasts
  • AJNR Scantastics

Resources

  • Turnaround Time
  • Submit a Manuscript
  • Submit a Video Article
  • Submit an eLetter to the Editor/Response
  • Manuscript Submission Guidelines
  • Statistical Tips
  • Fast Publishing of Accepted Manuscripts
  • Graphical Abstract Preparation
  • Imaging Protocol Submission
  • Evidence-Based Medicine Level Guide
  • Publishing Checklists
  • Author Policies
  • Become a Reviewer/Academy of Reviewers
  • News and Updates

About Us

  • About AJNR
  • Editorial Board
  • Editorial Board Alumni
  • Alerts
  • Permissions
  • Not an AJNR Subscriber? Join Now
  • Advertise with Us
  • Librarian Resources
  • Feedback
  • Terms and Conditions
  • AJNR Editorial Board Alumni

American Society of Neuroradiology

  • Not an ASNR Member? Join Now

© 2025 by the American Society of Neuroradiology All rights, including for text and data mining, AI training, and similar technologies, are reserved.
Print ISSN: 0195-6108 Online ISSN: 1936-959X

Powered by HighWire