
Abstract
BACKGROUND AND PURPOSE: Clinical brain MR imaging registration algorithms are often made available by commercial vendors without figures of merit. The purpose of this study was to suggest a rational performance comparison methodology for these products.
MATERIALS AND METHODS: Twenty patients were imaged on clinical 3T scanners by using 4 sequences: T2-weighted, FLAIR, susceptibility-weighted angiography, and T1 postcontrast. Fiducial landmark sites (n = 1175) were specified throughout these image volumes to define identical anatomic locations across sequences. Multiple registration algorithms were applied by using the T2 sequence as a fixed reference. Euclidean error was calculated before and after each registration and compared with a criterion standard landmark registration. The Euclidean effectiveness ratio is the fraction of Euclidean error remaining after registration, and the statistical effectiveness ratio is similar, but accounts for dispersion and noise.
RESULTS: Before registration, error values for FLAIR, susceptibility-weighted angiography, and T1 postcontrast were 2.07 ± 0.55 mm, 2.63 ± 0.62 mm, and 3.65 ± 2.00 mm, respectively. Postregistration, the best error values for FLAIR, susceptibility-weighted angiography, and T1 postcontrast were 1.55 ± 0.46 mm, 1.34 ± 0.23 mm, and 1.06 ± 0.16 mm, with Euclidean effectiveness ratio values of 0.493, 0.181, and 0.096 and statistical effectiveness ratio values of 0.573, 0.352, and 0.929 for rigid mutual information, affine mutual information, and a commercial GE registration, respectively.
CONCLUSIONS: We demonstrate a method for comparing the performance of registration algorithms and suggest the Euclidean error, Euclidean effectiveness ratio, and statistical effectiveness ratio as performance metrics for clinical registration algorithms. These figures of merit allow registration algorithms to be rationally compared.
ABBREVIATIONS:
- ANTs
- advanced normalization tools
- AOI
- algorithm of interest
- CC
- cross-correlation
- EER
- Euclidean effectiveness ratio
- LM
- landmarks
- MI
- mutual information
- SER
- statistical effectiveness ratio
- SWAN
- susceptibility-weighted angiography
- T1C
- T1 postcontrast
- TRE
- target-to-registration error
Image registration is an essential step in the analysis of brain MR imaging data from multiple images because it ensures the spatial correspondence of anatomy across complementary information sources for diagnosis and treatment. Most commercially available MR image–analysis software packages have some implementation of image registration, and such techniques have a thorough, well-documented grounding in the literature.1⇓⇓⇓⇓–6
Research publications about new registration methods for MR images of the brain nearly always include quantitative assessments of their performance, while commercial registration solutions are often released without disclosing the performance metrics of the vendor. Furthermore, due to the proprietary nature of these commercial algorithms, the explicit transformations are often not disclosed; thus, there are relatively few publicly available figures of merit to assess the performance of these heavily used commercial solutions that are essential to clinical neuroimaging.
Performance assessments of these products from commercial vendors would be clinically useful, however, such information is seldom available. In a study that used a widely accepted, neurosurgical commercial package, Hoelper et al7 placed 25 anatomic landmarks in T1 and T2 brain volumes to test the registration error for 39 patients, a rare example of a publicly available assessment for a commercial registration solution. They demonstrated that whole-brain volume registrations could have errors ranging from 0.7 to 2 mm, depending on the region of the brain, and they therefore recommended using a volume of interest to improve local registrations when a particular area was important.7 Such knowledge of the behavior of a commercial product can improve its use in the clinic, but if commercial vendors do not use objective metrics to characterize thoroughly the performance of their products and then make these results available, rational choices and improvements cannot be made. This situation is to the ultimate detriment of the patient undergoing treatments that rely on these algorithms being highly accurate.
Within the academic research world, various prior methods have been used to assess the performance of registration algorithms. External, invasive skull-implanted markers have been used as fiducial landmarks to assess CT-MR imaging and PET-MR imaging registrations,4 the 8 corner voxels of a box around the head have been used to assess MR-MR brain registrations,8 and 256 anatomic landmarks throughout the brain have been used to assess intersubject MR-MR registrations.9 An on-line data base of MR imaging and sonography brain volumes also contains 19–40 landmarks per patient to assess registration accuracy.10
In addition to fiducial landmarks, other quantitative and semi-quantitative methodologies for assessment have been used. Examples include tissue edge distances as measured by the Haussdorff distance,11 comparing the resulting transformations with the criterion standard reference transformations,12 using the amount of tissue overlap for equivalent regions,6,13 using image-similarity measures calculated between images,14 and using visual assessments by human observers.15 Extensive neuroimaging algorithm comparison studies have shown that registration performance is minimally affected by the many variations of labeling protocols and overlap measures.6
In light of these examples, there is a real need for simple, objective metrics to serve as figures of merit for clinically used registration algorithms from academic and commercial vendors. The aim of this project was therefore to demonstrate the feasibility of a performance-testing methodology for modern registration algorithms by using fiducial landmark sites in routinely used clinical images. This method was then used to assess the performance of both commercial and open-source registration algorithms as applied to a set of intrasubject, multisequence, MR images of the brain. Internal, anatomic landmark-based fiducials served as the criterion standard against which to measure performance. By calculating several objective metrics of performance from the results of these registrations on clinically acquired data, we show how various methods of registration can be meaningfully compared by end users. We use a limited set of algorithms in demonstration, but any registration algorithm could be substituted and similarly assessed (the authors could be contacted to arrange this).
Materials and Methods
This study was a retrospective analysis of data acquired as part of a Health Insurance Portability and Accountability Act–compliant, institutional review board–approved clinical protocol that required signed consent from study participants.
Images
Patients were consecutively recruited on the basis of specific criteria for inclusion (18 years of age or older, candidate for cerebral tumor resection with suspected or biopsy-proved primary brain tumor) and exclusion (prior brain tumor treatment, including surgical resection, radiation therapy, or chemotherapy). From February 2013 to October 2015, 20 patients (mean age, 45.3 years; range, 21–75 years) were imaged for surgical-planning purposes on Signa HDxt 3T or Discovery MR750 3T clinical scanners (GE Healthcare, Milwaukee, Wisconsin). This cohort included 11 women (mean, 40.7 years; range, 21–75 years) and 9 men (mean, 50.9 years; range, 28–67 years). The imaging protocol (On-line Table 1) included a high-resolution T2-weighted scan (voxel size, 0.5469 × 0.5469 × 2 mm), a FLAIR scan (voxel size, 0.5 × 0.5 × 1 mm), a susceptibility-weighted angiography (SWAN) scan (voxel size, 0.3906 × 0.3906 × 1 mm), and a T1 postcontrast (T1C) scan (voxel size, 0.4688 × 0.4688 × 3.5 mm) obtained after injecting 0.1 mmol/kg of either gadopentetate dimeglumineor gadobutrol (Magnevist; Bayer HealthCare Pharmaceuticals, Wayne, New Jersey; or Gadavist; Bayer Schering Pharma, Berlin, Germany, respectively) at 5 mL/s, followed by 30 mL of saline at 5 mL/s. Because 2 separate contrast doses were needed for the scanning session, the total dosage was 20 mL of Magnevist or Gadavist and 60 mL saline. DICOM image files were converted into the NIfTI file format (https://nifti.nimh.nih.gov/nifti-1) with functions from the Insight ToolKit (https://lhncbc.nlm.nih.gov/project/insight-toolkit).16 Images were skull-stripped by using the Brain Extraction Tool (http://fsl.fmrib.ox.ac.uk/fsl/fslwiki/BET)17 from the FMRIB Software Library (fsl.fmrib.ox.ac.uk), followed by manual refinement of the mask with Amira3D (Version 6.0; FEI, Hillsboro, Oregon) and application of the mask by using Matlab (MathWorks, Natick, Massachusetts). These clinically acquired imaging sequences, with nonisotropic voxel sizes, different section thicknesses, and different contrast mechanisms, were intentionally used for this study to emphasize its real-world applicability, because such images would be registered to each other in the clinic for various purposes.
Landmarks
Fifteen landmarks (LMs) were manually specified per patient sequence, meaning that 60 independent landmark sites were specified across the 4 imaging sequences. For the entire set of 20 patients, 1200 LM points were planned. Landmarks were placed at anatomically distinct locations across the entire brain volume (Fig 1, On-line Fig 1, and On-line Table 2) by using the Amira3D software. All fiducial sites were reviewed by multiple observers (J.S.L., D.S.) with expertise in neuroanatomy, including a neuroradiologist with 15 years' clinical experience (D.S.).
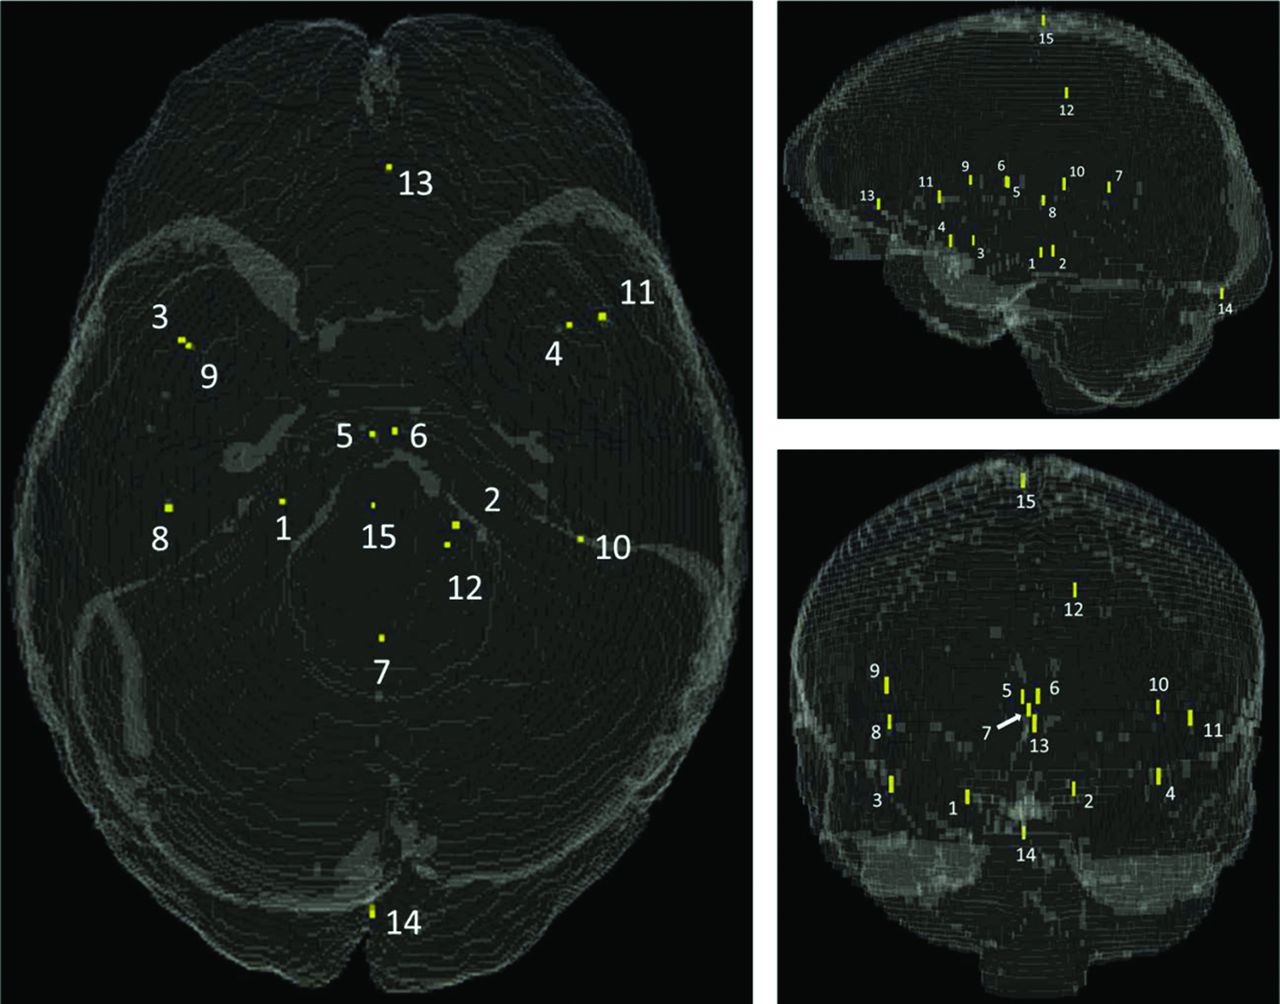
Fiducial landmark locations in a synthetic 3D head volume model. Refer to On-line Table 2 for descriptions and coordinates.
Landmark fiducial sites were chosen for their unambiguous appearance across imaging sequences (ie, vessel intersections, bifurcations, inflection points, and unique geometries), so as to ensure correspondence between homologous sites (On-line Fig 2). The general locations of landmarks were similar across patients, but the exact placements differed from patient to patient because of natural anatomic variations. Landmarks were intended to be spatially distributed within the brain, to capture registration error in many different regions. However, most suitable fiducial sites ended up being in the midaxial area of the brain, due to plentiful, easily identifiable anatomy being located there. Key sites were therefore chosen in extreme anterior, posterior, inferior, and superior locations to round out the placement of landmarks.
The standardized landmark coordinates shown in On-line Table 2 were obtained by registering the T2 volume to the International Consortium for Brain Mapping 152 Nonlinear Symmetric 2009b template,18 thereby generating coordinates in the right-anterior-superior convention with the anterior commissure as the origin. This template volume was only used for determining these coordinates and was not part of the actual registration experiments.
Registrations
Each patient's T2 image volume served as the fixed image, and the FLAIR, SWAN, and T1C images served as the moving image for registration procedures.
Landmark registration was performed as a criterion standard reference. Rigid (6 df) and affine (12 df) transformations with the fiducial LM sites as input were performed by using convert3D (c3d).19 These registrations disregarded all imaging content and focused only on minimizing the gap between corresponding landmarks, thereby creating a lower bound for target-to-registration error (TRE), defined as the Euclidean distance between 2 points in space.
The Volume Viewer software package (Version 11.3 Ext. 14; GE Healthcare) available on the Advantage Workstation Server (Version 2; GE Healthcare) was used for its Integrated Registration module with its specialized Neuro Registration mode. Registrations for GE were performed on a stand-alone server dedicated to this software.
The open-source Advanced Normalization Tools software package (ANTs; http://stnava.github.io/ANTs/20) was used to perform multiple registrations for each of the FLAIR-T2, SWAN-T2, and T1C-T2 image pairs, by using both different similarity measures (cross-correlation [CC] versus mutual information [MI]) and different dfs for image movement (rigid versus affine). All registrations were performed on a Linux workstation (Xeon X5675 CPU @ 3.07GHz with 24 cores, 96 GB RAM; Intel, Santa Clara, California).
Analysis
Euclidean TRE values between fixed and moving images were calculated at baseline (preregistration) and for 7 different registration experiments (Table 1). To create independent TRE measurements for analysis, we averaged together multiple TRE values within each patient by sequence. For location-dependent analyses, TRE values were averaged across patients on the basis of coordinate locations.
Registration experiment inputs, parameters, and outputs
Baseline TRE values were analyzed on the basis of the time of image acquisition and location in space. Postregistration TRE values were also analyzed, with Shapiro-Wilk test results used to determine the appropriate ANOVA test for comparing means of groups for main effects (On-line Fig 3). When we compared TRE values of 8 different groups for a single sequence, if all groups passed the Shapiro-Wilk test, the repeated measures ANOVA was used, with post hoc testing with the Tukey test to adjust P values for multiple comparisons (α = .05). Otherwise, the Friedman nonparametric ANOVA was used, with post hoc testing by using the Dunn test (α = .05). Pair-wise comparisons were also performed between the best-performing algorithm for each sequence and its runners-up (On-line Fig 4), with the paired t test used if results for both groups passed the Shapiro-Wilk test. Otherwise, the Wilcoxon signed-rank test was used. All statistical testing was performed by GraphPad Prism software (Version 6.07, 2015; GraphPad Software, San Diego, California) with P < .05 denoting significance.
The Euclidean effectiveness ratio (EER, On-line Fig 5) represents the fraction of Euclidean error remaining after registration, defined as 1 TRE gap (between the results of an algorithm of interest and the affine LM algorithm [LM12]) divided by another TRE gap (between baseline and LM12 results). The EER scale will always be between 0 and 1 with values at the boundary interpreted accordingly. The statistical effectiveness ratio (SER, On-line Fig 5) is similar to the EER, but accounts for statistical noise. It is defined as the ratio of 1 Cohen d (between an algorithm of interest [AOI] and the LM12 results) divided by another Cohen d (between baseline and LM12 results). The Cohen effect size d was calculated between algorithms by using
 where the 2 algorithms being compared are A and B, the pooled SD, sA − B =
  , sA is the SD of group A, and nA is the number of samples in group A.
Results
Images
Table 2 contains demographic information about patients from this clinical trial. The “high movers” and “low movers” subgroups are defined in “Baseline TRE as a Function of Time.”
Age, race, and frontal lobe tumor involvement of patient groups
Landmarks
Of the 1200 fiducial LM sites planned, 1175 were realized. Because SWAN volumes in 17 of 20 patients had limited superior/inferior head coverage, LM sites 14 and/or 15 had to be omitted, depending on the patient, for a deficit of 25 SWAN landmark sites (n = 10 omitted for LM site 14, and n = 15 omitted for LM site 15). The resulting 1175 points translated to 875 LM pairs (300 for FLAIR-T2, 275 for SWAN-T2, and 300 for T1C-T2). In 3 of 20 patients, the SWAN imaging volume was located too superiorly to include the normal locations of LM sites 1–4 (the next most inferior landmarks, after LM site 14). In these cases, alternative fiducial sites were chosen, superior enough to still allow a valid site pairing with the T2 volume.
Registrations and Analysis
Baseline TRE as a Function of Time.
Baseline TRE increased as a function of time in the magnet for the entire population (Fig 2, left), with a best-fit line significantly different from the zero slope (F = 17.80, P < .0001, R2 = 0.2348). Using z scores based on T1C TRE values, we dichotomized patients into high movers (z > 0.35) and low movers (z < 0.35). The line for the high movers was significantly different from the zero slope (Fig 2, right; F = 33.64, P < .0001), but the line for the low movers was not (F = 0.004419, P = .9474).

Plot of baseline TRE versus time, sorted by image sequence (left, FLAIR: blue diamonds, SWAN: red squares, T1C: green triangles) and by patient movement (right, high movers: blue diamonds; low movers: red squares) (n = 15 for FLAIR and T1C, n = 12–15 for SWAN per data point).
Baseline TRE as a Function of Location.
We analyzed the high movers group, and found that their predominant motion appeared to be rotatory in nature, around an axis passing through the dens (On-line Fig 6). TRE values were therefore plotted against their distance from a point on this fulcrum axis (Fig 3). For the T1C sequence (Fig 3, lower row), the baseline TRE increased with the distance from this point, with a best-fit line significantly different from the zero slope (F = 42.12, P = .0074). However, the best-fit lines for FLAIR (F = 8.311, P = .0634) and SWAN (F = 1.331, P = .3322) were not significantly different from the zero slope, suggesting a threshold effect for movement as time increases.

Plots of TRE versus distance from the fulcrum point for FLAIR (upper row), SWAN (middle row), and T1C (lower row). All TRE values shown are from the high movers subpopulation (n = 27 for FLAIR and T1C; n = 25–26 for SWAN per data point).
TRE and Euclidean Effectiveness Ratio after Registration.
For FLAIR TRE and EER values (Fig 4 upper row and On-line Table 3), the rankings were the following: rigid MI < rigid CC < affine CC < GE < affine MI. Pair-wise TRE comparisons between the best algorithm and its runners-up did not reveal significant differences for the rigid MI–rigid CC pair (P = .0552 paired t, effect size d = 0.1492) or the rigid MI–affine CC pair (P = .0532 paired t, effect size d = 0.3620). Significant differences did exist for the rigid MI–GE pair (P = .0323 paired t, effect size d = 0.4627).
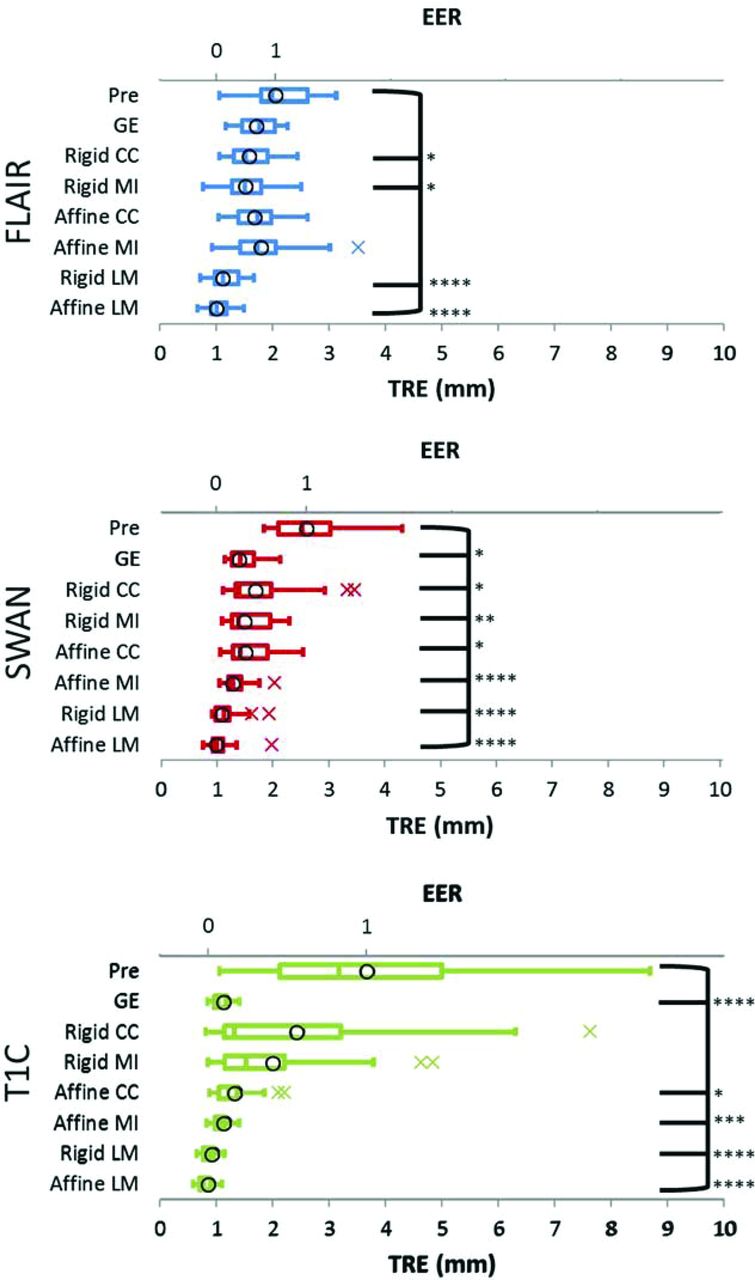
TRE and EER values (boxplots and circles, respectively; n = 20) for FLAIR (upper row), SWAN (middle row), and T1C (lower row). TRE differences among the 8 groups are statistically significant for FLAIR (repeated measures ANOVA, F = 19.22, P < .0001), SWAN (Friedman ANOVA, F = 103.5, P < .0001), and T1C (Friedman ANOVA, F = 108.5, P < .0001). Asterisks indicate statistically significant TRE differences from baseline. Asterisk indicates P ≤ .05; 2 asterisks, P ≤ .01; 3 asterisks, P ≤ .001; 4 asterisks, P ≤ .0001; FLAIR: Dunnett test; SWAN, T1C: Dunn test).
For SWAN TRE and EER values (Fig 4 middle row and On-line Table 3), the rankings were the following: affine MI < GE < rigid MI < affine CC < rigid CC. Pair-wise TRE comparisons between the best algorithm and its runners-up revealed significant differences for the affine MI–GE pair (P = .0136, Wilcoxon signed-rank test, effect size d = 0.4969) and the affine MI–rigid MI pair (P = .0121, Wilcoxon signed-rank test, effect size d = 0.6454).
For T1C, TRE, and EER values (Fig 4 lower row and On-line Table 3), the rankings were: GE < affine MI < affine CC < rigid MI < rigid CC. Pair-wise TRE comparisons between the best algorithm and its runners-up did not reveal significant differences for the GE–affine MI pair (P = .6640 paired t, effect size d = 0.0669), but they did reveal significant differences for the GE–affine CC pair (P = .0042 Wilcoxon signed-rank test, effect size d = 0.7720).
The SER rankings were the same as rankings based on TRE and EER for the FLAIR and SWAN sequences. For the T1C sequence, the SER ranking was different, selecting rigid CC as the top algorithm (On-line Table 4).
TRE Values before Registration: FLAIR versus SWAN versus T1C.
Before registration, the mean TRE rankings were as follows: FLAIR < SWAN < T1C. Differences among these 3 groups were statistically significant (Friedman ANOVA, F = 9.300, P = .0096), and post hoc testing showed significant differences for the FLAIR-T1C pair, but not for the FLAIR-SWAN or SWAN-T1C pairs (P = .0133, P = .0531, and P > .9999, respectively; Dunn test).
TRE Values after the Affine LM Registration: FLAIR versus SWAN versus T1C.
Affine LM results, representing the criterion standard minimum possible TRE, consistently had the smallest TRE values for each sequence, with rankings as follows: T1C < FLAIR < SWAN. Differences among the 3 sequences were significant (Friedman ANOVA, F = 12.40, P = .0020), with post hoc testing showing significant differences for the SWAN-T1C pair, but not the FLAIR-SWAN or FLAIR-T1C pairs (P = .0015, P = .6177, and P = .0806, respectively; Dunn test).
TRE Differences by Landmark: Preregistration and Affine LM Registration.
Baseline TRE differences between landmarks (On-line Fig 7, left) were significant (Friedman ANOVA, F = 30.23, P = .0071), but post hoc testing with the Dunn test revealed significant differences only for the LM site 5 to LM site 13 pair (P = .0191), suggesting mainly random, not systematic, differences among landmark locations. Differences among landmarks after the affine LM registration (On-line Fig 7, right) were not significant (Friedman ANOVA, F = 23.13, P = .0581).
Discussion
The main findings from this study were the following:
The FLAIR, SWAN, and T1C image volumes, on average, all had lower TRE values after registrations that corrected for spatial errors due to patient motion. For open-source methods, MI outperformed CC registrations and affine usually outperformed rigid registrations.
Spatial error values after registration were comparable with or better than values found in the literature.
The unregistered spatial error increased as a function of time in the magnet, and a subpopulation of patients, most with frontal lobe tumor involvement, was responsible for most of the time-dependence of the spatial error.
Better correction was possible between sequences with similar planes of acquisition. If images are acquired in different planes, out-of-plane distortion corrections should be applied.
The best algorithms with the EER metric were the same as the best algorithms by TRE values.
The FLAIR, SWAN, and T1C image volumes, on average, all had lower TRE values after registrations that corrected for spatial errors due to patient motion, a finding that is compatible with conventional wisdom regarding spatially aligning images before analysis.21,22 For open-source methods, MI generally outperformed CC registrations, given the same df and image sequence; this outcome agrees with existing literature.23 Affine usually outperformed rigid transformations, given the same similarity measure and image sequence; this finding makes sense, given that the latter is a special case of the former.22
The smallest TRE values for FLAIR (1.55 mm), SWAN (1.34 mm), and T1C (1.06 mm) were comparable with error values from a commercial vendor that performed rigid, whole-volume registrations on brain MR images (1.6 mm7). They were also comparable with or better than average nonlinear registration errors for other body parts and imaging modalities, including CT-CT lung (1.0 mm,24 2.05 mm25), CT-CT liver (1.8 mm24), MR-CT liver (3.9 mm24), and MR-MR prostate (2.3 mm24).
Spatial error increased as a function of time in the magnet; this finding supports previous observations about image misalignments increasing with time during a scanning session26 and which likely occurs due to patient restlessness expressed by repositioning of the head. The high movers subpopulation, responsible for most of the time-dependent error, was younger than the overall cohort (38.1 versus 45.3 years), and 8 of 9 patients had tumors with involvement in the frontal lobe, an area of the brain associated with motor impulse control.27 Analysis of error versus location suggests that most head movement during the scanning session occurs as rotation about a fulcrum that is in line with the dens.
Better spatial corrections were possible between sequences with similar planes of acquisition, because differences in native orientations lead to differences in residual, out-of-plane distortions. Specifically, FLAIR had left/right distortions (with the brain pinched along the left/right axis, especially near the superior/inferior edges of the volume), while T2, SWAN, and T1C did not have such distortions (because reverse-pin-cushion-shaped corrections had restored the brain to its proper shape and size, On-line Fig 8). As a result, the smallest TRE value for FLAIR was larger than the smallest TRE values for SWAN and T1C. Rigid also outperformed affine registrations for the FLAIR sequence, because affine transformations attempted to recreate the nonlinear effects of distortion correction and unintentionally worsened FLAIR-T2 matching. Out-of-plane distortion corrections should therefore be applied by MR imaging scanners, whenever available, to counter this problem.
The best algorithms by EER values (FLAIR, rigid MI; SWAN, affine MI; T1C, GE) were the same as the best algorithms by TRE values, which makes sense given that the EER is a normalization of TRE that preserves the relative rankings of different algorithms while facilitating comparisons across different sequences. The SER, however, gave different rankings for T1C and is a less intuitive metric to interpret but attractive from a statistical perspective due to its incorporation of noise.
Both single-voxel landmarks and labeled regions have been used to assess registration accuracy for various purposes, with the best assessment method ultimately dictated by the application area and, to some degree, the resources available for the time-intensive, manual label, and/or landmark dataset curation process to create the criterion standard control. We believe that single-voxel landmarks were an appropriate choice for our study, relative to labeled regions and their derived metrics. First, volume and surface overlap metrics, as used in other literature, are well-known to be biased by the total volume/surface and also ignore misregistrations within the labeled regions themselves because no landmarks exist inside those areas to assess correspondence.6 Also, using volume size as a metric is reasonable in the context of nonlinear registration algorithms that can locally deform the image volume and change the size of labeled anatomic regions, but our affine registrations create minimal regional size changes, making volume size an inappropriate metric and further motivating the use of pinpoint, single-voxel landmarks in a manner that extends prior work.7 Additionally, surface distance, which describes registration success by using the average distance between points on one surface to the closest points on another surface,6 disregards whether homologous points are being compared and highlights a possible lack of spatial precision.
This article targets the radiologic clinic, where patient care involves the affine registration of a single patient's images across modalities and/or techniques to assess pathology. Because of the guaranteed anatomic correspondence across these images, single-voxel landmarks can be successfully used to assess registration performance. Additionally, spatially precise landmarks are preferred over a labeled region overlap measure in this context because the use of a single person's images guarantees that a homologous point can be found. Moreover, if wisely distributed throughout the brain volume, these single-voxel landmarks can give a sense of the regional registration error not obtainable by using labeled regions. However, if the registration goal is to spatially align the images from different patients (as is frequently the case in the grouping of functional MR imaging data), it makes sense to use volume overlap as the metric of success, particularly given anatomic variations among patients.
Multiple limitations existed for this study. The placement of fiducial landmark sites was subject to user error, voxel size limitations, and image deformations caused by patient motion. A neuroanatomic expert therefore evaluated all landmark sites, followed by adjustments, if needed. Fiducial sites were also limited to those locations that could be reliably identified across images with widely different contrast mechanisms, with most sites ending up in the central region of the brain. To help compensate for this limitation, we sought a well-rounded distribution of landmarks in the anatomy that was usable and also placed landmarks at extreme anterior, posterior, superior, and inferior locations. Measurement precision was limited by using voxels (discretized representations of anatomy) to measure spatial error on a continuous scale. All voxel sizes and error values as originally calculated are therefore reported, to allow readers to form their own judgments. Our patient number was low and focused on a treatment-naïve patient population with gliomas. Further studies are needed to investigate biases in the registration accuracy that may be influenced by the major disease phenotypes seen in a general patient population, including brain metastases, stroke, neurodegeneration, postsurgery, and postradiation.
Conclusions
In summary, we developed and evaluated a methodology to quantify the registration accuracy of registration algorithms. The method could be used to test any algorithm, providing easy-to-interpret figures of merit that allowed meaningful comparisons with other algorithms in clinical practice. We advocate the publication of figures of merit such as these for all clinical registration algorithms, to better inform the choices of clinical users and allow the future development of improved algorithms for clinical use.
Footnotes
Disclosures: Adam Chandler—UNRELATED: Employment: GE Healthcare, Comments: I am a salaried GE Healthcare employee. Veera Baladandayuthapani—RELATED:Grant: University of Texas M.D. Anderson Cancer Center Support Grant (CCSG) (P30 CA016672).* *Money paid to the institution.
This work was supported, in part, by the National Cancer Institute (Cancer Center Support Grant CA016672 and Training Grant 5T32CA119930) and by M.D. Anderson internal funding sources (Diagnostic Imaging Clinical Research Committee, Clinical Research Finance Molecular Evaluation and Biopsy Support, Internal Research Grant). J.S.L. acknowledges support from the Baylor College of Medicine Medical Scientist Training Program and the Cullen Trust for Higher Education Physician/Scientist Fellowship Program.
Indicates open access to non-subscribers at www.ajnr.org
REFERENCES
- Received September 1, 2016.
- Accepted after revision December 12, 2016.
- © 2017 by American Journal of Neuroradiology


