
Abstract
BACKGROUND AND PURPOSE: The introduction of combination antiretroviral therapy has failed to reduce the high prevalence of mild forms of HIV-associated neurocognitive disorders. The aim of this study was to test the effect of combined antiretroviral therapy on brain metabolite ratios in chronic HIV infection by using proton chemical shift imaging.
MATERIALS AND METHODS: We performed 2D chemical shift imaging in 91 subjects (31 HIV+ patients with chronic infection on combination antiretroviral therapy, 19 combination antiretroviral therapy–naïve HIV+ subjects with chronic infection, and 41 healthy controls), covering frontal and parietal subcortical white and cingulate gyrus gray matter, analyzing ratios of NAA/Cr and Cho/Cr on long-TE and mIns/Cr on short-TE MR spectroscopy. We correlated neurometabolic parameters with immunologic, clinical, data and combined antiretroviral therapy efficacy scores.
RESULTS: There was a significant decrease in NAA/Cr (P < .05) in HIV-positive patients on and without combined antiretroviral therapy, compared with healthy controls in all locations. There were significant differences in Cho/Cr (P < .05) and mIns/Cr (P < .05) ratios between HIV+ patients on and without therapy, compared with healthy controls, but these differed in distribution. There were no significant differences in brain metabolite ratios between the 2 groups of chronically HIV-infected patients. The CNS penetration efficacy score showed weak positive correlations only with Cho/Cr ratios in some locations.
CONCLUSIONS: The impact of combined antiretroviral therapy on the process of neuronal loss and dysfunction in chronic HIV infection appears to be suboptimal in successful peripheral suppression of viral replication. Spectroscopic imaging might be a useful tool for monitoring the effects of different combined antiretroviral therapy regimens on brain metabolite ratios.
ABBREVIATIONS:
- ACG
- anterior cingulate gyrus
- ANI
- asymptomatic neurocognitive impairment
- cART
- combined antiretroviral therapy
- CPE
- CNS penetration efficacy index
- FDWM
- frontal deep white matter
- FSWM
- frontal subcortical white matter
- HAND
- HIV-associated neurocognitive disorders
- PCG
- posterior cingulate gyrus
- PSWM
- parietal subcortical white matter
Combined antiretroviral therapy (cART) has substantially altered the clinical course and epidemiology of HIV infection during the past decade.1 cART has been revolutionary in the control of peripheral viral replication and has reduced the high prevalence of HIV-associated neurocognitive disorders (HAND). HAND includes a variety of neurologic disorders ranging from asymptomatic neurocognitive impairment (ANI) and mild neurocognitive disorders to HIV-associated dementia.2 Nevertheless, recent studies suggest that in stable, chronic HIV infection, neurologic and cognitive symptoms persist or even progress despite cART introduction.3,4
cART is thought to improve the clinical course of HAND by suppressing peripheral and CNS viral replication and by normalizing the level of CD4+ T-cells.5⇓–7 Although cART has greatly reduced the prevalence of HIV-associated dementia, the prevalence of 2 milder forms remains practically unaltered.8 Current theories on the pathogenesis of HAND suggest that early HIV invasion of the brain initiates a cascade of inflammation and neuronal injury, through toxic viral factors and/or activation of the host immune system, which even amplifies neuronal damage. Also, it is hypothesized that the process of neurodegeneration and inflammation can be attenuated to a degree after initiation of cART.7,9
Proton MR spectroscopy is a useful tool in the detection of longitudinal subtle cerebral metabolite changes in cognitively impaired HIV+ patients.10 A classic pattern of changes in the chronic HIV infection pattern consists of decreased N-acetylaspartate (NAA, a neuronal density marker), increased choline-containing metabolites (Cho, a marker of cell membrane metabolism and inflammation), and increased myo-inositol (mIns, a marker of glial proliferation and inflammation).11⇓–13
The aim of this study was to test the potential benefit of cART in the control of neurodegenerative processes reflected in changes in chronic HIV-positive (HIV+) patients on and without cART. For the purpose of detailed and region-specific analysis, we used 2D chemical shift spectroscopic imaging, targeting subcortical frontal and parietal white matter and cingular gray matter.
Materials and Methods
Subject Selection
The study was conducted on 91 subjects, divided into 3 groups: 31 chronic HIV+ patients receiving cART (28 men and 3 women; mean age, 41.35 ± 9.66 years; range, 25–56 years) and 19 chronically HIV-infected, therapy-naïve subjects (17 men and 2 women; mean age, 36.53 ± 8.15 years; range, 25–52 years). The control group consisted of 41 age-, sex- and education level–matched subjects (37 men and 4 women; mean age, 38.57 ± 6.97 years; range, 27–53 years). Both groups of HIV+ patients were chronically infected (>1 year after transmission). The second group of patients were without cART due to former CD4+ count criteria (11 patients) and the presence of active opportunistic infection that needed to be treated before the introduction of cART (8 patients). However, the current European AIDS Clinical Society guidelines recommend that all HIV+ subjects commence cART independent of CD4+ counts.14 Patients who have been continuously on cART had undetectable plasma viral loads (<40 copies/mL).
The study was approved by the ethics committee of the Faculty of Medicine, University of Novi Sad, and all the subjects signed a fully informed written consent.
Inclusion criteria for HIV+ subjects were the following: the presence of HIV infection verified by polymerase chain reaction testing and conventional MR imaging showing no focal or diffuse white matter lesions. Exclusion criteria included the following: active opportunistic infection, active neurologic illness, active usage of drugs of abuse, hepatitis B or C coinfection, the presence of white matter lesions, and contraindications for MR imaging. No subjects were excluded from the study.
Basic clinical data on the HIV+ subjects were obtained from laboratory testing (current CD4+ counts). Additionally, we collected the data on nadir CD4+ counts for all the HIV+ patients. The duration of infection was self-reported by every HIV+ patient.
Anamnestic data on the use of recreational drugs (cannabinoids, marijuana), psychostimulants (methamphetamine), alcohol, and nicotine smoking were obtained for all participants. Clinical data on CD4+ counts, nadir CD4+ counts, infection duration, and CNS penetration efficacy index (CPE) of cART are shown in the Table.
Demographic, clinical, and lifestyle data on the observed groups of patients
Multivoxel MR Spectroscopy
Conventional MR imaging was performed on a 3T MR imaging scanner (Tim Trio; Siemens, Erlangen, Germany) with a matrix head coil. The imaging protocol consisted of sagittal, T1-weighted, spin-echo (TR/TE, 440/3.8 ms; section thickness, 5 mm; duration time, 2 minutes); axial, T2-weighted, turbo spin-echo (TR/TE, 5150/105 ms; section thickness, 5 mm; duration time, 2 minutes 57 seconds); axial fluid-attenuated inversion recovery (TR/TE, 8000/101 ms; section thickness, 5 mm; duration time, 3 minutes 30 seconds); diffusion-weighted imaging (TR/TE, 4100/91 ms; section thickness, 5 mm; duration time, 2 minutes 7 seconds); coronal, T2-weighted TSE (TR/TE, 7150/111 ms; section thickness, 5 mm; duration time, 2 minutes 17 seconds); and 3D T1-weighted multiplanar reconstruction sequences (TR/TE, 1530/2.97 ms; section thickness, 1 mm; duration time, 5 minutes 12 seconds).
We performed 2D chemical shift imaging for each participant, placing the voxel network in the supraventricular white and gray matter of the frontal and parietal lobes. Imaging datasets were acquired with point-resolved spectroscopy by using long (TR/TE, 1700/135 ms) and short (TR/TE, 1700/30 ms) TEs. Chemical shift imaging slab size features were the following: FOV, 160 × 160 × 10 mm; VOI, 80 × 80 × 10 mm; thickness, 10 mm. Chemical shift imaging slab was positioned parallel to the axial images. There were 16 phase-encoding steps (scan resolution) in all directions (right-left, anteroposterior, foot-head), resulting in a VOI of 10 × 10 × 10 mm and a scan time of 8 minutes 17 seconds (we applied a weighted phase-encoding scheme). Six saturation regions were manually positioned along the margin of the VOI. The automatic, volume-selective shimming method was used to optimize homogeneity of the magnetic field. The ROI was positioned identically in every subject to achieve the reproducibility (placement was performed by a single experienced radiologist), while analyzed voxel positions were chosen manually.
The spectra were imported to a Leonardo workstation (Siemens), where dedicated manufacturer software for spectroscopy was applied for baseline corrections, peak identification, and calculation of the ratios throughout the voxels.
Data Analysis
We analyzed spectra obtained on long- and short-TE MR spectroscopy from 12 different voxels in the brain: 1) the frontal subcortical white matter (FSWM) of the right hemisphere, 2) the gray matter of the ventral anterior cingulate gyrus (ACG) of the right hemisphere, 3) the gray matter of the ventral ACG of the left hemisphere, 4) the FSWM of the left hemisphere, 5) the frontal deep white matter (FDWM) of the right hemisphere, 6) the dorsal ACG of the right hemisphere, 7) the dorsal ACG of the left hemisphere, 8) the FDWM of the left hemisphere, 9) the parietal subcortical white matter (PSWM) of the right hemisphere, 10) the gray matter of the posterior cingulate gyrus (PCG) of the right hemisphere, 11) the PCG gray matter of the left hemisphere, and 12) the PSWM of the left hemisphere (Fig 1). We analyzed >6500 spectra.

Multivoxel MR spectroscopy voxel network with labeled observed locations: 1) FSWM on the right, 2) ventral ACG on the right, 3) ventral ACG on the left, 4) FSWM on the left, 5) FDWM on the right, 6) dorsal ACG on the right, 7) dorsal ACG on the left, 8) FDWM on the left, 9) PSWM on the right, 10) PCG on the right, 11) PCG on the left, and 12) PSWM on the left).
Characteristic signals included in the analysis were NAA at 2.02 ppm, Cho at 3.2 ppm, and mIns at 3.5 ppm. Ratios of NAA/Cr, Cho/Cr, and mIns/Cr were calculated.
Statistical Analysis
Statistical calculations were performed by using SPSS software (Version 21.0; IBM, Armonk, New York). Because all variables followed normal distribution, we determined mean values, SD, and range. Intergroup differences (HIV+ subjects on cART, cART-naive HIV+ subjects, and healthy controls) in acquired metabolite ratios were evaluated by using analysis of variance with the post hoc Tukey honest significant difference test to determine the differences among the groups. We used t tests to analyze the differences in current CD4+ counts, infection duration, and nadir CD4+ counts between HIV+ subjects on and without therapy. Correlations between MR spectroscopy ratios and CPE, as well as with current CD4+ counts, were performed by using the Pearson linear correlation. Statistical significance was set at P < .05. Because all subjects in our study were scanned with a single scanner, there were no potential scanner-dependent differences.
Results
Subject Features
The age of subjects did not differ significantly among groups (P = .098). Considering level of education expressed in years, no significant difference among the subgroups was observed (P = .22). HIV+ subjects had been receiving antiretroviral therapy for a mean of 5.1 years (range, 1–16 years), with a mean CPE index of 8.26 ± 0.89. The mean self-reported duration of infection for this group of patients was 6.44 years (range, 1–16 years). HIV+ therapy-naïve subjects were all chronically infected (>1 year after transmission), with a mean self-reported duration of infection of 6.26 years (range, 1–15 years). The 2 groups of HIV+ subjects were similar with respect to infection duration (P = .89). In addition, the groups did not differ significantly regarding the nadir CD4+ counts either (P = .48). The current CD4+ count for the treated group was 620.28 ± 254.36 cells/μL; and for the therapy-naïve group, 205.53 ± 192.91 cells/μL (P < .001). We divided HIV+ patients in 3 groups according to current CD4+ counts: <200 cells/mL, 201–400 cells/mL, and >401 cells/mL. Nicotine smoking was self-reported by 11 (39.28%) HIV+ subjects on cART, 8 HIV+ patients without cART (42.11%), and 17 (41.46%) healthy controls. There were no significant correlations of nicotine use or any metabolite ratios in any of the observed locations. Three HIV+ subjects reported occasional use of marijuana, while no subjects reported active alcohol or drug abuse (no history of drug or alcohol abuse was obtained either). Demographic and clinical characteristics of the subjects are shown in the Table.
Metabolite Ratios
NAA/Cr Ratios.
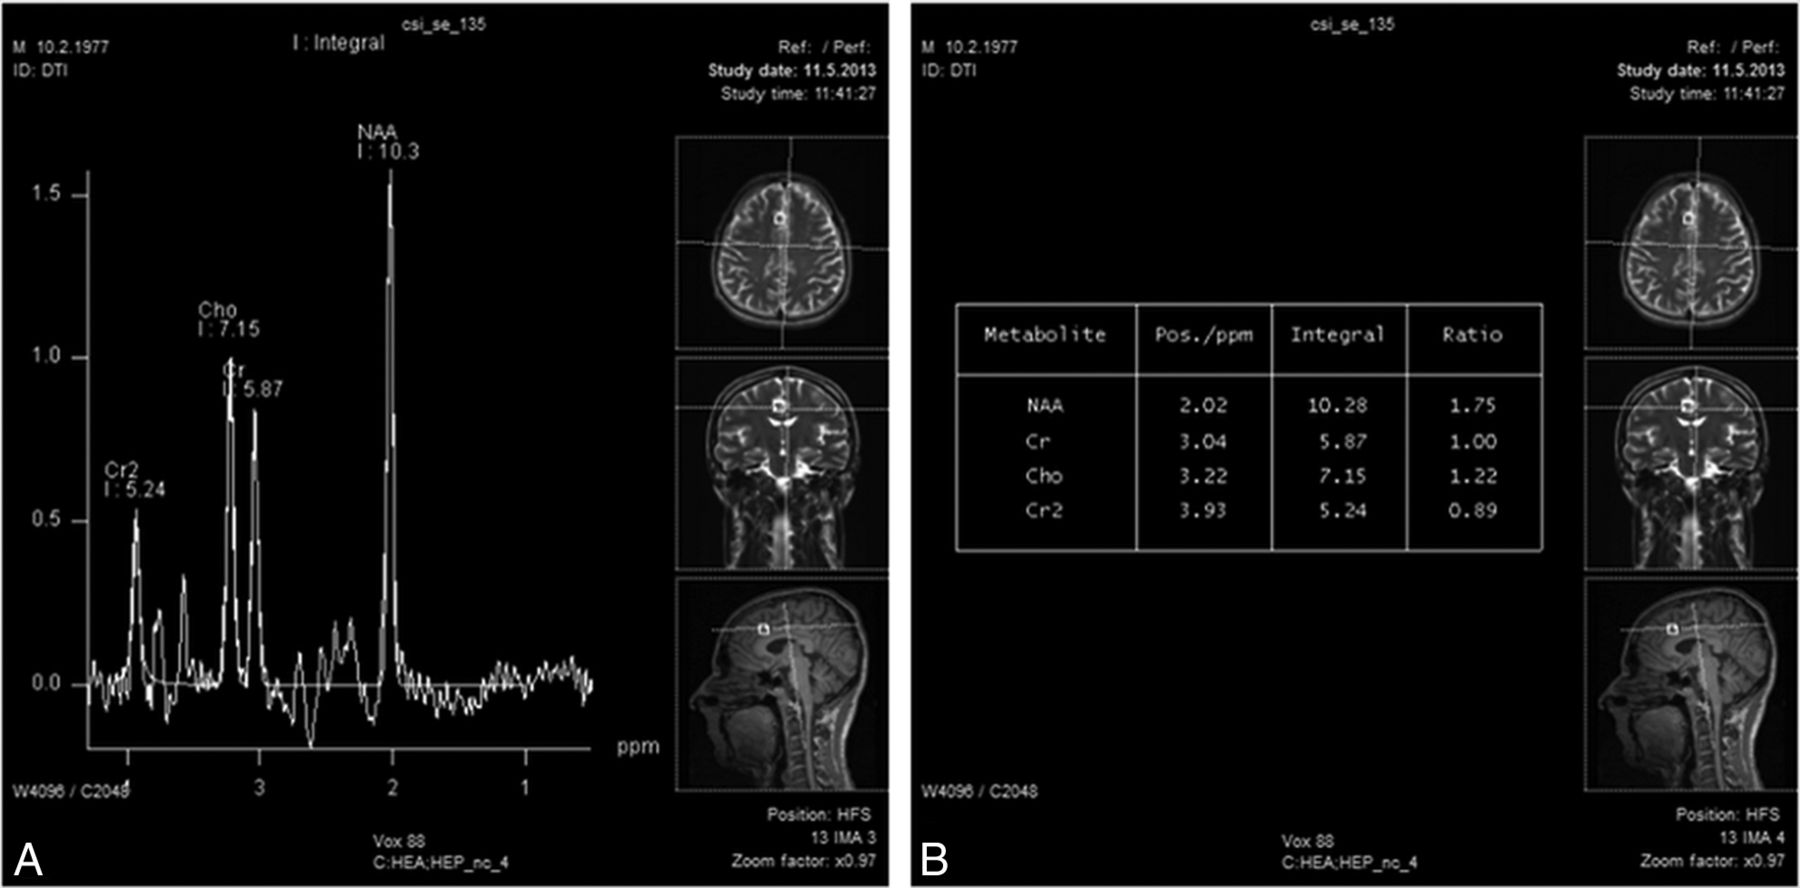
We observed significantly lower NAA/Cr ratios in HIV+ patients compared with healthy subjects in all observed locations (On-line Table 1). Separate analyses among groups revealed that chronically infected HIV+ patients both on and without cART showed significantly lower NAA/Cr levels in all observed locations compared with controls. However, there were no differences between HIV+ patients on and without therapy in NAA/Cr ratios (On-line Table 2). Figures 2 and 3 show long-TE spectra in HIV+ patients on cART (Fig 2) and therapy-naïve HIV+ patients (Fig 3), with a significant reduction in NAA/Cr levels.

Long-TE multivoxel MR spectroscopy (A) (in a patient on cART) in the gray matter of the ventral ACG on the right shows a significant reduction in NAA/Cr (1.75) (B).
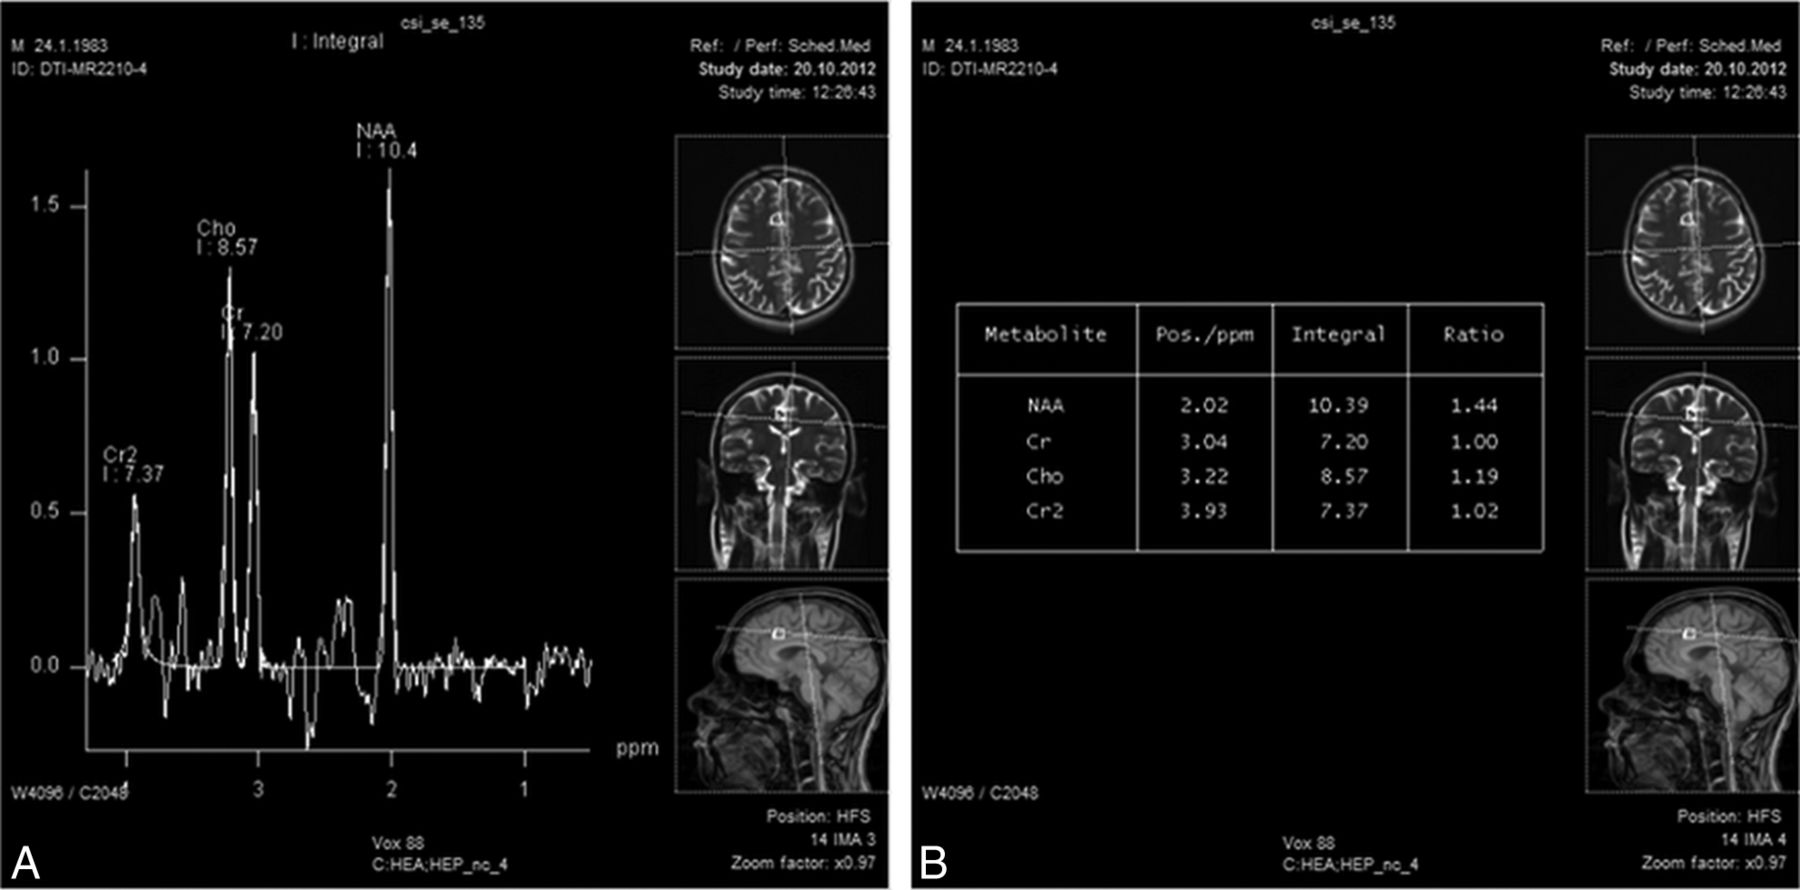
Long-TE multivoxel MR spectroscopy (A) (in a therapy-naïve patient) in the gray matter of the ventral ACG on the left shows a significant reduction in NAA/Cr (1.44) and a slight increase in Cho/Cr (1.19) (B).
There were no significant correlations between NAA/Cr levels and CPE scores in any of the observed locations (On-line Table 1). We observed positive correlations with current CD4+ scores in the FDWM on the right (P = .016) and in the PSWM on the left (P = .004) (On-line Table 1).
Cho/Cr Ratios.
We observed a significant decrease in the Cho/Cr ratios in HIV+ patients compared with controls in several locations, namely the FSWM on the left, the dorsal ACG on the right, the PCG on both sides, and the PSWM on the left (On-line Table 3). On post hoc separate analysis, we noted a significant decrease in Cho/Cr ratios in HIV+ patients with chronic infection without cART in 5 locations (the FSWM on the left [P < .001], the dorsal ACG on the right [P = .03], the PCG on the right [P < .001], the PCG on the left [P = .02], and the PSWM on the left [P = .02], On-line Table 2). Levels of Cho/Cr were significantly decreased in HIV+ patients with chronic infection on cART in the FSWM on the left (P = .03) and the PSWM on the left (P = .02), both compared with controls. Again, no significant difference was observed in Cho/Cr levels between the 2 groups of chronically infected HIV+ patients (On-line Table 2).
Among the 3 observed metabolite ratios, the Cho/Cr ratio was the only one that showed some significant correlations with the CPE score. Cho/Cr ratios showed positive correlations with the CPE score in the ventral ACG on the right (P = .005), the dorsal ACG on the right (P = .001), and in the FDWM of the left lobe (P = .03, On-line Table 3). A weak negative correlation with current CD4+ counts was observed in the ventral ACG on the right (P = .04) (On-line Table 3).
mIns/Cr Ratios.
There was a significant increase in mIns/Cr ratios in HIV+ patients compared with healthy controls in the ventral ACG on right side, the FSWM on the left, the dorsal ACG on the left, the FDWM on the left, and the PSWM on the right (On-line Table 4). Post hoc analysis revealed an increase in mIns/Cr ratios in HIV+ therapy-naïve patients compared with controls in 3 locations, 2 in the ACG (right ventral, P = .002, and left dorsal, P < .001) and 1 in the FDWM on the left (P = .001). Finally, we observed an increase in mIns/Cr levels in HIV+ patients on cART compared with controls in only 1 location (the dorsal ACG on the left, P = .01). No significant difference was observed between chronically infected HIV+ patients on and without cART (On-line Table 4). Short-TE MR spectroscopy in a patient on cART and a therapy-naïve patient are shown in Figs 4 and 5.

Short-TE multivoxel MR spectroscopy (A) (in an HIV+ patient on cART) in the frontal subcortical white matter on the left shows a reduction in NAA/Cr (1.96) and an increase in mIns/Cr (0.51) (B).

Short-TE multivoxel MR spectroscopy (A) in an HIV+ therapy-naïve patient shows a reduction in NAA/Cr (1.98) and an increase in mIns/Cr (0.82) and Cho/Cr (1.28) (B).
There were no significant correlations of mIns/Cr ratios with CPE scores in any of the observed locations. Some positive correlations with the current CD4+ count were shown in the dorsal ACG on the left (P = .03, On-line Table 4).
Power calculations showed satisfactory sample sizes for analysis of NAA/Cr (0.839–0.999). However, the results for Cho/Cr and mIns/Cr show a lack of power in certain voxels (the lowest value for Cho/Cr was 0.107; and for mIns/Cr, 0.066). Nevertheless, there were several voxels in which power was >0.8 (the FSWM on the left, the PCG on the right, and the PSWM on the left for Cho/Cr and the ventral ACG on the right, the dorsal ACG on the left, and the FDWM on the left).
Discussion
Several recent studies have shown evidence that timely initiation of cART reduces the neuroinflammatory process in acute HIV infection, reflected in normalization of increased levels of mIns/Cr and Cho/Cr soon after therapy introduction.11,15,16 However, levels of NAA/Cr are not significantly reduced immediately after seroconversion, so no relevant change in this neuronal marker was observed.15
In this study, we confirmed a significant decrease in the levels of NAA/Cr throughout the observed volume of the brain (comprising gray matter of the cingulate gyrus, subcortical frontal and parietal white matter, and frontal deep white matter on both sides) in chronically infected HIV+ subjects (with similar mean durations of known HIV infection), irrespective of cART administration. This result leads to 2 important conclusions: first, the process of neurodegeneration is diffuse; and second, administration of antiretroviral drugs cannot attenuate the changes in brain metabolite ratios observed in therapy-naïve HIV+ subjects.
Low NAA/Cr levels in chronically infected HIV+ patients are concordant with findings in the most recent MR spectroscopy studies,15,17 resembling the progressive neurodegeneration that is thought to be the framework of HIV-associated neurocognitive disorders.4
The locations of the observed declines in NAA/Cr ratios were in the cingulate gyrus and subcortical frontal and parietal and deep frontal white matter. The posterior cingulate cortex was affected by the process of neuronal injury in both groups of HIV+ subjects. It is a highly connected and metabolically active brain region, with a suggested (not yet proved) important cognitive role. Recent data suggest that it has a central role in supporting internally directed cognition. However, other evidence suggests that it may play a direct role in regulating the focus of attention. In addition, its interactions with other brain networks may be important for conscious awareness.18 It is functionally connected to the region of dorsal ACG and the prefrontal cortex (regions also affected by neuronal loss and dysfunction, according to our results). The anterior cingulate gyrus is divided into 2 functionally separate parts (ventral and dorsal). The ventral part has been proved to have connections to the emotional limbic system, while the dorsal part (also called the middle cingulate gyrus) has connections to the cognitive prefrontal cortex.19 Some of the main symptoms of mild HAND forms, concerning mood disorders, depression, and anxiety could be due to these specific regions being affected by the extensive process of neurodegeneration.
In this study, we present a decline in Cho/Cr levels in some observed locations in both HIV+ therapy-naïve and HIV+ treated subjects. In HIV+ therapy-naïve subjects, this decrease was observed in the dorsal ACG, PCG, and subcortical white matter of the frontal and parietal lobes on the left. In treated HIV+ patients, the decrease in Cho/Cr levels was found to be significant in only 2 locations: subcortical frontal and parietal white matter (in this group, Cho/Cr levels were more likely to resemble those in healthy controls). Again, no significant differences between these 2 groups were reported. A recent study by Harezlak et al20 presented the decrease in Cho/Cr in aging individuals with HIV infection. These changes have not been explained to date but may, in part, reflect attenuated immune-mediated responses in aging individuals or represent the effects of brain atrophy in chronic HIV-induced neuronal injury.
Finally, mIns/Cr was increased in both untreated and treated HIV+ subjects. mIns/Cr was increased in 3 locations in untreated patients, covering the ventral and dorsal ACG and the FDWM on the left. The dorsal ACG in treated HIV+ patients was the only region in which we observed a decline in these ratios, compared with healthy controls. This finding could indicate that in this region, inflammation and glial proliferation persist for the longest time despite therapy administration. No significant differences were shown between HIV+ patients on and without therapy in mIns/Cr ratios in the observed locations. The reason for this result is not clear because one of the primary roles of cART in the CNS is the restriction of inflammatory processes in the brain (measured by increases of mIns levels). One of the possible reasons for the absent diffuse increase in markers of glial proliferation in our study can be the uneven distribution of glial cells in the brain, not concordant with the locations we observed.21 However, additional explanation is needed in the light of concomitant normal or slightly reduced Cho/Cr levels in the same regions. Progressive brain atrophy could explain the decrease in Cho/Cr and the concurrent absence of an mIns/Cr increase in the observed regions.
There were some more interesting conclusions regarding regional diversity of obtained results. First, in the subcortical white matter in the frontal and parietal lobes, there was a simultaneous drop in NAA/Cr and Cho/Cr levels in HIV+ patients on cART. This could be due to the quantitative loss of neurons and could reflect brain atrophy in subcortical regions. However, as we indicated, there was no intersection between disturbed mIns/Cr and Cho/Cr levels in these patients. This finding could suggest that there are different processes that accompany neuronal injury. One of them is certainly the proliferation of glial cells (indicated by increased mIns/Cr levels), while the other may be the loss of cell aggregation in the volume unit or some other (yet not clearly understood) mechanism. In cART-naïve patients, however, there were no voxels in which a significant decrease in Cho/Cr followed a significant decrease in NAA/Cr. On the contrary, in all locations where mIns/Cr was significantly increased, NAA/Cr levels decreased (with a significance of P < .001, compared with controls). This finding could support a relatively new concept of neurodegeneration in treated HIV+ subjects, with some indications that HAND is a (potentially reversible) metabolic encephalopathy rather than pure subcortical dementia.1
In addition, a recent study by Hidalgo et al22 systematically addressed the question of the relationship between HIV infection and some personal habits, such as nicotine smoking, abuse or use of alcohol and some recreational drugs (cannabis, marijuana), and psychostimulants. All of these substances are claimed to have a certain, most often synergistic, effect on the neurodegenerative process and neurocognitive impairment in HIV-infected individuals, though through different mechanisms and pathways.22 There are some controversial findings regarding the effect of tobacco smoke extract on neurons in HIV. On the one hand, there are some data on neurotoxicity, expressed as depletion of memory formation and synaptic plasticity, while on the other hand, some beneficial outcomes were shown in HIV-infected individuals with neurologic deficits.23 Nicotine use was the most widespread habit in our study population, equally distributed in healthy and HIV+ subjects. However, we failed to find correlations of MR spectroscopy parameters with nicotine smoking in our study population. The use of cannabinoids has a negative effect on the CD4+ count and on the memory processes.24 The consumption of marijuana has some controversial effects on cognition. Cristiani et al25 have shown some synergistic effects of marijuana and HIV infection in individuals with advanced HIV disease, while the effects are minimal in those at the early stages of HIV. In our study, only a few subjects (3 HIV-infected subjects, 2 on cART, and 1 cART-naïve subject) reported recreational use of marijuana. However, this number was not significant enough for any valid statistical analysis of the impact of this substance on brain metabolite ratios. The abuse of alcohol is connected with oxidative stress, impairment of the blood-brain barrier, and glutamate-associated neurotoxicity.22 However, the effects of alcohol are classically more pronounced in the peripheral nervous system (painful peripheral neuropathy). Nevertheless, Green et al26 have shown a synergistic effect of HIV infection and alcohol on the CNS, observed as a negative effect on reaction time, auditory processing, and verbal reasoning. No subjects with a history of active alcohol or opioid drug abuse were enrolled in our study.
Finally, HIV+ patients on and without cART were similar in aspects of duration of known HIV infection and nadir CD4+ count. A lower nadir CD4+ count reflects a longer duration of HIV infection and a longer exposure of neuronal cells to the negative effects of HIV.20,27 The expected consequence of cART administration is a decline of inflammation and glial proliferation parameters (mIns/Cr first) and some beneficial effects on NAA/Cr ratios (optimally stagnation). However, we were not able to demonstrate a significant positive impact of cART on the neurobiochemical profile in the observed regions. One possible explanation might be the lack of power observed in several voxels for mIns/Cr and Cho/Cr, meaning that our sample was inadequate to show potential differences. Nevertheless, the locations where we observed significant differences had a satisfactory power sample (>0.8). Additionally, there is a scant possibility that the group of untreated patients had lower inflammatory responses (the presence of so-called slow responders). The CNS HIV Antiretroviral Therapy Effects Research (CHARTER) Group was also not able to demonstrate positive effects of cART in CNS in their large observational study, while they clearly stated undoubtedly positive effects on immune function and peripheral viral load reduction.28 A positive effect on the immune system was also confirmed in our study, with the current CD4+ count being significantly higher in the treated group (P < .001) than in drug-naïve patients. In other words, even though (peripheral) viral replication is adequately suppressed with cART, progressive changes in the neurobiochemical profile are not. However, nonreplicating-but-viable viruses might still affect the function of neuronal cells through release of their toxins or by stimulating the constant activity of the host immune system.
The efficacy of cART in the CNS compartment is classically evaluated with the CPE score.29 In our study, only weak positive correlations of the Cho/Cr ratio with the CPE score were observed (in the cingulate gyrus and deep frontal white matter). Presumably, the decline of Cho/Cr reflected the process of atrophy, so this correlation could be attributed to a positive effect of cART on preventing chronic CNS injury in HIV infection (because most of our subjects had high CPE scores). This finding is concordant with recent studies showing that CPE fails to predict neuronal damage measured by MR spectroscopy (the CPE score shows the lowest predictive value of all the observed parameters).19
Finally, we tested the impact of current CD4+ counts (reflecting the immune status at the moment of scanning) on metabolite ratios. In general, correlations of brain metabolite ratios with current CD4+ counts were poor. We observed positive correlations of NAA/Cr with current CD4+ counts, significant only in the white matter (deep frontal and subcortical parietal). This observation supports the theory that immune restitution has a positive effect on NAA/Cr levels as the means of preventing further neuronal injury.15,16 Cho/Cr showed poor (negative) correlations with CD4+ counts, trending toward significance only in the ventral ACG. mIns/Cr showed a positive correlation with the CD4+ count only in the dorsal ACG, probably reflecting immune activation persistent in this region.
Conclusions
According to the results of proton chemical shift imaging covering some locations in subcortical and deep white matter of frontal and parietal lobes, as well as some locations in the cingulate gray matter, the positive impact of cART on the process of neuronal loss and dysfunction in chronic HIV infection is suboptimal. Our findings show that regional differences in glial proliferation and neurometabolic profile induced by HIV viral and reactive host factors exist and persist in era of cART. This finding raises the question of change in the neuronal damage mechanism in the light of treated chronic HIV infection (metabolic encephalopathy as the pathologic substrate). MR spectroscopy might be a useful tool in monitoring the effect of different cART regimens in affecting the alternative viral pathways of neuronal injury (with successful peripheral viral suppression). Finally, the effect of some lifestyle habits (consumption of alcohol, marijuana, nicotine, and opioid drugs) on neuronal dysfunction in chronic HIV infection is yet to be defined.
References
- Received October 3, 2016.
- Accepted after revision January 27, 2017.
- © 2017 by American Journal of Neuroradiology


Jump to section
Related Articles
Cited By...
- No citing articles found.