Advertisement

Main menu

  • Home
  • Content
    • Current Issue
    • Accepted Manuscripts
    • Article Preview
    • Past Issue Archive
    • Video Articles
    • AJNR Case Collection
    • Case of the Week Archive
    • Case of the Month Archive
    • Classic Case Archive
  • Special Collections
    • AJNR Awards
    • ASNR Foundation Special Collection
    • Most Impactful AJNR Articles
    • Photon-Counting CT
    • Spinal CSF Leak Articles (Jan 2020-June 2024)
  • Multimedia
    • AJNR Podcasts
    • AJNR SCANtastic
    • Trainee Corner
    • MRI Safety Corner
    • Imaging Protocols
  • For Authors
    • Submit a Manuscript
    • Submit a Video Article
    • Submit an eLetter to the Editor/Response
    • Manuscript Submission Guidelines
    • Statistical Tips
    • Fast Publishing of Accepted Manuscripts
    • Graphical Abstract Preparation
    • Imaging Protocol Submission
    • Author Policies
  • About Us
    • About AJNR
    • Editorial Board
    • Editorial Board Alumni
  • More
    • Become a Reviewer/Academy of Reviewers
    • Subscribers
    • Permissions
    • Alerts
    • Feedback
    • Advertisers
    • ASNR Home

User menu

  • Alerts
  • Log in

Search

  • Advanced search
American Journal of Neuroradiology

American Journal of Neuroradiology

ASHNR American Society of Functional Neuroradiology ASHNR American Society of Pediatric Neuroradiology ASSR
  • Alerts
  • Log in

Advanced Search

  • Home
  • Content
    • Current Issue
    • Accepted Manuscripts
    • Article Preview
    • Past Issue Archive
    • Video Articles
    • AJNR Case Collection
    • Case of the Week Archive
    • Case of the Month Archive
    • Classic Case Archive
  • Special Collections
    • AJNR Awards
    • ASNR Foundation Special Collection
    • Most Impactful AJNR Articles
    • Photon-Counting CT
    • Spinal CSF Leak Articles (Jan 2020-June 2024)
  • Multimedia
    • AJNR Podcasts
    • AJNR SCANtastic
    • Trainee Corner
    • MRI Safety Corner
    • Imaging Protocols
  • For Authors
    • Submit a Manuscript
    • Submit a Video Article
    • Submit an eLetter to the Editor/Response
    • Manuscript Submission Guidelines
    • Statistical Tips
    • Fast Publishing of Accepted Manuscripts
    • Graphical Abstract Preparation
    • Imaging Protocol Submission
    • Author Policies
  • About Us
    • About AJNR
    • Editorial Board
    • Editorial Board Alumni
  • More
    • Become a Reviewer/Academy of Reviewers
    • Subscribers
    • Permissions
    • Alerts
    • Feedback
    • Advertisers
    • ASNR Home
  • Follow AJNR on Twitter
  • Visit AJNR on Facebook
  • Follow AJNR on Instagram
  • Join AJNR on LinkedIn
  • RSS Feeds

AJNR is seeking candidates for the AJNR Podcast Editor. Read the position description.

Research ArticleADULT BRAIN

Discrimination between Glioma Grades II and III Using Dynamic Susceptibility Perfusion MRI: A Meta-Analysis

Anna F. Delgado and Alberto F. Delgado
American Journal of Neuroradiology July 2017, 38 (7) 1348-1355; DOI: https://doi.org/10.3174/ajnr.A5218
Anna F. Delgado
aFrom the Department of Clinical Neuroscience (Anna F.D.), Karolinska Institute, Stockholm, Sweden
  • Find this author on Google Scholar
  • Find this author on PubMed
  • Search for this author on this site
  • ORCID record for Anna F. Delgado
Alberto F. Delgado
bDepartment of Surgical Sciences (Alberto F.D.), Uppsala University, Uppsala, Sweden.
  • Find this author on Google Scholar
  • Find this author on PubMed
  • Search for this author on this site
  • ORCID record for Alberto F. Delgado
  • Article
  • Figures & Data
  • Supplemental
  • Info & Metrics
  • Responses
  • References
  • PDF
Loading

Abstract

BACKGROUND: DSC perfusion has been evaluated in the discrimination between low-grade and high-grade glioma but the diagnostic potential to discriminate beween glioma grades II and III remains unclear.

PURPOSE: Our aim was to evaluate the diagnostic accuracy of relative maximal CBV from DSC perfusion MR imaging to discriminate glioma grades II and III.

DATA SOURCES: A systematic literature search was performed in PubMed/MEDLINE, Embase, Web of Science, and ClinicalTrials.gov.

STUDY SELECTION: Eligible studies reported on patients evaluated with relative maximal CBV derived from DSC with a confirmed neuropathologic diagnosis of glioma World Health Organization grades II and III. Studies reporting on mean or individual patient data were considered for inclusion.

DATA ANALYSIS: Data were analyzed by using inverse variance with the random-effects model and receiver operating characteristic curves describing optimal cutoffs and areas under the curve. Bivariate diagnostic random-effects meta-analysis was used to calculate diagnostic accuracy.

DATA SYNTHESIS: Twenty-eight studies evaluating 727 individuals were included in the meta-analysis. Individual data were available from 10 studies comprising 190 individuals. The mean difference of relative maximal CBV between glioma grades II and III (n = 727) was 1.76 (95% CI, 1.27–2.24; P < .001). Individual patient data (n = 190) had an area under the curve of 0.77 for discriminating glioma grades II and III at an optimal cutoff of 2.02. When we analyzed astrocytomas separately, the area under the curve increased to 0.86 but decreased to 0.61 when we analyzed oligodendrogliomas.

LIMITATIONS: A substantial heterogeneity was found among included studies.

CONCLUSIONS: Glioma grade III had higher relative maximal CBV compared with glioma grade II. A high diagnostic accuracy was found for all patients and astrocytomas; however, the diagnostic accuracy was substantially reduced when discriminating oligodendroglioma grades II and III.

ABBREVIATIONS:

QUADAS-2
Quality Assessment of Diagnostic Accuracy Studies-2
rCBVmax
relative maximum cerebral blood volume
ROC
receiver operating characteristic
WHO
World Health Organization

Perfusion MR imaging with dynamic susceptibility contrast is a clinical method used to assess brain perfusion in several diseases.1,2 DSC has been studied with regard to perfusion in brain tumors such as gliomas, and maximum relative cerebral blood volume (rCBVmax) has been correlated with World Health Organization (WHO) malignant grade3⇓–5 to a higher extent than contrast enhancement in morphologic MR imaging.6,7 A higher rCBVmax has been associated with high-grade gliomas (WHO grades III and IV) compared with low-grade gliomas (WHO grades I and II).7⇓⇓⇓⇓⇓–13 An optimal cutoff of 1.75 for rCBVmax has been proposed and evaluated in previous studies.7,14⇓–16 However, an optimal cutoff between glioma grades II and III has not been assessed previously, to our knowledge.

The current standard criterion for diagnosing and grading glioma is through neuropathologic evaluation.17 However, not all patients are suitable for surgical resection, and tumor biopsy can lead to a false-negative diagnosis due to an unrepresentative tissue specimen. There is a need for a noninvasive adjunct in discriminating glioma grades at initial diagnosis and at clinical follow-up.

Recently, a meta-analysis studying MR imaging perfusion in low- and high-grade gliomas was published aggregating data on rCBV from DSC imaging, indicating a potential for the clinical use of the method in discrimination of low- and high-grade gliomas.18 However, no meta-analysis regarding the specific differences in rCBVmax from DSC imaging between glioma grades II and III has been performed.

Grade II gliomas represent low-grade tumors with longer patient survival and treatment options different from those in high-grade (III) gliomas, which show shorter patient survival and a more dismal prognosis.17,19 Furthermore, grade III gliomas have a greater propensity to spread outside their macroscopic margins and are thus harder to resect in total with surgery.20 The interest in noninvasive differentiation between glioma grades II and III is attributed to discrepancies in prognosis and treatment options. Noninvasive radiologic evaluation is important in patients not suitable for primary surgery or for longitudinal surveillance in a grade II glioma, with its intrinsic risk of malignant transformation; for treatment follow-up; and as an adjunct to neuropathology.

Several studies analyzing rCBVmax in specific glioma grades have found conflicting results. A number of studies analyzing differences in rCBVmax in glioma grades II and III have failed to show any differences between these malignancy grades.6,21⇓⇓⇓⇓⇓–27 Radiologic analyses of differences between low- and high-grade gliomas depend mainly on the specific charactersistic of a glioma grade IV (glioblastoma). The added value of physiologic perfusion MR imaging such as DSC is therefore in the distinction between gliomas of lower grades than WHO grade IV, as in the discrimination between glioma grades II and III. The aim of this meta-analysis was to evaluate differences in relative maximal CBV from DSC perfusion MR imaging between glioma grades II and III and to assess the diagnostic accuracy of rCBVmax to discriminate glioma grades II and III.

Materials and Methods

This meta-analysis was performed according to the Preferred Reporting Items for Systematic Reviews and Meta-Analyses (PRISMA)28 statement and current recommended methods for meta-analysis of diagnostic accuracy in imaging journals.29

Search Strategy and Information Sources

Relevant articles were searched from the date of inception to October 2016 in PubMed/MEDLINE, Embase, Web of Science, and ClinicalTrials.gov independently, by the 2 authors (Anna F.D., Alberto F.D.).

PubMed/MEDLINE was searched with the following Medical Subject Heading terms: “glioma perfusion,” “MR imaging,” “astrocytoma,” and “oligodendroglioma.” Additional searches were performed with the following terms: “grade,” “grading,” “DSC,” “oligoastrocytoma” (the full search strategy is in On-line Table 1).

Selection Criteria

Study selection was based on the patient, intervention, comparison, and outcome criteria, in which eligible studies analyzed patients with glioma WHO grades II and III. The intervention was defined as measurement of rCBVmax from DSC. The comparison was defined as neuropathologic diagnosis after MR imaging of either glioma grade II or III (astrocytoma, oligoastrocytoma, or oligodendroglioma). Studies reporting on mean or individual patient data for grade II and III gliomas were considered for inclusion. Studies reporting on DSC imaging with no restriction in field strength, postprocessing, or ROI method were included. Only English studies were considered. Both retrospective and prospective studies were eligible. Exclusion criteria were the following: studies reporting on patients posttreatment, pediatric patients (younger than 18 years of age), case studies, reviews, abstracts, technical reports, meta-analyses, duplicate or overlapping cohorts, and longitudinal studies. Studies not classifying gliomas according to WHO were excluded.

Data Extraction

Study characteristics and results were extracted into tables independently by the 2 authors (Anna F.D., Alberto F.D.) with experience in meta-analysis. Data were sought for in the main documents and on-line material.

We extracted the following data: first author, year published, study period, country, perfusion method and MR imaging sequence, MR imaging field strength (1.5T/3T), scanner type (model and company), presaturation of tissue (yes/no), leakage-correction method (yes/no), WHO classification, study design (prospective/retrospective), number of patients with glioma grades II and III respectively, glioma subtypes (astrocytomas, oligoastrocytomas, oligodendrogliomas), ROI method (rCBVmax or histogram parameter), and mean (SD) rCBVmax in glioma grades II and III, respectively, with associated information about the discriminating potential among grades (yes/no) from the individual study.

Available individual patient data on rCBVmax and neuropathologic diagnosis were extracted separately by the 2 authors, initially blinded to each other's data and subsequently checked for consistency. Patients from overlapping study cohorts (same authors, institution, overlapping years of patient recruitment) were considered for inclusion once in the meta-analysis. Any disagreements regarding data extraction were solved through discussion until consensus.

Data Quality Assessment

The risk of bias and quality assessment of included studies were independently assessed by the 2 authors (Anna F.D., Alberto F.D.) through the Quality Assessment of Diagnostic Accuracy Studies-2 (QUADAS-2), evaluating patient selection, analysis of index/reference tests, and the flow/timing of the study.30 Any disagreements were solved through discussion until consensus. Results from QUADAS-2 were evaluated in sensitivity analysis.

Statistical Analysis

Mean Study Data.

Mean and SDs of rCBVmax from DSC imaging for each glioma grade (WHO grades II or III) were used for the meta-analysis of mean differences. In studies reporting summary estimates other than mean and SD, data were recalculated according to the Cochrane handbook31 and Hozo et al.32

Syntheses of results were evaluated with a forest plot of mean difference with 95% CIs of the continuous variable rCBVmax with inverse variance with random effects. The overall effect was calculated with the z score. To assess whether observed differences in results were compatible with chance alone, we calculated the χ2 and its significance level. I2 was calculated to assess any inconsistencies across studies with the estimation of the percentage of the variability in effect estimate due to heterogeneity. The between-study variance in a random-effects meta-analysis was described by τ2.

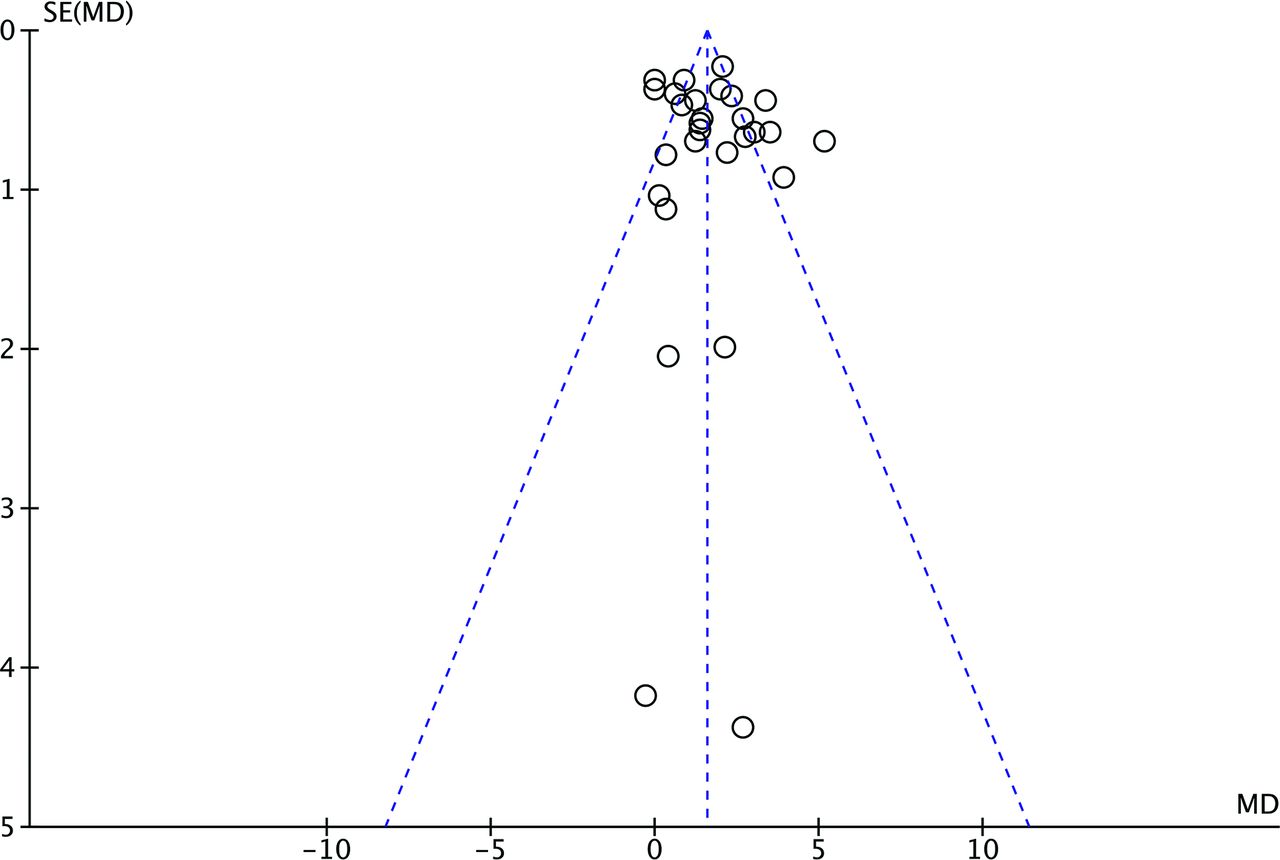
Additional analyses exploring sources of heterogeneity and the risk of bias were prespecified, except exploratory sensitivity analyses based on QUADAS-2. A funnel plot was calculated for the assessment of publication bias as a scatterplot of included studies with the mean difference in rCBVmax plotted on the horizontal axis, and its standard error, on the vertical axis and visually assessed for asymmetry.33

Individual Patient Data.

Individual patient data on rCBVmax and neuropathologic diagnosis were analyzed stratified for grade II and III gliomas and in subgroups of histopathologic subtypes (astrocytomas, oligoastrocytomas, and oligodendrogliomas).

To estimate the diagnostic potential of rCBVmax to discriminate glioma grades II and III, we used data from studies including individual patient data to construct receiver operating characteristic (ROC) curves and calculated the area under the curve. From ROC calculations, the number of patients with true-positive, false-negative, false-positive, and true-negative counts was calculated with maximum accuracy set as the cutoff.

The true-positive, false-negative, false-positive, and true-negative counts were analyzed with the bivariate model of mada34 in R, Version 3.3.1 (R statistical and computing software; http://www.r-project.org).35 Descriptive forest plots of sensitivity and specificity were constructed. After we assumed a binomial model conditional on the true sensitivity and false-positive rates of the primary studies and a bivariate normal model for the logit-transformed pairs of sensitivities and false-positive rates, a linear mixed model implemented in the Reitsma function of mada was used (bivariate diagnostic random-effects meta-analysis with restricted maximum likelihood estimation method).34

Statistical analysis was performed by 1 author (Anna F.D.) with the following statistical programs: RevMan 5.3,36 Statistica 12 (https://2ra5-downloads.phpnuke.org/en/c06229/statistica), and R 3.3.1.34,35 A continuity correction of 0.5 was used when applicable, and P < .05 was considered statistically significant, except in χ2 for which the significance level was set at P < .10.

Results

Literature Search

The searches yielded 1977 hits (1458 in PubMed, 172 in Embase, 283 in Web of Science, 64 in ClinicalTrials.gov) that were screened for inclusion in the meta-analysis. Full-text evaluation of 134 articles was performed. Twenty-eight studies comprising 727 patients were included in the qualitative study assessment and quantitative meta-analysis (On-line Table 2). Individual patient data were available in 10 studies comprising 190 patients. A PRISMA flow chart is presented in Fig 1, and the sample search strategy, in On-line Table 1.

Fig 1.
  • Download figure
  • Open in new tab
  • Download powerpoint
Fig 1.

PRISMA flow chart of included and excluded studies.

Quality Assessment

Quality assessment from QUADAS-2 is presented in On-line Table 3. Included studies showed a general low risk of bias and a low risk of applicability concerns. Biases included lack of information regarding blinding of index and reference tests and lack of information regarding the time between index and reference tests. Applicability concerns were the use of histogram measures as a surrogate for rCBVmax in 3 studies.

Data Analysis

Mean Study Data.

Tabulated perfusion data and study characteristics of included studies (n = 28) evaluating 727 patients are presented in On-line Table 4. The mean (SD) rCBVmax in glioma grade II was 2.14 (1.04); and it was 3.85 (1.18) in grade III (Mann-Whitney U test, P < .001).

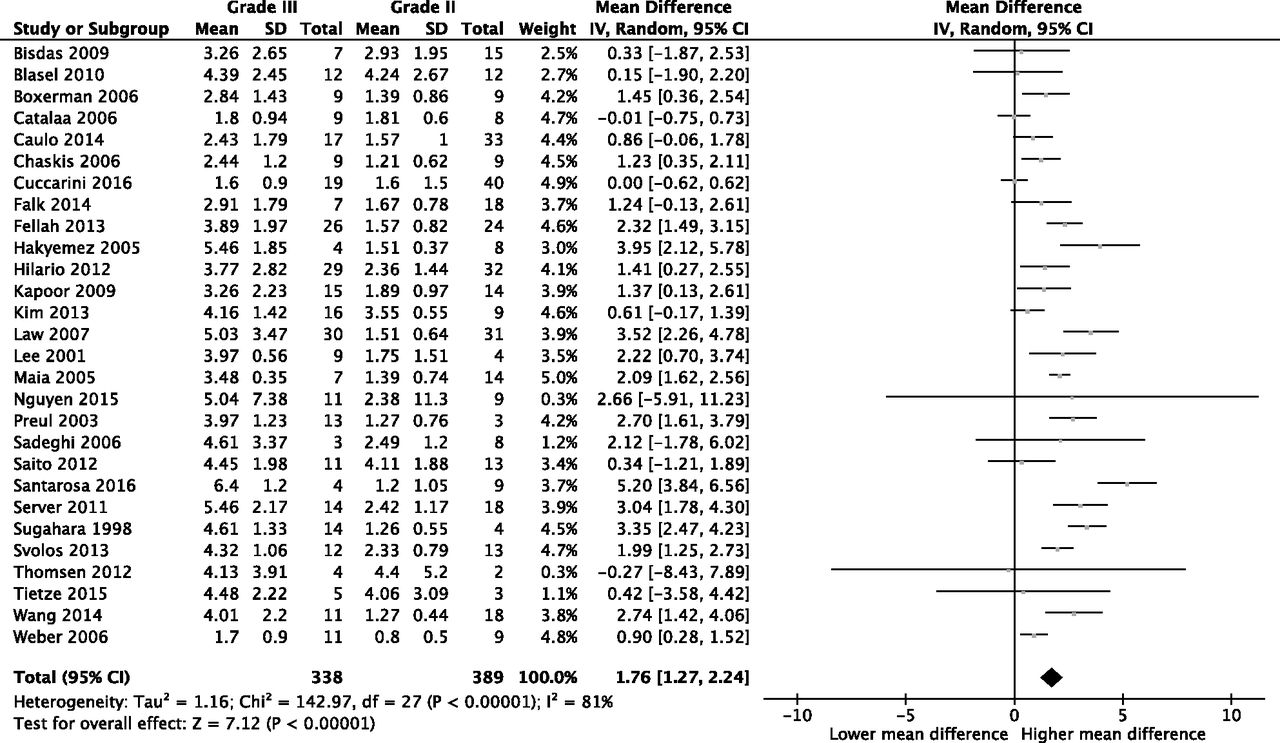
Of the included studies (n = 28), 16 showed statistically significant differences between glioma grades II and III and 12 studies did not (On-line Table 4). Meta-analytic evaluation of included studies (n = 28) showed a mean difference in rCBVmax between glioma grades II and III of 1.76 (95% CI, 1.27–2.24; P < .001); I2 = 81%; Fig 2). Visual assessment of the funnel plot revealed no evidence of the existence of publication bias (Fig 3).

Fig 2.
  • Download figure
  • Open in new tab
  • Download powerpoint
Fig 2.

Forest plot of mean differences between glioma grades II and III with a random-effects model.

Fig 3.
  • Download figure
  • Open in new tab
  • Download powerpoint
Fig 3.

Funnel plot of 28 included studies (n = 727 patients) illustrated by open circles with the effect estimate mean difference (MD) of rCBVmax plotted on the horizontal axis, the standard error (SE) of the MD plotted on the vertical axis, and a triangular 95% confidence region. The study distribution is symmetric without apparent publication bias.

Heterogeneity between study results (χ2), inconsistencies between studies (I2), and between-study variances (τ2) are presented in the Table. Three study characteristics increasing heterogeneity (χ2) across studies were significantly related to studies without published individual patient data (n = 121, χ2 = 18, P = .07) and ROI analysis (n = 25, χ2 = 116, P < .001) and studies with a blinded index test evaluation (n = 14, χ2 = 98, P < .001). Study characteristics increasing inconsistencies across studies (I2) were the following: prospective study design (n = 11, I2 = 89), optimal flow and timing assessed in QUADAS-2 (n = 7, I2 = 88), and blinded index test evaluation (n = 14, I2 = 87). Study characteristics with increasing χ2 were those with correction for contrast agent leakage according to Boxerman et al1 (n = 8, τ2 = 2.58), those reporting on WHO 2007 classification (n = 11, τ2 = 2.07), and those with a prospective study design (n = 11, τ2 = 1.94).

View this table:
  • View inline
  • View popup

Factors affecting heterogeneity

Individual Patient Data.

A total of 190 patients (105 with WHO grade II, 85 with WHO grade III) from 10 studies reported on individual patient data (On-line Table 5). ROC analysis showed discriminatory potential between glioma grades II and III (n = 190) with an area under curve of 0.77 with maximum accuracy at an exploratory cutoff of 2.02 (Fig 4). Data were stratified for tumor type: astrocytomas (n = 102), with an area under curve of 0.86 and maximum accuracy at cutoff at 2.02, oligoastrocytomas (n = 28) with an area under curve of 0.83 and maximum accuracy at cutoff at 3.19, and oligodendrogliomas (n = 60) with an area under curve of 0.61 and maximum accuracy at cutoff at 6.23.

Fig 4.
  • Download figure
  • Open in new tab
  • Download powerpoint
Fig 4.

ROC curve on individual patient data from 10 studies including all patients (n = 190).

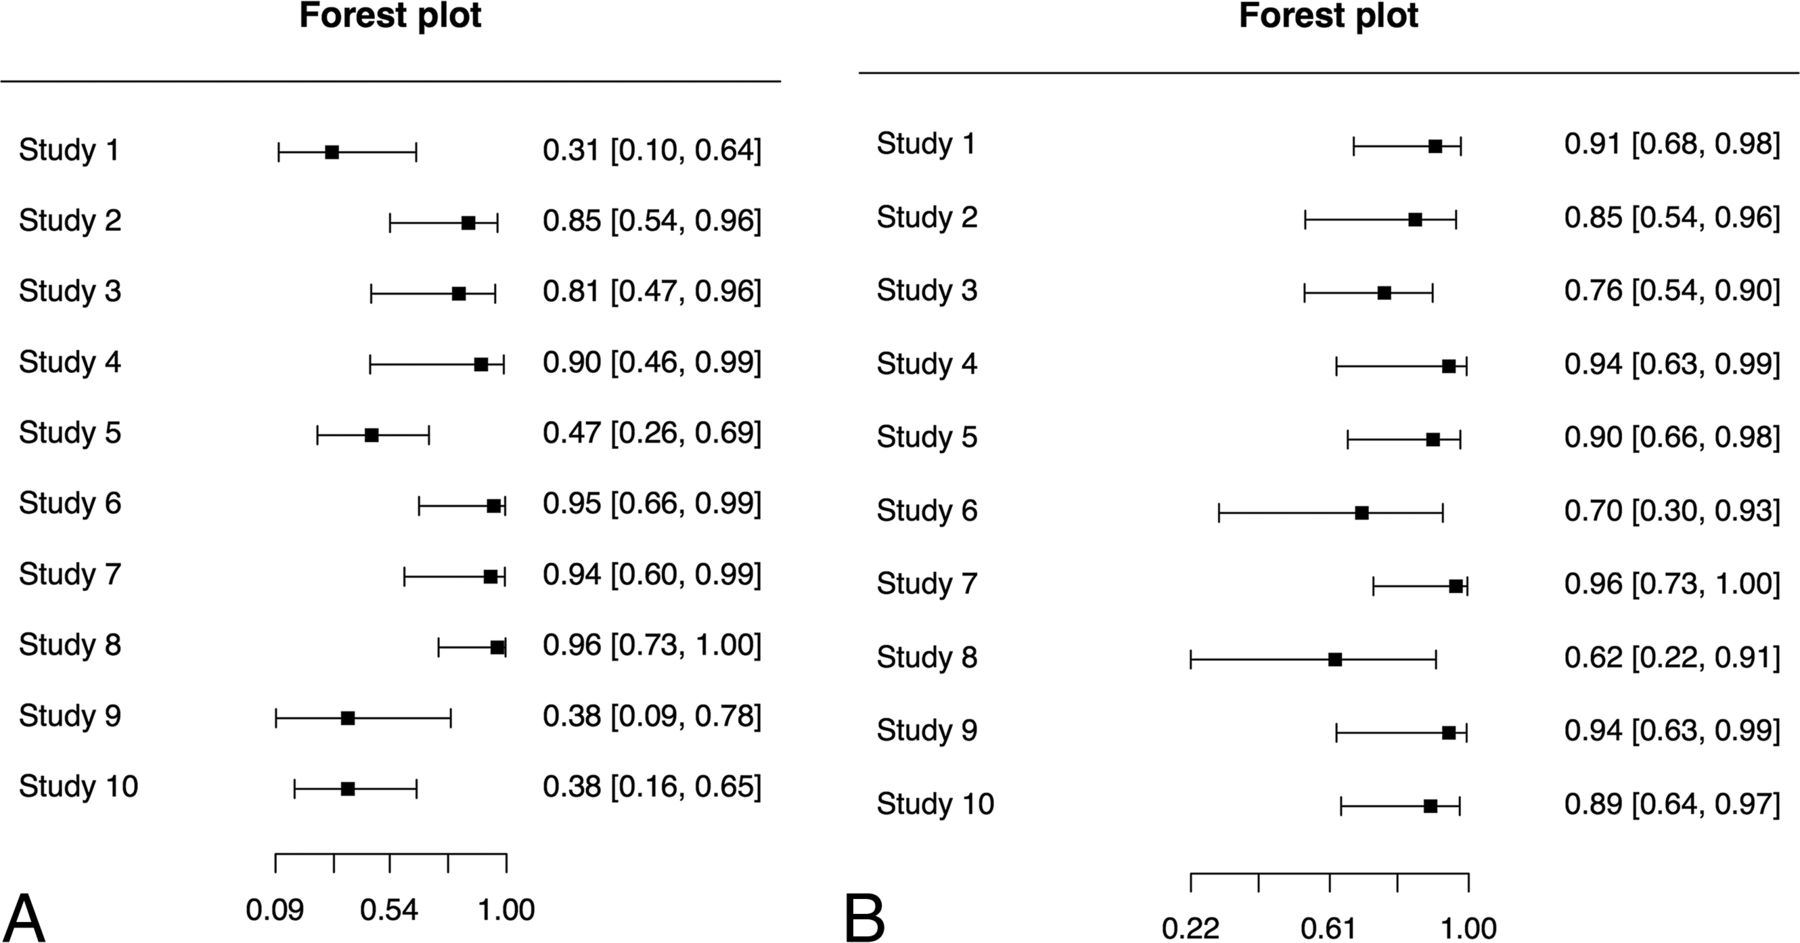
Data on true-positive, false-negative, false-positive, and true-negative counts from each study are presented in On-line Table 6. Univariate paired forest plots for individual patient data are presented in Fig 5A, -B.

Fig 5.
  • Download figure
  • Open in new tab
  • Download powerpoint
Fig 5.

Paired forest plots for individual patient data (n = 190). A, Forest plot of sensitivity. B, Forest plot of specificity.

A bivariate diagnostic random-effects meta-analysis model with a restricted maximum likelihood estimation method described the summary receiver operating characteristic curve in Fig 6 with a sensitivity of 0.71 (95% CI, 0.48–0.86) and a false-positive rate of 0.15 (95% CI, 0.09–0.25).

Fig 6.
  • Download figure
  • Open in new tab
  • Download powerpoint
Fig 6.

Graph showing a point estimate of the pair of sensitivity and false-positive rates plotted together with a confidence region, without extrapolation beyond the range of the original data (individual patient data, n = 190).

Discussion

This meta-analysis investigated the potential of DSC perfusion MR imaging to distinguish glioma grades II and III. Our study showed significant differences in rCBVmax between glioma grades II and III, with higher rCBVmax in WHO grade III compared with grade II. Furthermore, we evaluated individual patient data on rCBVmax to explore the diagnostic potential and the optimal cutoff for rCBVmax between glioma grades II and III, stratified for glial subtypes.

The importance of this meta-analysis is mainly that it describes the differences in rCBVmax between glioma grades II and III and that these differences can be measured and applied in a clinical setting. This evidence is based on data from 28 studies including 727 individual patients. This is an interesting finding in a field with small conflicting studies. Noninvasive glioma grade evaluation is an important adjunct to neuropathologic evaluation in patients deemed inoperable or at longitudinal follow-up. It might also be of value in patients with nonrepresentative biopsies that might lead to a false-negative diagnosis. Furthermore, the pooling of data across studies adds precision to estimates and can guide future work.

The quality and bias assessment of included studies showed intermediate-to-low risk of bias and an intermediate-to-high study quality. However, minor concerns about blinding of index and reference tests, flow and timing in the studies, and the lack of prespecified cutoffs in ROC analysis could have affected the results of the meta-analysis. Although no asymmetry was detected in the funnel plot, evidence of greay literature was searched in ClinicalTrials.gov.

Statistical heterogeneity between studies was substantial. Potential sources for heterogeneity were evaluated but did not alter the main study finding of statistical differences in rCBVmax between glioma grades II and III, except for sensitivity analyses of 3 studies with a histogram technique to identify rCBVmax, which showed no statistically significant difference in rCBVmax between groups of glioma grades II and III.10,21,37

Analyzing specific subtypes of glioma grades II and III preoperatively is counterintuitive because subtype attribution is largely unknown before neuropathologic evaluation. Knowledge of differences in rCBVmax between subtypes of gliomas relates to discrepancies in biology, more than it adds to the diagnostic potential in a preoperative clinical setting.38⇓⇓–41 However, while sensitivity analysis of studies analyzing oligodendroglial tumors (oligoastrocytomas or oligodendrogliomas) showed differences in rCBVmax among tumor grades similar to those in astrocytomas, the individual patient data analysis stratifying oligodendroglial tumors into oligoastrocytomas and oligodendrogliomas decreased the diagnostic potential when analyzing oligodendrogliomas separately.

DSC might be of added value at the longitudinal follow-up in specific glioma subtypes after initial neuropathologic diagnosis when assessing malignant transformation. Preoperatively when the tumor subtype is unknown (or only suspected based on the morphologic appearance on CT or MR imaging), a true diagnostic discrepancy by rCBVmax between glioma grades II and III is possibly hampered by the lack of information regarding glial cell subtype. Speaking for the applicability of DSC is the, relative to astrocytomas, lower incidence of oligodendrogliomas, making this method important in most patients.

When evaluating the diagnostic accuracy of DSC in this meta-analysis, we used exploratory evaluations of optimal cutoffs for discrimination between glioma grades II and III. This lack of evaluating diagnostic accuracy from a prespecified cutoff can increase the diagnostic potential presented in the meta-analysis. A limitation in DSC perfusion MR imaging is the nonlinear relationship between gadolinium concentration and the relaxivity-time curve, and nonexponential relaxation decay.42 Consequently, measured rCBV values, despite normalization to healthy white matter, are dependent on TE, injection rate, and total dose and gadolinium preloading and act as potential drivers for heterogeneity.43

When discussing an optimal cutoff between glioma grades II and III, we found maximum accuracy from ROC analysis at rCBVmax = 2.02 (individual patient data, No. of patients = 190, No. of studies = 10). This is a higher cutoff than previously suggested for optimal discrimination between low- (WHO I and II) and high-grade gliomas (WHO III and IV), which might be explained by different compositions of specific grades and subtypes in the groups of low- and high-grade gliomas in previously published material. This cutoff needs to be validated in prospective studies with standardized methodology, taking the differences in biology between glioma subtypes into account.

On the basis of subgroup analyses, the new molecular advances and WHO 2016 classification are applicable to our results regarding astrocytomas and oligodendrogliomas. The main difference pertains to molecular classification of oligoastrocytomas as either astrocytomas or oligodendrogliomas, which are analyzed separately in the individual patient data analysis.17

Conclusions

This meta-analysis evaluates DSC MR imaging perfusion in patients with glioma grades II and III. A higher rCBVmax was found in glioma grade III compared with grade II (n = 727). A high diagnostic accuracy was found for all patients and when analyzing astrocytomas separately; however, the diagnostic accuracy was substantially reduced when discriminating grade II and III oligodendrogliomas.

Footnotes

  • One of the authors (Anna F.D.) received funding from Karolinska University Hospital, Department of Neuroradiology.

References

  1. 1.↵
    1. Boxerman JL,
    2. Schmainda KM,
    3. Weisskoff RM
    . Relative cerebral blood volume maps corrected for contrast agent extravasation significantly correlate with glioma tumor grade, whereas uncorrected maps do not. AJNR Am J Neuroradiol 2006;27:859–67 pmid:16611779
    Abstract/FREE Full Text
  2. 2.↵
    1. Boxerman JL,
    2. Shiroishi MS,
    3. Ellingson BM, et al
    . Dynamic susceptibility contrast MR imaging in glioma: review of current clinical practice. Magn Reson Imaging Clin N Am 2016;24:649–70 doi:10.1016/j.mric.2016.06.005 pmid:27742108
    CrossRefPubMed
  3. 3.↵
    1. Law M,
    2. Young R,
    3. Babb J, et al
    . Histogram analysis versus region of interest analysis of dynamic susceptibility contrast perfusion MR imaging data in the grading of cerebral gliomas. AJNR Am J Neuroradiol 2007;28:761–66 pmid:17416835
    Abstract/FREE Full Text
  4. 4.↵
    1. Hilario A,
    2. Ramos A,
    3. Perez-Nuñez A, et al
    . The added value of apparent diffusion coefficient to cerebral blood volume in the preoperative grading of diffuse gliomas. AJNR Am J Neuroradiol 2012;33:701–07 doi:10.3174/ajnr.A2846 pmid:22207304
    Abstract/FREE Full Text
  5. 5.↵
    1. Wang XC,
    2. Zhang H,
    3. Tan Y, et al
    . Combined value of susceptibility-weighted and perfusion-weighted imaging in assessing WHO grade for brain astrocytomas. J Magn Reson Imaging 2014;39:1569–74 doi:10.1002/jmri.24312 pmid:24987755
    CrossRefPubMed
  6. 6.↵
    1. Caulo M,
    2. Panara V,
    3. Tortora D, et al
    . Data-driven grading of brain gliomas: a multiparametric MR imaging study. Radiology 2014;272:494–503 doi:10.1148/radiol.14132040 pmid:24661247
    CrossRefPubMed
  7. 7.↵
    1. Law M,
    2. Yang S,
    3. Wang H, et al
    . Glioma grading: sensitivity, specificity, and predictive values of perfusion MR imaging and proton MR spectroscopic imaging compared with conventional MR imaging. AJNR Am J Neuroradiol 2003;24:1989–98 pmid:14625221
    Abstract/FREE Full Text
  8. 8.↵
    1. Park MJ,
    2. Kim HS,
    3. Jahng GH, et al
    . Semiquantitative assessment of intratumoral susceptibility signals using non-contrast-enhanced high-field high-resolution susceptibility-weighted imaging in patients with gliomas: comparison with MR perfusion imaging. AJNR Am J Neuroradiol 2009;30:1402–08 doi:10.3174/ajnr.A1593 pmid:19369602
    Abstract/FREE Full Text
  9. 9.↵
    1. Van Cauter S,
    2. De Keyzer F,
    3. Sima DM, et al
    . Integrating diffusion kurtosis imaging, dynamic susceptibility-weighted contrast-enhanced MRI, and short echo time chemical shift imaging for grading gliomas. Neuro Oncol 2014;16:1010–21 doi:10.1093/neuonc/not304 pmid:24470551
    Abstract/FREE Full Text
  10. 10.↵
    1. Kim H,
    2. Choi SH,
    3. Kim JH, et al
    . Gliomas: application of cumulative histogram analysis of normalized cerebral blood volume on 3 T MRI to tumor grading. PLoS One 2013;8:e63462 doi:10.1371/journal.pone.0063462 pmid:23704910
    CrossRefPubMed
  11. 11.↵
    1. Emblem KE,
    2. Scheie D,
    3. Due-Tonnessen P, et al
    . Histogram analysis of MR imaging-derived cerebral blood volume maps: combined glioma grading and identification of low-grade oligodendroglial subtypes. AJNR Am J Neuroradiol 2008;29:1664–70 doi:10.3174/ajnr.A1182 pmid:18583405
    Abstract/FREE Full Text
  12. 12.↵
    1. Di Costanzo A,
    2. Pollice S,
    3. Trojsi F, et al
    . Role of perfusion-weighted imaging at 3 Tesla in the assessment of malignancy of cerebral gliomas [In English, Italian]. Radiol Med 2008;113:134–43 doi:10.1007/s11547-008-0232-2 pmid:18338133
    CrossRefPubMed
  13. 13.↵
    1. Law M,
    2. Young R,
    3. Babb J, et al
    . Comparing perfusion metrics obtained from a single compartment versus pharmacokinetic modeling methods using dynamic susceptibility contrast-enhanced perfusion MR imaging with glioma grade. AJNR Am J Neuroradiol 2006;27:1975–82 pmid:17032878
    Abstract/FREE Full Text
  14. 14.↵
    1. Caseiras GB,
    2. Chheang S,
    3. Babb J, et al
    . Relative cerebral blood volume measurements of low-grade gliomas predict patient outcome in a multi-institution setting. Eur J Radiol 2010;73:215–20 doi:10.1016/j.ejrad.2008.11.005 pmid:19201123
    CrossRefPubMed
  15. 15.↵
    1. Nasseri M,
    2. Gahramanov S,
    3. Netto JP, et al
    . Evaluation of pseudoprogression in patients with glioblastoma multiforme using dynamic magnetic resonance imaging with ferumoxytol calls RANO criteria into question. Neuro Oncol 2014;16:1146–54 doi:10.1093/neuonc/not328 pmid:24523362
    Abstract/FREE Full Text
  16. 16.↵
    1. Hu LS,
    2. Kelm Z,
    3. Korfiatis P, et al
    . Impact of software modeling on the accuracy of perfusion MRI in glioma. AJNR Am J Neuroradiol 2015;36:2242–49 doi:10.3174/ajnr.A4451 pmid:26359151
    Abstract/FREE Full Text
  17. 17.↵
    1. Louis DN,
    2. Perry A,
    3. Reifenberger G, et al
    . The 2016 World Health Organization Classification of Tumors of the Central Nervous System: a summary. Acta Neuropathol 2016;131:803–20 doi:10.1007/s00401-016-1545-1 pmid:27157931
    CrossRefPubMed
  18. 18.↵
    1. Usinskiene J,
    2. Ulyte A,
    3. Bjornerud A, et al
    . Optimal differentiation of high- and low-grade glioma and metastasis: a meta-analysis of perfusion, diffusion, and spectroscopy metrics. Neuroradiology 2016;58:339–50 doi:10.1007/s00234-016-1642-9 pmid:26767528
    CrossRefPubMed
  19. 19.↵
    1. Crocetti E,
    2. Trama A,
    3. Stiller C, et al
    . Epidemiology of glial and non-glial brain tumours in Europe. Eur J Cancer 2012;48:1532–42 doi:10.1016/j.ejca.2011.12.013 pmid:22227039
    CrossRefPubMed
  20. 20.↵
    1. Kelly PJ,
    2. Daumas-Duport C,
    3. Kispert DB, et al
    . Imaging-based stereotaxic serial biopsies in untreated intracranial glial neoplasms. J Neurosurg 1987;66:865–74 doi:10.3171/jns.1987.66.6.0865 pmid:3033172
    CrossRefPubMed
  21. 21.↵
    1. Catalaa I,
    2. Henry R,
    3. Dillon WP, et al
    . Perfusion, diffusion and spectroscopy values in newly diagnosed cerebral gliomas. NMR Biomed 2006;19:463–75 doi:10.1002/nbm.1059 pmid:16763973
    CrossRefPubMed
  22. 22.↵
    1. Cuccarini V,
    2. Erbetta A,
    3. Farinotti M, et al
    . Advanced MRI may complement histological diagnosis of lower grade gliomas and help in predicting survival. J Neurooncol 2016;126:279–88 doi:10.1007/s11060-015-1960-5 pmid:26468137
    CrossRefPubMed
  23. 23.↵
    1. Nguyen TB,
    2. Cron GO,
    3. Perdrizet K, et al
    . Comparison of the diagnostic accuracy of DSC- and dynamic contrast-enhanced MRI in the preoperative grading of astrocytomas. AJNR Am J Neuroradiol 2015;36:2017–22 doi:10.3174/ajnr.A4398 pmid:26228886
    Abstract/FREE Full Text
  24. 24.↵
    1. Saito T,
    2. Yamasaki F,
    3. Kajiwara Y, et al
    . Role of perfusion-weighted imaging at 3T in the histopathological differentiation between astrocytic and oligodendroglial tumors. Eur J Radiol 2012;81:1863–69 doi:10.1016/j.ejrad.2011.04.009 pmid:21543173
    CrossRefPubMed
  25. 25.↵
    1. Thomsen H,
    2. Steffensen E,
    3. Larsson EM
    . Perfusion MRI (dynamic susceptibility contrast imaging) with different measurement approaches for the evaluation of blood flow and blood volume in human gliomas. Acta Radiol 2012;53:95–101 doi:10.1258/ar.2011.110242 pmid:22114021
    CrossRefPubMed
  26. 26.↵
    1. Toyooka M,
    2. Kimura H,
    3. Uematsu H, et al
    . Tissue characterization of glioma by proton magnetic resonance spectroscopy and perfusion-weighted magnetic resonance imaging: glioma grading and histological correlation. Clin Imaging 2008;32:251–58 doi:10.1016/j.clinimag.2007.12.006 pmid:18603178
    CrossRefPubMed
  27. 27.↵
    1. Togao O,
    2. Hiwatashi A,
    3. Yamashita K, et al
    . Grading diffuse gliomas without intense contrast enhancement by amide proton transfer MR imaging: comparisons with diffusion- and perfusion-weighted imaging. Eur Radiol 2017;27:578–88 doi:10.1007/s00330-016-4328-0 pmid:27003139
    CrossRefPubMed
  28. 28.↵
    1. Moher D,
    2. Liberati A,
    3. Tetzlaff J, et al
    . Preferred reporting items for systematic reviews and meta-analyses: the PRISMA statement. BMJ 2009;339:b2535 doi:10.1136/bmj.b2535 pmid:19622551
    FREE Full Text
  29. 29.↵
    1. McGrath TA,
    2. McInnes MD,
    3. Korevaar DA, et al
    . Meta-analyses of diagnostic accuracy in imaging journals: analysis of pooling techniques and their effect on summary estimates of diagnostic accuracy. Radiology 2016;281:78–85 doi:10.1148/radiol.2016152229 pmid:27082781
    CrossRefPubMed
  30. 30.↵
    1. Whiting PF,
    2. Rutjes AW,
    3. Westwood ME, et al
    . QUADAS-2: a revised tool for the quality assessment of diagnostic accuracy studies. Ann Intern Med 2011;155:529–36 doi:10.7326/0003-4819-155-8-201110180-00009 pmid:22007046
    CrossRefPubMed
  31. 31.↵
    1. Higgins JP,
    2. Green S
    . Cochrane Handbook for Systematic Reviews of Interventions, Version 5.1.0 (updated March 2011)Accessed September 6, 2016. The Cochrane Collaboration, 2011. http://handbook.cochrane.org/. Accessed September 6, 2016.
  32. 32.↵
    1. Hozo SP,
    2. Djulbegovic B,
    3. Hozo I
    . Estimating the mean and variance from the median, range, and the size of a sample. BMC Med Res Methodol 2005;5:13 doi:10.1186/1471-2288-5-13 pmid:15840177
    CrossRefPubMed
  33. 33.↵
    1. Light RJ,
    2. Pillemer DB
    . Summing Up: The Science of Reviewing Research. Cambridge: Harvard University Press; 1984
  34. 34.↵
    1. Doebler P,
    2. Holling H
    . Meta-Analysis of Diagnostic Accuracy with mada. 2015. https://cran.r-project.org/web/packages/mada/vignettes/mada.pdf. Accessed September 6, 2016.
  35. 35.↵
    R Development Core Team. R: A Language and Environment for Statistical Computing. Vienna: R Foundation for Statistical Computing; 2010
  36. 36.↵
    Review Manager (RevMan). 5.3 ed. Copenhagen: The Nordic Cochrane Centre: The Cochrane Collaboration; 2014 http://www.medsci.cn/webeditor/uploadfile/201408/20140815214316360.pdf. Accessed September 6, 2016.
  37. 37.↵
    1. Falk A,
    2. Fahlström M,
    3. Rostrup E, et al
    . Discrimination between glioma grades II and III in suspected low-grade gliomas using dynamic contrast-enhanced and dynamic susceptibility contrast perfusion MR imaging: a histogram analysis approach. Neuroradiology 2014;56:1031–38 doi:10.1007/s00234-014-1426-z pmid:25204450
    CrossRefPubMed
  38. 38.↵
    1. Cairncross JG,
    2. Wang M,
    3. Jenkins RB, et al
    . Benefit from procarbazine, lomustine, and vincristine in oligodendroglial tumors is associated with mutation of IDH. J Clin Oncol 2014;32:783–90 doi:10.1200/JCO.2013.49.3726 pmid:24516018
    Abstract/FREE Full Text
  39. 39.↵
    1. van den Bent MJ,
    2. Brandes AA,
    3. Taphoorn MJ, et al
    . Adjuvant procarbazine, lomustine, and vincristine chemotherapy in newly diagnosed anaplastic oligodendroglioma: long-term follow-up of EORTC brain tumor group study 26951. J Clin Oncol 2013;31:344–50 doi:10.1200/JCO.2012.43.2229 pmid:23071237
    Abstract/FREE Full Text
  40. 40.↵
    1. Eckel-Passow JE,
    2. Lachance DH,
    3. Molinaro AM, et al
    . Glioma groups based on 1p/19q, IDH, and TERT promoter mutations in tumors. N Engl J Med 2015;372:2499–508 doi:10.1056/NEJMoa1407279 pmid:26061753
    CrossRefPubMed
  41. 41.↵
    1. Brat DJ,
    2. Verhaak RG,
    3. Aldape KD, et al
    ; Cancer Genome Atlas Research Network. Comprehensive, integrative genomic analysis of diffuse lower-grade gliomas. N Engl J Med 2015;372:2481–98 doi:10.1056/NEJMoa1402121 pmid:26061751
    CrossRefPubMed
  42. 42.↵
    1. Kiselev VG,
    2. Posse S
    . Analytical model of susceptibility-induced MR signal dephasing: effect of diffusion in a microvascular network. Magn Reson Med 1999;41:499–509 pmid:10204873
    CrossRefPubMed
  43. 43.↵
    1. Yablonskiy DA,
    2. Haacke EM
    . Theory of NMR signal behavior in magnetically inhomogeneous tissues: the static dephasing regime. Magn Reson Med 1994;32:749–63 doi:10.1002/mrm.1910320610 pmid:7869897
    CrossRefPubMed
  • Received December 7, 2016.
  • Accepted after revision March 10, 2017.
  • © 2017 by American Journal of Neuroradiology
View Abstract
PreviousNext
Back to top

In this issue

American Journal of Neuroradiology: 38 (7)
American Journal of Neuroradiology
Vol. 38, Issue 7
1 Jul 2017
  • Table of Contents
  • Index by author
  • Complete Issue (PDF)
Advertisement
Print
Download PDF
Email Article

Thank you for your interest in spreading the word on American Journal of Neuroradiology.

NOTE: We only request your email address so that the person you are recommending the page to knows that you wanted them to see it, and that it is not junk mail. We do not capture any email address.

Enter multiple addresses on separate lines or separate them with commas.
Discrimination between Glioma Grades II and III Using Dynamic Susceptibility Perfusion MRI: A Meta-Analysis
(Your Name) has sent you a message from American Journal of Neuroradiology
(Your Name) thought you would like to see the American Journal of Neuroradiology web site.
CAPTCHA
This question is for testing whether or not you are a human visitor and to prevent automated spam submissions.
Cite this article
Anna F. Delgado, Alberto F. Delgado
Discrimination between Glioma Grades II and III Using Dynamic Susceptibility Perfusion MRI: A Meta-Analysis
American Journal of Neuroradiology Jul 2017, 38 (7) 1348-1355; DOI: 10.3174/ajnr.A5218

Citation Manager Formats

  • BibTeX
  • Bookends
  • EasyBib
  • EndNote (tagged)
  • EndNote 8 (xml)
  • Medlars
  • Mendeley
  • Papers
  • RefWorks Tagged
  • Ref Manager
  • RIS
  • Zotero
0 Responses
Respond to this article
Share
Bookmark this article
Discrimination between Glioma Grades II and III Using Dynamic Susceptibility Perfusion MRI: A Meta-Analysis
Anna F. Delgado, Alberto F. Delgado
American Journal of Neuroradiology Jul 2017, 38 (7) 1348-1355; DOI: 10.3174/ajnr.A5218
del.icio.us logo Twitter logo Facebook logo Mendeley logo
  • Tweet Widget
  • Facebook Like
  • Google Plus One
Purchase

Jump to section

  • Article
    • Abstract
    • ABBREVIATIONS:
    • Materials and Methods
    • Results
    • Discussion
    • Conclusions
    • Footnotes
    • References
  • Figures & Data
  • Supplemental
  • Info & Metrics
  • Responses
  • References
  • PDF

Related Articles

  • PubMed
  • Google Scholar

Cited By...

  • Impact of 18F-FET PET/MRI on Clinical Management of Brain Tumor Patients
  • Prognostic Value of Preoperative MRI Metrics for Diffuse Lower-Grade Glioma Molecular Subtypes
  • MR Imaging Features of Anaplastic Pleomorphic Xanthoastrocytoma Mimicking High-Grade Astrocytoma
  • Crossref (42)
  • Google Scholar

This article has been cited by the following articles in journals that are participating in Crossref Cited-by Linking.

  • Primary brain tumours in adults
    Martin J van den Bent, Marjolein Geurts, Pim J French, Marion Smits, David Capper, Jacoline E C Bromberg, Susan M Chang
    The Lancet 2023 402 10412
  • Validated imaging biomarkers as decision-making tools in clinical trials and routine practice: current status and recommendations from the EIBALL* subcommittee of the European Society of Radiology (ESR)
    Nandita M. deSouza, Eric Achten, Angel Alberich-Bayarri, Fabian Bamberg, Ronald Boellaard, Olivier Clément, Laure Fournier, Ferdia Gallagher, Xavier Golay, Claus Peter Heussel, Edward F. Jackson, Rashindra Manniesing, Marius E. Mayerhofer, Emanuele Neri, James O’Connor, Kader Karli Oguz, Anders Persson, Marion Smits, Edwin J. R. van Beek, Christoph J. Zech
    Insights into Imaging 2019 10 1
  • Glioma Grade Discrimination with MR Diffusion Kurtosis Imaging: A Meta-Analysis of Diagnostic Accuracy
    Anna Falk Delgado, Markus Nilsson, Danielle van Westen, Alberto Falk Delgado
    Radiology 2018 287 1
  • MRI biomarkers in neuro-oncology
    Marion Smits
    Nature Reviews Neurology 2021 17 8
  • Arterial spin labeling MR imaging for differentiation between high- and low-grade glioma—a meta-analysis
    Alberto Falk Delgado, Francesca De Luca, Danielle van Westen, Anna Falk Delgado
    Neuro-Oncology 2018 20 11
  • DSC and DCE Histogram Analyses of Glioma Biomarkers, Including IDH, MGMT, and TERT, on Differentiation and Survival
    Han-wen Zhang, Gui-wen lyu, Wen-jie He, Yi Lei, Fan Lin, Meng-zhu Wang, Hong Zhang, Li-hong Liang, Yu-ning Feng, Ji-hu Yang
    Academic Radiology 2020 27 12
  • Amide proton transfer-weighted MRI in distinguishing high- and low-grade gliomas: a systematic review and meta-analysis
    Chong Hyun Suh, Ji Eun Park, Seung Chai Jung, Choong Gon Choi, Sang Joon Kim, Ho Sung Kim
    Neuroradiology 2019 61 5
  • Dynamic susceptibility contrast and diffusion MR imaging identify oligodendroglioma as defined by the 2016 WHO classification for brain tumors: histogram analysis approach
    Anna Latysheva, Kyrre Eeg Emblem, Petter Brandal, Einar Osland Vik-Mo, Jens Pahnke, Kjetil Røysland, John K. Hald, Andrés Server
    Neuroradiology 2019 61 5
  • FAP-specific PET signaling shows a moderately positive correlation with relative CBV and no correlation with ADC in 13 IDH wildtype glioblastomas
    Manuel Röhrich, Ralf Floca, Lisa Loi, Sebastian Adeberg, Paul Windisch, Frederik L. Giesel, Clemens Kratochwil, Paul Flechsig, Hendrik Rathke, Thomas Lindner, Anastasia Loktev, Heinz Peter Schlemmer, Uwe Haberkorn, Daniel Paech
    European Journal of Radiology 2020 127
  • Discrimination between primary low-grade and high-grade glioma with 11C-methionine PET: a bivariate diagnostic test accuracy meta-analysis
    Anna Falk Delgado, Alberto Falk Delgado
    The British Journal of Radiology 2018

More in this TOC Section

  • Diagnostic Neuroradiology of Monoclonal Antibodies
  • Clinical Outcomes After Chiari I Decompression
  • Segmentation of Brain Metastases with BLAST
Show more Adult Brain

Similar Articles

Advertisement

Indexed Content

  • Current Issue
  • Accepted Manuscripts
  • Article Preview
  • Past Issues
  • Editorials
  • Editor's Choice
  • Fellows' Journal Club
  • Letters to the Editor
  • Video Articles

Cases

  • Case Collection
  • Archive - Case of the Week
  • Archive - Case of the Month
  • Archive - Classic Case

Special Collections

  • AJNR Awards
  • ASNR Foundation Special Collection
  • Most Impactful AJNR Articles
  • Photon-Counting CT
  • Spinal CSF Leak Articles (Jan 2020-June 2024)

More from AJNR

  • Trainee Corner
  • Imaging Protocols
  • MRI Safety Corner

Multimedia

  • AJNR Podcasts
  • AJNR Scantastics

Resources

  • Turnaround Time
  • Submit a Manuscript
  • Submit a Video Article
  • Submit an eLetter to the Editor/Response
  • Manuscript Submission Guidelines
  • Statistical Tips
  • Fast Publishing of Accepted Manuscripts
  • Graphical Abstract Preparation
  • Imaging Protocol Submission
  • Evidence-Based Medicine Level Guide
  • Publishing Checklists
  • Author Policies
  • Become a Reviewer/Academy of Reviewers
  • News and Updates

About Us

  • About AJNR
  • Editorial Board
  • Editorial Board Alumni
  • Alerts
  • Permissions
  • Not an AJNR Subscriber? Join Now
  • Advertise with Us
  • Librarian Resources
  • Feedback
  • Terms and Conditions
  • AJNR Editorial Board Alumni

American Society of Neuroradiology

  • Not an ASNR Member? Join Now

© 2025 by the American Society of Neuroradiology All rights, including for text and data mining, AI training, and similar technologies, are reserved.
Print ISSN: 0195-6108 Online ISSN: 1936-959X

Powered by HighWire