
Abstract
BACKGROUND AND PURPOSE: Arterial spin-labeling MR imaging has been recently developed as a noninvasive technique with magnetically labeled arterial blood water as an endogenous contrast medium for the evaluation of CBF. Our aim was to compare arterial spin-labeling MR imaging and SPECT in the visual assessment of CBF in patients with Alzheimer disease.
MATERIALS AND METHODS: In 33 patients with Alzheimer disease or mild cognitive impairment due to Alzheimer disease, CBF images were obtained by using both arterial spin-labeling–MR imaging with a postlabeling delay of 1.5 seconds and 2.5 seconds (PLD1.5 and PLD2.5, respectively) and brain perfusion SPECT. Twenty-two brain regions were visually assessed, and the diagnostic confidence of Alzheimer disease was recorded.
RESULTS: Among all arterial spin-labeling images, 84.9% of PLD1.5 and 9% of PLD2.5 images showed the typical pattern of advanced Alzheimer disease (ie, decreased CBF in the bilateral parietal, temporal, and frontal lobes). PLD1.5, PLD2.5, and SPECT imaging resulted in obviously different visual assessments. PLD1.5 showed a broad decrease in CBF, which could have been due to an early perfusion. In contrast, PLD2.5 did not appear to be influenced by an early perfusion but showed fewer pathologic findings than SPECT.
CONCLUSIONS: The distinctions observed by us should be carefully considered in the visual assessments of Alzheimer disease. Further studies are required to define the patterns of change in arterial spin-labeling–MR imaging associated with Alzheimer disease.
ABBREVIATIONS:
- AD
- Alzheimer disease
- ASL
- arterial spin-labeling
- MCI
- mild cognitive impairment
- MMSE
- Mini-Mental State Examination
- PLD
- postlabeling delay
- PLD1.5
- postlabeling delay of 1.5 seconds
- PLD2.5
- postlabeling delay of 2.5 seconds
For the imaging diagnosis of Alzheimer disease (AD), CBF is typically evaluated with brain perfusion SPECT.1,2 MR imaging is also commonly performed, chiefly for the evaluation of atrophy and ischemic changes in the brain. Obtaining these images simultaneously would be significantly beneficial to both patients and caregivers. Arterial spin-labeling (ASL) MR imaging has been recently developed as a noninvasive technique with magnetically labeled arterial blood water as an endogenous contrast medium for the evaluation of CBF.3⇓⇓–6 Several studies have reported interesting perfusion comparisons between patients with various forms of dementia and demographically matched healthy controls. Both AD and mild cognitive impairment (MCI) have been associated with hypoperfusion in the middle occipital areas, medial temporal lobe, and especially the parietal lobe.7 Similar hypoperfusion has been reported in the posterior cingulate and precuneus, in addition to frontal and parietal regions.8,9 ASL-MR imaging is a potentially useful tool for the differential diagnosis of dementia.10,11 However, most studies have performed voxelwise or ROI analyses to detect abnormal findings in patients with AD compared with healthy patients or those with other forms of dementia. To date, only a few studies of AD have focused on visual assessment with ASL-MR imaging, mainly because of the lack of established criteria for using ASL-MR imaging to diagnose AD.
Pseudocontinuous ASL, the most common form of ASL, is a distinct form of pulsed and continuous labeling and is recommended for clinical imaging by the International Society for Magnetic Resonance in Medicine Workshop on Perfusion Imaging.12 For ASL imaging, arterial water in the neck is labeled with a radiofrequency pulse and the brain is imaged after a fixed time interval, which is termed the postlabeling delay (PLD) and is the key parameter of ASL imaging. However, the optimal PLD for the evaluation of patients with dementia is unknown. Many previous studies of AD have used a PLD of 1.5 seconds (PLD1.5),13,14 while others have used 2.0 seconds.15 The International Society for Magnetic Resonance in Medicine Workshop recommends 2.0 seconds for adult clinical patients,12 but a longer PLD might be appropriate for elderly patients due to their relatively slow blood flow. In the present study, we performed a clinical visual assessment to compare the CBF images obtained by using ASL-MR imaging or brain perfusion SPECT in patients with AD. PLDs of 1.5 and 2.5 seconds (PLD2.5) were used for ASL-MR imaging.
Materials and Methods
We recruited 33 patients who underwent brain MR imaging and SPECT for the diagnosis of AD or MCI due to AD between September 2015 and June 2016. Patients with AD met the criteria of the National Institute of Neurological and Communicative Disorders and Stroke–Alzheimer Disease and Related Disorders Association for probable AD.16 Patients were excluded from the study if they had a significant history of psychiatric or neurologic disorders other than AD, including stroke, head injury, epilepsy, psychiatric disorders, alcohol abuse, and other serious medical conditions. All patients underwent MR imaging, SPECT, and standard dementia screening, which included a medical history and Mini-Mental State Examination (MMSE) and neuropsychological testing. SPECT and MR imaging were performed ≤1 month apart. The local institutional review board approved the study, and all subjects provided written informed consent.
MR Imaging
MR imaging was performed with a 3T MR imaging system (Discovery 750w; GE Healthcare, Milwaukee, Wisconsin) and a 12-channel head coil. Structural imaging for anatomic information was performed with a sagittal 3D T1-weighted sequence (TR = 6.6 ms, TE = 2 ms, flip angle = 14°, matrix = 256 × 256, 170 sections, voxel size = 1.0 × 0.9 × 0.9 mm3, FOV = 23 × 23 cm) with an acquisition time of 6 minutes.
A whole-brain pseudocontinuous ASL 3D perfusion sequence was acquired (3D fast spin-echo acquisition with background suppression). The imaging protocol with PLD1.5 was TR = 4641 ms, TE = 10.7 ms, locations = 36, FOV = 23 × 23 cm, voxel size = 2 × 2 × 4 mm3, labeling duration = 1.5 seconds, NEX = 1, and an acquisition time of 1 minute 33 seconds. The imaging protocol with PLD2.5 was TR = 5336 ms, TE = 10.7 ms, and NEX = 2. All other parameters were the same, and the acquisition time was 2 minutes 51 seconds.
Brain Perfusion SPECT
The SPECT scans began 15 minutes after the intravenous injection of 148 MBq of iodine 123 N-isopropyl-p-iodoamphetamine (123I-IMP) (Nihon Mediphysics, Hyogo, Japan) and were performed for 30 minutes by using a SPECT/CT scanner (Symbia T16; Siemens, Erlangen, Germany). The SPECT scans were acquired by using low-medium-energy general purpose collimation, a 128 × 128 matrix of 3.3-mm pixel size, and 300 s/rotation in a continuous-rotation mode. SPECT reconstruction was performed with a Butterworth filter for filtered back-projection with a cutoff = 0.35/cm and an order of 8. A uniform attenuation correction was performed by using the Chang method, with μ = 0.11.
Visual Assessment
Two board-certified radiologists who are also nuclear medicine physicians with >10 years of experience in reading MR imaging and SPECT brain images and 2 years of experience reading ASL-MR imaging independently reviewed the images obtained in the present investigation without the clinical information of the patient. SPECT and ASL-MR imaging were shown with a section thickness of 6.6 and 6.4 mm, respectively. We used the scoring sheet shown in Fig 1 to assess 22 brain regions. The regions were located at the levels of the vertex, lateral ventricle, basal ganglia, and cerebellum. The raters scored each region by using a 4-point scale, in which zero indicated normal CBF; 1, a mild decrease; 2, a moderate decease; and 3, a severe decrease. The diagnostic confidence of AD was also scored between 0 and 4, in which 0 indicated definitely not AD; 1, probably not AD; 2, undetermined; 3, probably AD; and 4, definitely AD. ASL-MR images were displayed in gray-scale and in color-scale fused with T1-weighted images. SPECT images were displayed in color.

The regions used for scoring brain images. We evaluated 22 regions located at the levels of the vertex, lateral ventricle, basal ganglia, and cerebellum. The raters scored each region with a 4-point scale, where 0 is a normal CBF, 1 is a mild decrease, 2 is a moderate decease, and 3 is a severe decrease.
Statistical Analysis
The interrater variability was assessed for the diagnostic confidence of AD by using the κ statistic. The diagnostic confidence was evaluated with not only the 2-point scale but also positive (3 and 4) or negative (0–2) scores for AD diagnosis. The total scores for SPECT, PLD1.5, and PLD2.5 from each rater were analyzed by using a Friedman test. Data were analyzed in Excel (Microsoft, Redmond, Washington) and JMP12 (SAS, Cary, North Carolina). A P < .01 was statistically significant.
Results
Demographic Findings
Patient demographics are shown in Table 1, including age, the male-to-female ratio, and MMSE scores. There was no difference in age, but a significant difference in MMSE (P < .01) was observed between patients with AD and those with AD-induced MCI.
Demographic and neuropsychological summary of the participantsa
Visual Assessment
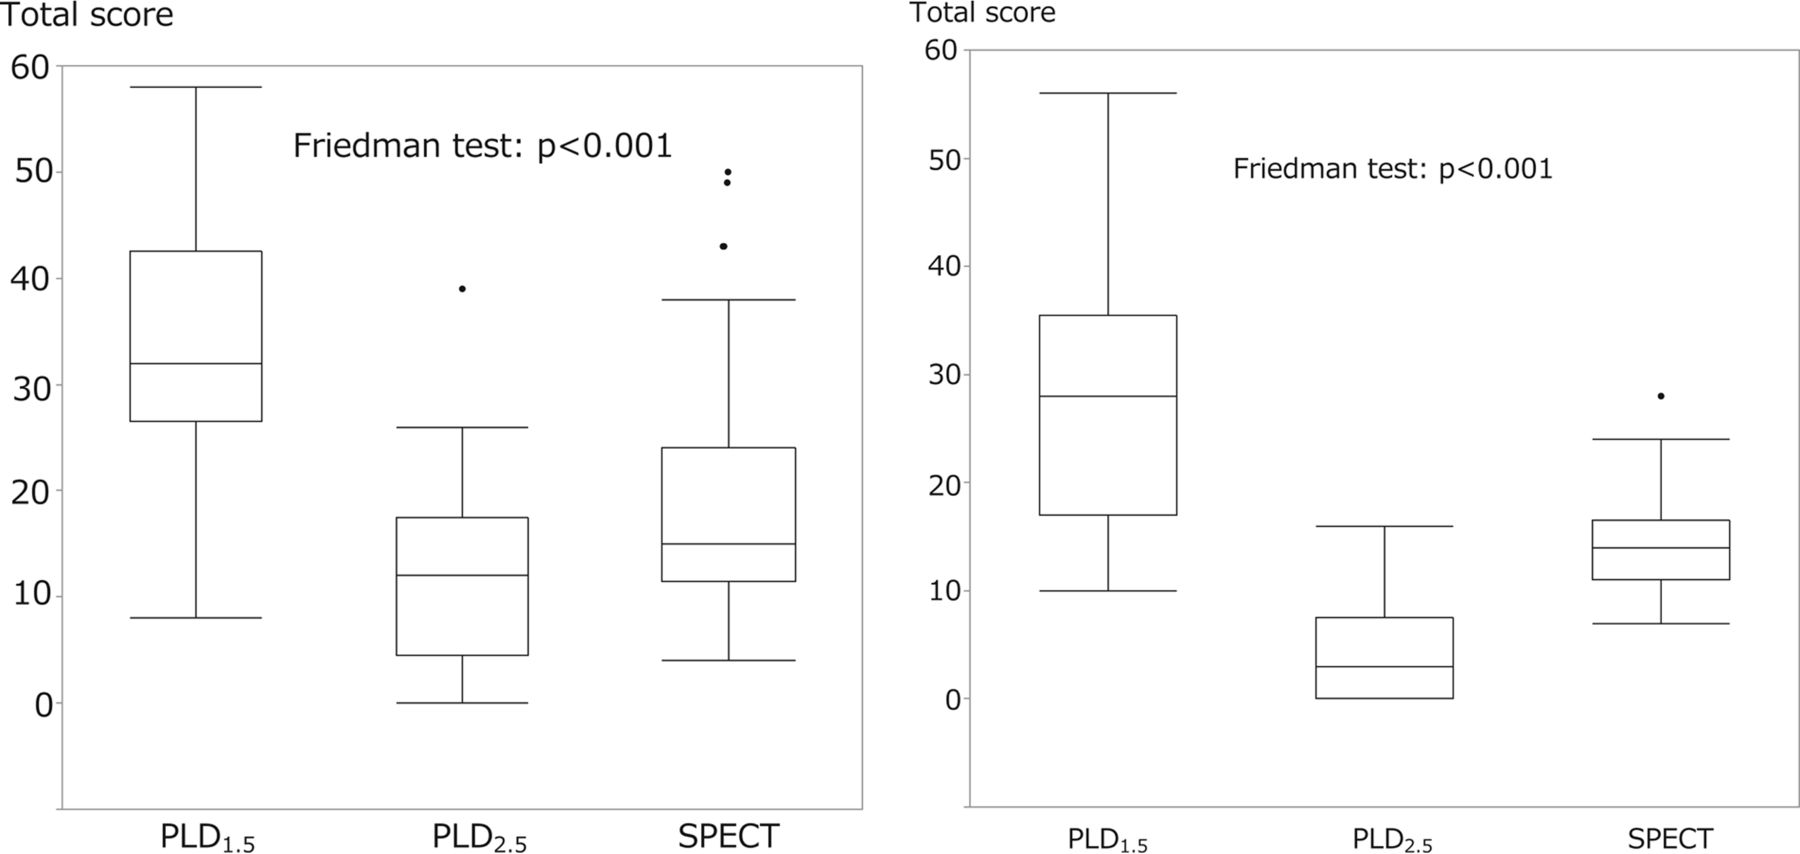
Table 2 shows the results of the visual assessment as the percentage of patients diagnosed with AD (score of 3 or 4) for each rater. The agreement concerning the percentage of patients with an AD diagnosis between the 2 raters is also shown. These results are presented for 3 groups: namely, the total population, the AD group (MMSE ≦ 21), and the AD-induced MCI group (MMSE > 21). Both raters observed that for the total population, the AD group, and the AD-induced MCI group, PLD1.5 imaging had the highest positive rate for AD diagnosis, while PLD2.5 imaging had the lowest. Moreover, the positive rate for AD diagnosis was higher for the AD group than for the MCI group (Table 2). The Friedman analysis of variance test revealed a significant difference in total scores among all 3 imaging modalities (P < .01), and the Wilcoxon test revealed a significant difference between the 2 groups in the assessment of PLD1.5, PLD2.5, and SPECT images (P < .01) (Fig 2). There were no significant differences between the AD and AD-induced MCI groups in the total score for 3 imaging modalities. The interrater agreements were low for both the 5-point or 2-alternative scoring of AD (Table 3).
The results of visual assessments for the diagnosis of AD
Interrater agreement

The comparisons of the total scores of the 2 raters for PLD1.5, PLD2.5, and SPECT images. The Friedman analysis of variance showed a significant difference among all 3 groups (P < .01), and the Wilcoxon test showed a significant difference between the 2 raters for the PLD1.5, PLD2.5, and SPECT total scores (P < .01).
Case Presentations
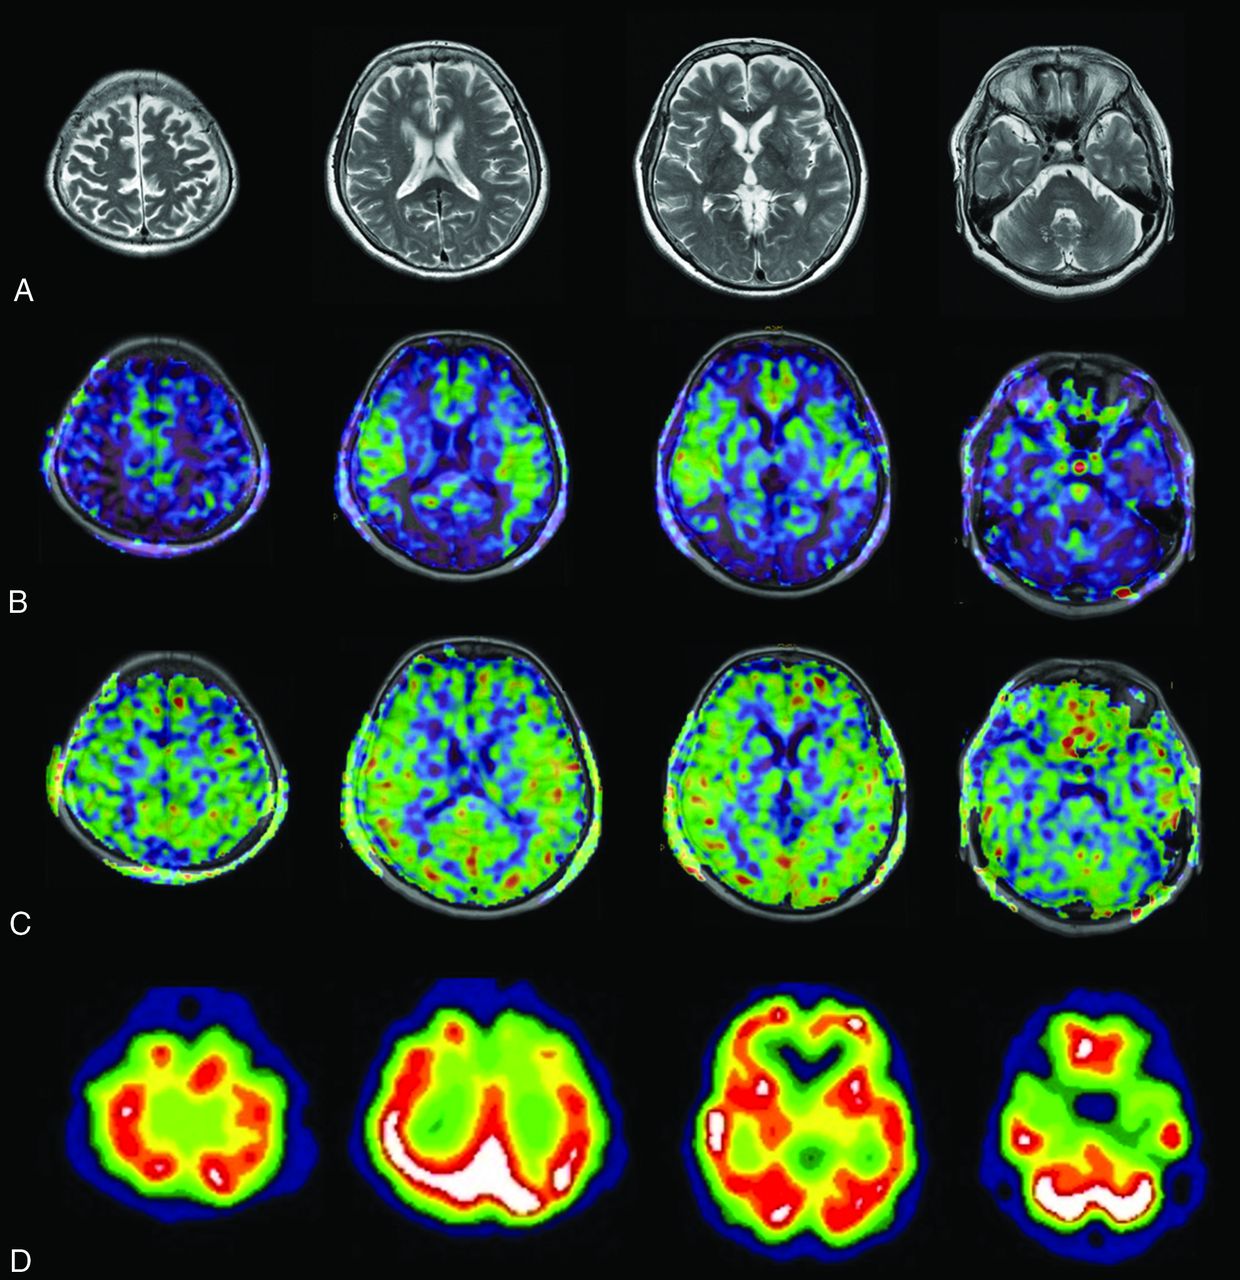
Case 1 was an 86-year-old woman with AD. Her MMSE score was 14. The ASL-MR imaging and SPECT images for this patient are shown in Fig 3. Case 2 was an 83-year-old woman with AD. Her MMSE score was 19. The images for this patient are shown in Fig 4. Case 3 was a 73-year-old woman with MCI due to AD. Her MMSE score was 23. The images for this patient are shown in Fig 5.

An 86-year-old woman with AD. The patient had an MMSE score of 14. Axial images of T2-weighted MR imaging (A), ASL-MR imaging with PLD1.5 in a color-scale fused with T1-weighted MR imaging (B), ASL-MR imaging with PLD2.5 in a color-scale fused with T1-weighted MR imaging (C), and brain perfusion SPECT at the level of the parietal lobe, corona radiata, basal ganglia, and cerebellum (D). Both raters indicated a score of 4 (definitely AD) for PLD1.5 and SPECT and 1 (probably not AD) for PLD2.5.

An 83-year-old woman with AD. The patient had an MMSE score of 19. Axial images of T2-weighted MR imaging (A), fused T1-weighted and PLD1.5 ASL-MR imaging (B), fused T1-weighted and PLD2.5 ASL-MR imaging (C), and brain perfusion SPECT (D). Both raters indicated a score of 4 for PLD1.5 and 2 (undetermined) for PLD2.5. One rater indicated a score of 3 (probably AD) and another rater indicated a score of 4 for SPECT.
A 73-year-old woman with MCI. The patient had an MMSE score of 23. Axial images of T2-weighted MR imaging (A), fused T1-weighted and PLD1.5 ASL-MR imaging (B), fused T1-weighted and PLD2.5 ASL-MR imaging (C), and brain perfusion SPECT (D). Both raters scored 4 for PLD1.5. However, 1 rater indicated a score of 1 (probably not AD) for PLD2.5 and 2 for SPECT, while another rater indicated a score of 0 (definitely not AD) for PLD2.5, and 1 for SPECT.
Discussion
We clearly observed differences in the visual assessments of PLD1.5, PLD2.5, and SPECT images. The total scores of the 2 raters were highest for the PLD1.5 images; this finding suggests a large decrease in CBF. Indeed, these scores were diminished or ambiguous in PLD2.5 images. SPECT findings were of intermediate severity compared with those for the PLD1.5 and PLD2.5 images. These findings appeared to have a profound effect on the diagnostic confidence of AD—that is, for both raters, the positive rate for AD diagnosis was very high (approximately 90%) with a high agreement rate for PLD1.5 images, while the diagnostic confidence of AD was low for PLD2.5 images with a low agreement rate. In addition, SPECT images were associated with a moderately high diagnostic confidence and agreement rate. The positive rate of AD diagnosis for the SPECT images in the present investigation was consistent with that of previous studies.1,2
In the present study, the PLD1.5 images often showed marked bilateral decreases in signal intensity in the frontal and temporoparietal lobes, even for patients with AD-induced MCI, but these findings were mostly not present in the PLD2.5 images (case 3, Fig 5). A previous study using PLD1.5 for patients with cerebrovascular disease reported a low ASL signal with surrounding cortical areas showing a high signal intensity in the middle cerebral artery–anterior cerebral artery and middle cerebral artery–posterior cerebral artery borderzones. This phenomenon was termed the “borderzone sign”.17 Another recent study evaluated the performance of PLD1.5 compared with SPECT in patients with AD and reported that PLD1.5 images frequently showed the borderzone sign.18 Our results suggest the presence of the borderzone sign for PLD1.5, but not PLD2.5. The presence of the borderzone sign in ASL-MR images with a short PLD, but not in those with a long PLD, could have been due to an early perfusion adjacent to the main cerebral arteries. In fact, our PLD2.5 images did not frequently show such a broad decrease in CBF, and neither did the SPECT images.
In the present study, the PLD2.5 images frequently showed only minor pathologic findings with a low image contrast. Generally, a long PLD decreases the signal-to-noise ratio because of T1 relaxation. Thus, we doubled the number of excitations for PLD2.5 compared with PLD1.5; however, a greater number of excitations or the modification of some other parameter might be necessary to improve image contrast and quality.
A previous study comparing PET using FDG and ASL-MR imaging using PLD1.5 in patients with AD19 reported that both methods showed similar regional abnormalities and have comparable diagnostic accuracy in AD. The PLD1.5 images of this previous study were different from ours, which did not show decreased CBF in the frontal lobes. The findings of this previous study also contradict those in another study that reported decreased CBF in the frontal lobes of patients with AD.20 Another study performed multidelay multiparametric ASL for patients with stroke; however, their PLD1.5 images did not show decreased CBF in the frontal lobes but resembled those of PLD2.5 images.21 Such conflicting results between these studies may be due to scanner differences, parameters other than PLD, or other experimental differences.
There is a strong link between brain metabolism and CBF.22 Thus, SPECT images have been generally interpreted in a manner similar to that of FDG-PET. However, as our results show, ASL-MR images can change depending on the PLD and show significantly different findings from SPECT. The use of FDG criteria for ASL-MR imaging diagnosis of AD increases the risk of over- or underdiagnosis. Further studies will be needed to establish the optimal conditions for ASL-MR imaging in the diagnosis of AD and to define the dynamic temporal patterns of ASL-MR images associated with the development of AD.
Regarding the differentiation of AD and AD-induced MCI, we did not observe significant differences in total scores of the 3 modalities between the AD and AD-induced MCI groups. The positive rates for AD diagnosis for the AD group were slightly higher than those for the AD-induced MCI group; however, the differences were small. Further studies are required to clarify the usefulness of ASL for the discrimination of AD and AD-induced MCI.
The interrater agreements were low in the present study, even for the 2-alternative scoring method. The participants in our study had relatively high MMSE scores. Only 1 participant had an MMSE score of <10, and 5 of the participants had scores of <15, which could have resulted in a low interrater agreement.
The present study has several limitations. First, the sample size was small; a larger sample would produce more reliable results. Second, we did not perform MR angiography due to tight time constraints. Third, no images of cognitively healthy participants were used as controls; thus, we could not evaluate the accuracy of the visual-based diagnosis. Finally, an optimal PLD could not be determined in the present study. These limitations should be considered for future research.
Conclusions
Significant differences in visual assessments were observed for PLD1.5, PLD2.5, and SPECT images. PLD1.5 images showed a robust decrease in CBF, which could have been due to an early perfusion. In contrast, PLD2.5 did not appear to be influenced by an early perfusion but showed fewer pathologic findings than SPECT. Visual assessment of AD should be performed with attention to these distinctions. Further studies are required to define the dynamic temporal ASL-MR imaging pattern associated with AD.
Acknowledgments
We thank Mr. Yuki Koyo for his assistance with data collection and analyses, Dr. Ayako Hino for reading images, and Mr. Naoki Hirata for his advice on the processing of ASL-MR imaging.
Footnotes
We declare that all human and animal studies have been approved by the institutional review board of Yokohama City University School of Medicine and have therefore been performed in accordance with the ethical standards laid down in the 1964 Declaration of Helsinki and its later amendments. We declare that all patients gave informed consent prior to inclusion in this study.
REFERENCES
- Received September 15, 2016.
- Accepted after revision March 24, 2017.
- © 2017 by American Journal of Neuroradiology


Jump to section
Related Articles
Cited By...
- No citing articles found.