
Abstract
BACKGROUND AND PURPOSE: Although most neuroimaging examinations are interpreted by radiologists, many nonradiologists provide interpretation services. We studied day of the week, site of service, and patient complexity differences for common Medicare MR neuroimaging examinations interpreted by radiologists versus nonradiologists.
MATERIALS AND METHODS: Using carrier claims files for a 5% sample of Medicare beneficiaries from 2012 to 2014, we identified all claims for brain and lumbar spine MR imaging examinations. Services were categorized by physician specialty, day of the week, and the site of service. Patient complexity was calculated using Charlson Comorbidity Indices. The χ2 was performed to test statistical significance.
RESULTS: A provider specialty could be identified for 568,423 brain and lumbar spine MR imaging examinations. Of weekday examinations, radiologists interpreted 475,288 (92.3%), and nonradiologists, 39,510 (7.7%). Of weekend examinations, radiologists interpreted 52,028 (97.0%) and nonradiologists 1597 (3.0%). Radiologists interpreted 145,904 (98.7%) examinations in the inpatient hospital and emergency department settings versus 1882 (1.3%) by nonradiologists. Of all examinations, 44,547 of those interpreted by radiologists (8.4%) were on the most clinically complex patients versus 2139 (5.2%) for nonradiologists. All interspecialty differences for day of the week, the site of service, and patient complexity were statistically significant (P < .001).
CONCLUSIONS: Although radiologists interpret most common MR neuroimaging examinations for Medicare beneficiaries, in contrast to nonradiologists, they disproportionately render those services on weekends, in higher acuity sites, and on more complex patients. To optimize access and minimize disparities in necessary neuroimaging, quality metrics should consider such service characteristics.
ABBREVIATION:
- CCI
- Charlson Comorbidity Index
Although radiologists interpret most neuroimaging examinations in the United States, a small-but-increasing proportion of those studies are interpreted by nonradiologists—most notably by neurologists, neurosurgeons, and orthopedic surgeons.1⇓⇓⇓⇓⇓⇓⇓⇓–10 Writing about the changing provider marketplace in which imaging services are interpreted, Levin et al10 noted an increasing proportion of in-office imaging being performed by nonradiologists; all the while, radiologists continued to render interpretations in increasing volumes for more acutely ill hospital inpatients and patients in the emergency department. Anecdotally, others have similarly lamented that nonradiologists disproportionately render imaging services during daytime hours and on weekdays, leaving after-hours and weekend work for their radiologist counterparts.11 Recent work supports this anecdote, at least with regard to lower extremity venous duplex examinations.12
Although a large body of literature exists comparing the market share of interpretation by radiologists versus nonradiologists for a variety of diagnostic and interventional radiology services, little work, to date, has focused on how those specialty differences vary by time and location.13⇓⇓–16 Recent work suggests that emerging pay-for-performance models could unintentionally compromise patient access, particularly in areas where different specialty groups render similar services.17 Further investigation into potential specialist variation—and the drivers thereof—could potentially help inform policy initiatives to ensure consistent and equitable access of all patients to high-quality services, regardless of time, date, geography, or patient complexity.
Focusing on common MR neuroimaging examinations, the purpose of this study was to compare differences in the frequency of interpretations by radiologists versus nonradiologists as a function of the day of the week (weekday versus weekend), the site of service, and patient complexity.
Materials and Methods
Our retrospective use of Medicare administrative claims data was performed under an exemption from the institutional review board of the American College of Radiology.
Under a Data Use Agreement from the Centers for Medicare and Medicaid Services, we acquired carrier claims patient-level 5% Medicare Research Identifiable Files for 2011 through 2014. These datasets contain details associated with all fee-for-service claims for a 5% national sample of Medicare enrollees, representing approximately 2.5 million beneficiaries each year. Specifically included in the dataset is information about patient demographics (eg, age, sex), Current Procedural Terminology codes, and International Classification of Diseases codes associated with all services, as well as the date, site, and rendering provider of each service.18
All professional and global billed claims for brain MR imaging (Current Procedural Terminology codes 70551, 70552, and 70553) and lumbar spine MR imaging (Current Procedural Terminology codes 72148, 72149, and 72158) services were initially identified. For each claim, the date of interpretation as attested by the billing physician was mapped to a specific day of week (eg, Sunday, Monday). Using previously described methods for Medicare claims–based analyses, we then mapped provider specialty and the site of service using the respective identification codes.14,16,19⇓⇓–22 Radiologists were collectively identified using provider specialty codes for diagnostic radiology (n = 30), nuclear medicine (n = 36), and interventional radiology (n = 94). Some provider specialties could not be determined (eg, those billing using generic multispecialty clinic codes), and these were grouped into an “undetermined specialty” category. All other specialty codes were mapped to a “nonradiologist” category. Similarly, the site of service codes were used to map services to the private office (n = 11), inpatient hospital (n = 21), outpatient hospital (n = 22), and hospital emergency department (n = 23) settings. All far less frequent sites of service were grouped together.
Charlson Comorbidity Index (CCI) scoring is widely used in the health services research literature as a surrogate for patient complexity and is calculated by combining specific International Classification of Diseases–attributable diagnoses from the patient's medical history from the prior year.23,24 Higher scores indicate higher mortality risk (eg, a score of zero indicates no comorbid diagnoses for services during the previous year). Using each beneficiary's claims data for a single year before each MR imaging claim (ie, 2011 through 2013), we calculated Charlson Comorbidity Index scores. These scores were grouped into 0, 1, 2, or 3+ (the latter to account for the relatively small number of patients with CCI values of >3 in our cohort).
We next compiled descriptive statistics for both brain and lumbar spine MR imaging services by specialty group in relation to the day of the week, the site of service, and the CCI. χ2 testing was used to assess statistical significance. Because the first year of our data was required for calculation of CCI for subsequent years, these analyses span 2012–2014.
All analyses were performed using SAS, Version 9.3 for Windows (SAS Institute, Cary, North Carolina). Statistical tests were 2-sided with an α level of .05.
Results
A total of 345,880 brain MR imaging examinations were identified within the Medicare Research Identifiable Files national 5% cohort between 2012 and 2014. Of these, 308,728 (89.3%) were interpreted by radiologists, 14,569 (4.2%) were interpreted by nonradiologists, and 22,583 (6.5%) were interpreted by providers whose specialties could not be identified. The former 2 groups formed the basis of our brain MR imaging analysis.
A total of 279,073 lumbar spine MR imaging examinations were identified within our cohort. Of these, 218,588 (78.3%) were interpreted by radiologists, 26,538 (9.5%) were interpreted by nonradiologists, and 33,947 (12.2%) were interpreted by providers whose specialties could not be identified. The former 2 groups compose the basis of our lumbar spine MR imaging analysis.
When we considered brain and lumbar spine MR neuroimaging examinations together, radiologists interpreted 527,316 (84.4%) examinations and nonradiologists interpreted 41,107 (6.6%) examinations. There were 56,530 (9.0%) examinations for which a provider specialty could not be determined. Patients undergoing one or both of these services by a provider with an identifiable specialty composed our study cohort. Summary results are outlined in the Table.
Summary of differences in volumes of MR neuroimaging examinations interpreted by radiologists versus nonradiologists in a 5% national Medicare sample
Interpreting Provider by Day of Week
Of the 323,297 brain MR imaging examinations that could be attributed to unique provider specialties, 286,052 (88.5%) were performed on a weekday, and 37,245 (11.5%) on a weekend. Of brain MR imaging performed on weekdays, radiologists interpreted 272,282 (95.2%), while nonradiologists interpreted 13,770 (4.8%). For brain MR imaging performed on weekends, these proportions shifted to 36,446 (97.9%) by radiologists and 799 (2.1%) by nonradiologists (Fig 1A).
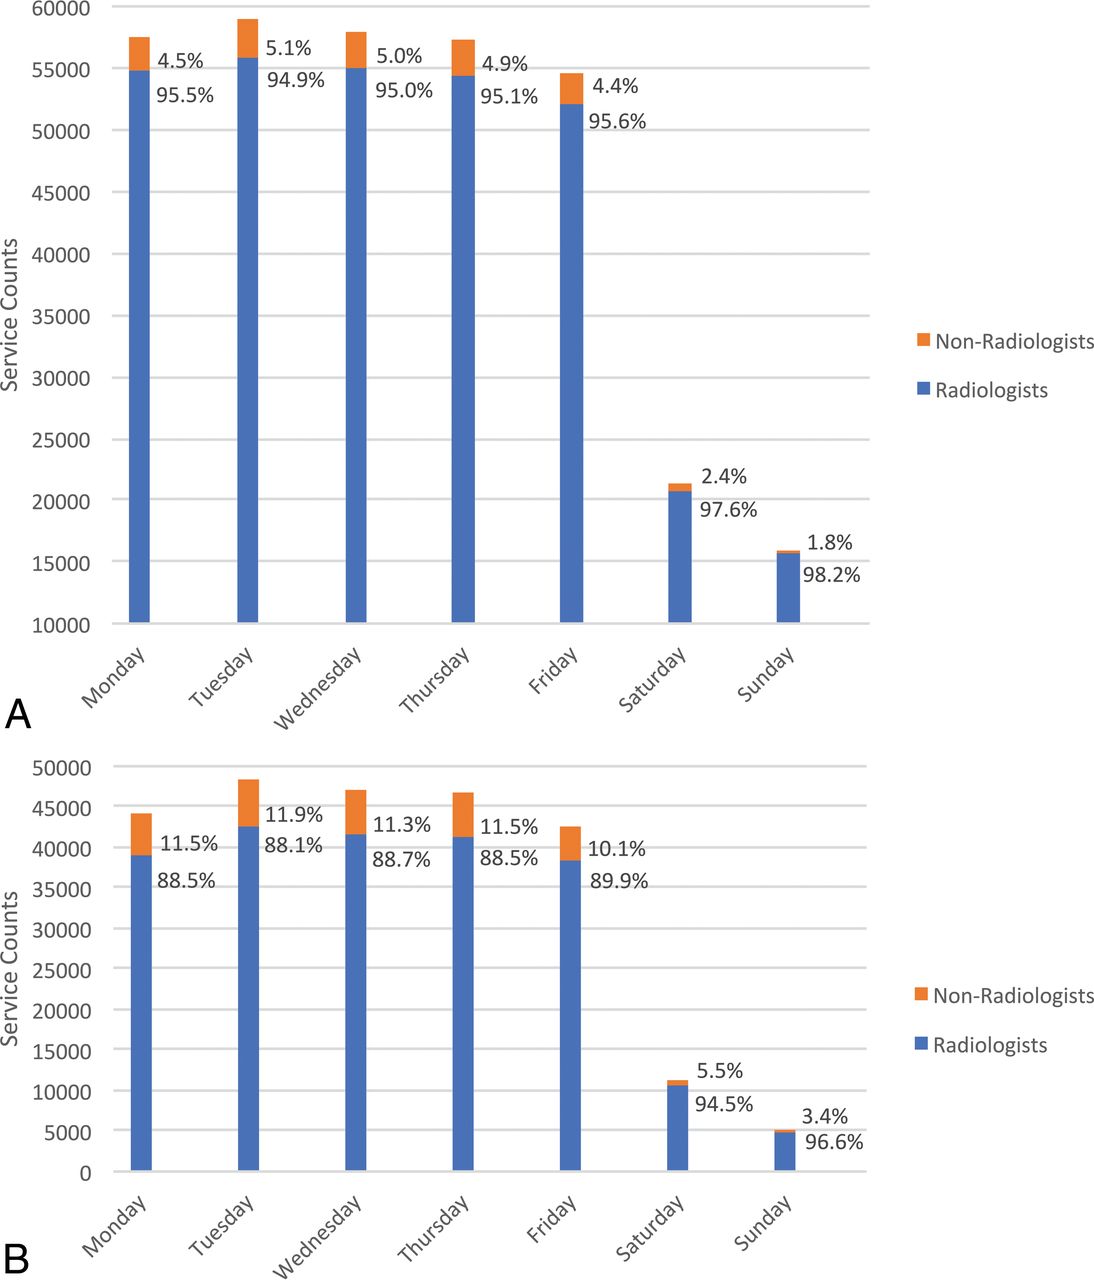
Breakdown of service counts by radiologists versus nonradiologists as billing providers in a 5% national sample of Medicare fee-for-service beneficiaries from 2012 through 2014 by day of week for brain MR imaging (A) and lumbar spine MR imaging (B) examinations.
Of the 245,126 lumbar spine MR imaging examinations that could be attributed to unique provider specialties, 228,746 (93.3%) were performed on a weekday, and 16,380 (6.7%) on a weekend. Of lumbar spine MR imaging performed on weekdays, radiologists interpreted 203,006 (88.7%), while nonradiologists interpreted 25,740 (11.3%). For lumbar spine MR imaging performed on weekends, these proportions shifted to 15,582 (95.1%) by radiologists and 798 (4.9%) by nonradiologists (Fig 1B).
In total, for studies performed during the week, radiologists interpreted 475,288 (92.3%) and nonradiologists 39,510 (7.7%). Of weekend examinations, radiologists interpreted 52,028 (97.0%) and nonradiologists 1597 (3.0%). All of these differences were statistically significant (P < .001).
Interpreting Provider by Site of Service
Radiologists interpreted 98.4% (16,088) of all brain MR imaging examinations performed in the emergency department setting, 98.7% (105,145) of those performed in the inpatient setting, and 98.8% (119,920) of those performed in the outpatient hospital setting. Nonradiologists, in contrast, interpreted <2% of brain MR imaging examinations performed in any of these sites of service; they interpreted 1.6% (265) of studies performed in the emergency department setting, 1.3% (1395) in the inpatient setting, and 1.2% (1432) in the outpatient hospital setting. Conversely, nonradiologists interpreted 14.6% (11,447) of the brain MR imaging in the office setting. Those services rendered in private offices comprised 78.7% of all brain MR imaging interpreted by nonradiologists. The percentages of services by specialty group and sites of service are outlined in Fig 2A.

Breakdown of service counts by radiologists versus nonradiologists as billing providers in a 5% national sample of Medicare fee-for-service beneficiaries from 2012 through 2014 by site of service for brain MR imaging (A) and lumbar spine MR imaging (B) examinations.
Radiologists similarly interpreted 99.3% (5305) of all lumbar spine MR imaging examinations performed in the emergency department setting, 99.1% (19,366) of those performed in the inpatient setting, and 99.3% (107,135) of those performed in the outpatient hospital setting. Nonradiologists, in contrast, interpreted <1% of lumbar spine MR imaging examinations performed in any of these sites of service: they interpreted 0.7% (38) of studies performed in the emergency department, 0.9% (184) in the inpatient setting, and 0.7% (748) in the outpatient hospital setting. Conversely, nonradiologists interpreted 22.9% (25,443) of the lumbar spine MR imaging in the office setting. Those services rendered in private offices comprised 96.3% of all lumbar spine MR imaging interpreted by nonradiologists. The percentages of services by specialty group and sites of service are outlined in Fig 2B.
In total, radiologists interpreted 145,904 (98.7%) examinations in the inpatient hospital and emergency department setting versus 1882 (1.3%) for nonradiologists. In contrast, nonradiologists interpreted 19.5% of examinations in the office setting versus 80.5% for radiologists. All of these differences were statistically significant (P < .001).
Interpreting Provider by Patient Comorbidities
We found statistically significant differences (P < .001) in the overall complexity of patients for whom brain MR imaging examinations were interpreted by radiologists versus nonradiologists. Specifically, 79.0% of patients whose brain MR imaging was interpreted by radiologists had a CCI of 0 (indicating an absence of any of the indexed comorbidities) versus 83.1% for nonradiologists. Conversely, 11.0% of patients whose brain MR imaging was interpreted by radiologists had a CCI of ≥3 versus 7.2% for nonradiologists. The results within each CCI subset were statistically significant as well (P < .001). Overall, the mean CCI was 0.67 for brain MR imaging interpretation services rendered by radiologists and 0.48 for those rendered by nonradiologists (P < .001). Comorbidity differences by specialty provider group are outlined in Fig 3A.

Breakdown of service counts by radiologists versus nonradiologists as billing providers in a 5% national sample of Medicare fee-for-service beneficiaries from 2012 through 2014 by patient complexity for brain MR imaging (A) and lumbar spine MR imaging (B) examinations.
Similarly, we found statistically significant differences (P < .001) in the overall complexity of patients whose lumbar spine MR imaging was interpreted by radiologists versus nonradiologists. Specifically, 83.3% of patients whose lumbar spine MR imaging was interpreted by radiologists had a CCI of 0 versus 85.6% for nonradiologists. Conversely, 7.1% of patients whose lumbar MR imaging was interpreted by radiologists had a CCI of ≥3 versus 5.1% for nonradiologists. The results within each CCI subset were statistically significant as well (P < .001). Overall, the mean CCI was 0.46 for lumbar MR imaging interpretation services rendered by radiologists and 0.36 for those rendered by nonradiologists (P < .001). Comorbidity differences by specialty provider group are outlined in Fig 3B.
In total, radiologists and nonradiologists rendered interpretations for a similar percentage of low-acuity patients with 80.8% of brain and lumbar spine MR imaging interpreted by radiologists performed on patients with a CCI of 0 versus 84.7% for nonradiologists. Of examinations interpreted by radiologists, 44,547 (8.4%) were for patients with a CCI of ≥3 versus 2139 (5.2%) by nonradiologists. All of these differences were statistically significant (P < .001).
Discussion
Using individual claims data for a representative national sample of >2 million Medicare beneficiaries, we confirmed prior aggregate data-based observations that radiologists interpret most brain and lumbar MR imaging examinations in Medicare beneficiaries.5 The additional encounter-level nature of our analysis, however, allowed us to confirm temporal, location, and patient complexity differences in the services rendered by radiologists versus nonradiologists. Indeed, we found that radiologists disproportionately provide services to Medicare beneficiaries at less opportune times, in higher acuity settings, and on more complex patients compared with nonradiologists. Our observations regarding common MR neuroimaging studies comport closely with those reported recently by Prabhakar et al12 concerning lower extremity venous duplex examinations interpreted by radiologists versus nonradiologists.
The proportion of both brain MR imaging and lumbar spine MR imaging examinations interpreted by radiologists increased from weekdays to weekends (from 95.2% to 97.9% and 88.7% to 95.1%, respectively). As a result, there was a corresponding >50% relative decrease in the proportion of brain MR imaging (from 4.8% to 2.1%) and lumbar spine MR imaging (from 11.3% to 4.9%) interpreted by nonradiologists on weekends relative to weekdays. As our society continues to prioritize patient access as a health care reform imperative, radiologists appear to demonstrate value by providing services at less opportune times to individuals who fall ill on weekends or who may not be able to take time off work to seek elective imaging.10,11
Correspondingly, our results demonstrate that radiologists interpret the greatest share of brain and lumbar spine MR imaging examinations performed in 24/7/365 environments such as the hospital inpatient and emergency department settings, which are generally associated with a higher acuity of care. In contrast, most brain and lumbar spine MR imaging examinations interpreted by nonradiologists were performed in comparably lower acuity private office settings. Of note, the office environment was the only setting in which nonradiologists interpreted >2% of brain MR imaging or >1% of lumbar spine MR imaging. Although our dataset does not permit us to identify specific times of service (claims are only dated but not timed), the round-the-clock nature of the inpatient hospital and emergency department settings strongly suggests that radiologists likely provide a disproportionate fraction of services during late evening and overnight hours as well.
Although claims data do not permit us to definitively assert explanations for our observations, it is possible that self-referral plays a role in the disproportionate number of studies interpreted by nonradiologists in the office setting. Patients seen in the clinic environment by neurologists, neurosurgeons, or orthopedic surgeons have been shown more likely to be referred to the in-office imaging centers managed by themselves or their partners.25,26 This phenomenon could compound the effect that such office practices have on the overall proportion of in-office imaging examinations, but our analysis of administrative claims data does not permit us to assert causation—or even association.
Similar to differences in the day of week and site of services, our work highlights another area in which aggregate claims–based “turf battle” articles do not tell the entire story: patient complexity.5 When we compared the most complex patients (CCI of 3+) in Medicare with the least complex (CCI of 0), there was a 37% relative reduction in the interpretations provided by nonradiologists for brain MR imaging and a 27% relative reduction for lumbar spine MR imaging. Correspondingly, we found that as patient complexity increased, the proportion of examinations interpreted by radiologists increased. At present, Medicare Physician Fee Schedule rates are patient-complexity neutral (eg, pay for brain MR imaging is the same regardless of whether a patient presents with uncomplicated headache or follow-up for a tumor after surgery and radiation). Our findings suggest that as our society moves increasingly to value-based payments, complexity adjustments may be appropriate to ensure appropriate incentives for providers caring for our most vulnerable patients.
Our analysis, based on Medicare claims, has several limitations. First, our findings may not necessarily be generalizable to patients with commercial insurance or even to Medicare beneficiaries undergoing other types of imaging studies. Second, we acknowledge that we were unable to identify the time of day for individual services (eg, MR imaging performed at 1 am versus 1 pm is indistinguishable in claims data). However, the drastically increased proportion of examinations interpreted by radiologists in round-the-clock environments suggests that specialty differences also exist after hours during the week as well. Additionally, the exclusion of examinations with non-specialty-specific provider codes (eg, a generic multispecialty clinic designation) precluded our ability to identify a provider specialty for 9.0% of relevant MR neuroimaging examinations. It is conceivable, though we believe unlikely, that this exclusion would introduce bias into our reported results. Finally, the nature of claims data prevented us from making any assessments on the quality of interpretations. Such an analysis would require institutional-level data.
Conclusions
Radiologists interpret most brain and lumbar spine MR imaging examinations performed on Medicare patients. Although some nonradiologists provide interpretation services as well, their work is disproportionately rendered on weekdays, in private office settings, and for less complex patients. Given that radiologists render the overwhelming majority of services on weekends, in sites of higher patient acuity, and to more complex patients, emerging quality metrics should consider such service characteristics to optimize equitable patient access to neuroimaging services.
Footnotes
Previously presented as an abstact at: Annual Meeting of the American Roentgen Ray Society, April 30 to May 5, 2017; New Orleans, Louisiana.
References
- Received May 30, 2018.
- Accepted after revision July 25, 2018.
- © 2018 by American Journal of Neuroradiology


Jump to section
Related Articles
Cited By...
- No citing articles found.