
Abstract
BACKGROUND AND PURPOSE: It is unclear to what extent subcortical gray matter atrophy is a primary process as opposed to a result of focal white matter damage. Correlations between WM damage and atrophy of subcortical gray matter have been observed but may be partly attributable to indirect relationships between co-occurring processes arising from a common cause. Our aim was to cross-sectionally and longitudinally characterize the unique impact of focal WM damage on the atrophy of connected subcortical gray matter regions, beyond what is explainable by global disease progression.
MATERIALS AND METHODS: One hundred seventy-six individuals with MS and 47 healthy controls underwent MR imaging at baseline and 5 years later. Atrophy and lesion-based disruption of connected WM tracts were evaluated for 14 subcortical gray matter regions. Hierarchic regressions were applied, predicting regional atrophy from focal WM disruption, controlling for age, sex, disease duration, whole-brain volume, and T2-lesion volume.
RESULTS: When we controlled for whole-brain volume and T2-lesion volume, WM tract disruption explained little additional variance of subcortical gray matter atrophy and was a significant predictor for only 3 of 14 regions cross-sectionally (ΔR2 = 0.004) and 5 regions longitudinally (ΔR2 = 0.016). WM tract disruption was a significant predictor for even fewer regions when correcting for multiple comparisons.
CONCLUSIONS: WM tract disruption accounts for a small percentage of atrophy in connected subcortical gray matter when controlling for overall disease burden and is not the primary driver in most cases.
ABBREVIATIONS:
- HC
- healthy controls
- NeMo
- Network Modification
- SGM
- subcortical gray matter
- T2LV
- T2-lesion volume
- WBV
- whole-brain volume
It has recently become clear that gray matter pathology is a critical component of MS, relating strongly to both disability and cognition.1 In particular, atrophy of subcortical GM (SGM) occurs from early phases of the disease2 and continues throughout.3 Despite its importance, the precise cause of SGM atrophy has not been fully established. On one hand, direct mechanisms for GM atrophy, GM lesions, microglial activation, and lymphocyte infiltration have been observed.1,4,5 On the other hand, it has also been proposed that GM atrophy in MS results from anterograde and retrograde cell death due to new white matter lesions in tracts extending to connected GM.6,7 In support of the second hypothesis, such anterograde and retrograde cell death has been observed in postmortem biopsies and various biologic mechanisms are thought to contribute.8,9 Additionally, spatial relationships between WM damage and GM atrophy have been observed cross-sectionally in MS with T1-lesion probability maps, T2-lesion probability maps, and DTI.6,10⇓⇓–13
These studies established a clear association between WM damage and SGM atrophy, but it remains unclear to what extent this relationship is directly causal as opposed to both proceeding independently from a common cause (Fig 1). WM damage and atrophy would still be highly correlated even if they progressed separately but at an overall pace determined by shared underlying disease factors. It is therefore important to somehow control for overall disease burden when assessing these relationships. Unfortunately, the best indicators of overall disease burden are likely atrophy and lesion accrual themselves. However, if there is a true causal relationship, then the specific location of lesions should have direct influence on the specific location of SGM atrophy. SGM regions with greater lesion burden in connected WM tracts would be expected to have greater atrophy, even after controlling for whole-brain atrophy and total lesion volume.

If WM damage in connected tracts is a primary driver of local SGM atrophy, then pathology represented by (C) ought to explain local SGM atrophy, beyond what is otherwise predicted by whole-brain atrophy and overall lesion growth (A and B) alone. On the other hand, if SGM atrophy largely progresses from independent pathology, we would still expect it to be correlated with overall lesion growth due to shared underlying overall disease activity (via A and B) but we would not expect (C) to explain any additional variance in atrophy. We therefore controlled for overall progression of disease-related pathology (A and B) in our analysis to determine the independent contribution of (C).
In addition, longitudinal rather than cross-sectional investigation can better elucidate the temporal relationship between WM damage and SGM atrophy. Although most previous analyses have been cross-sectional, the relationship has been observed longitudinally in a few studies.10,14 However, these analyses did not control for overall disease burden or for specific connections affected by localized WM damage. Therefore, our understanding of atrophy and lesion accrual might be improved by longitudinal analysis with reference to precise lesion location while controlling for whole-brain atrophy and total lesion burden.
Therefore, we aimed to characterize the extent to which new lesions in connected WM tracts contribute to atrophy of specific SGM regions across 5 years. We additionally replicated cross-sectional findings.6,13 We applied the Network Modification (NeMo) tool,15 to quantify tract-based disruptions caused by new focal WM lesions while avoiding the issues associated with tractography through lesions.16 For this work, we chose to use the word “disruption” rather than “disconnection” to refer to this lesion-based WM tract damage because WM tract streamlines that pass through lesions may not necessarily be fully disconnected. We also quantified global atrophy and lesion burden to control for overall MR imaging–visible disease progression in our analyses, to determine the extent to which new focal WM damage contributes to SGM atrophy beyond what would be observed as a result of indirectly related co-occurring processes arising from a common cause. We also performed an analysis to separately account for both T1WI and T2-FLAIR lesions.
Materials and Methods
Subjects
One hundred seventy-six individuals with MS or clinically isolated syndrome and 47 healthy controls (HC) were enrolled retrospectively from a larger 5-year longitudinal cardiovascular, environmental, and genetics study.17,18 All individuals diagnosed with clinically isolated syndrome at baseline converted to MS by follow-up 5 years later. Disease course and disease duration were determined by clinical assessments. Subjects were at least 18 years of age and free from a known history of additional neurologic diseases, psychiatric disorders, or substance abuse, and all met the safety criteria for MR imaging examination. The study was approved by the institutional ethics review board, and all subjects provided written informed consent.
MR Image Acquisition
MR imaging data were obtained at baseline and again at follow-up 5 years later. All MR imaging data described in the aforementioned analysis were available for each participant included in the study. These data were obtained on a 3T Signa Excite HD 12.0 TwinSpeed 8-channel scanner (GE Healthcare, Milwaukee, Wisconsin) and included structural 3D T1-weighted inversion recovery fast-spoiled gradient-recalled (voxel size = 1.0 × 1.0 × 1.5, TR = 5.9 ms, TE = 2.8 ms, TI = 900 ms) images and 2D T2-FLAIR images (voxel size = 1.0 × 1.0 × 3.0 mm, TR = 8500 ms, TE = 120 ms, TI = 2100 ms).
Image Processing and Analysis
T2-FLAIR and T1WI lesion masks were obtained using a previously described semiautomated edge-detection contouring/thresholding technique, and T2-lesion volume (T2LV) was quantified.19 MR imaging analysts were blinded to the subjects' physical and neurologic statuses. N4 bias field correction was applied to all images. High-resolution 3D T1-weighted images were preprocessed using a lesion-filling tool to minimize the impact of T1 hypointensities.20 SIENAX (http://fsl.fmrib.ox.ac.uk/fsl/fslwiki/SIENA) was then applied (Version 2.6) to calculate whole-brain volume (WBV).21 SGM volumes were assessed using the FMRIB Integrated Registration and Segmentation Tool (FIRST; http://fsl.fmrib.ox.ac.uk/fsl/fslwiki/FIRST) to segment the same images.22 SGM and whole-brain volumes were normalized using the SIENAX head-size scaling factor. Volumetric data were collected for the left and right thalamus, caudate, putamen, globus pallidus, hippocampus, amygdala, and accumbens. Two-time-point percentage volume change was calculated for each SGM region before use of these measures in longitudinal regression analysis. As well, 2-time-point percentage WBV change was estimated with SIENAX.23
Network Modification Tool
High-resolution T1WI was nonlinearly normalized into Montreal Neurological Institute space using Advanced Normalization Tools (https://sourceforge.net/projects/advants/).24 These transforms were applied to the corresponding lesion masks with nearest-neighbor interpolation. Aligned lesion masks were processed by means of NeMo, using methods that have been previously published.25 In short, the percentage disruption obtained for each SGM region is proportional, representing the percentage of normative data base–derived connected tract streamlines that pass through the given lesion mask and are therefore considered disrupted. The percentage disruption is determined probabilistically using control tractograms in the NeMo-provided normative data base. Additional details regarding NeMo are publicly available.15 This tool was applied to determine the percentage tract disruption caused by T2-FLAIR lesions as well as T1WI black hole lesions.
For the primary analyses, tract streamlines traveling through T2-FLAIR lesions were considered disrupted. For a secondary exploratory analysis, tract streamlines traveling through T1WI black hole lesions were considered disrupted, whereas tract streamlines traveling only through non-black hole T2-FLAIR lesions were considered half-disrupted. Although this weighting is arbitrary, we have chosen to consider this additional method of quantifying WM tract disruption because T1WI black hole lesions are likely to represent more severe neuropathology than lesions observed on T2 FLAIR alone.26 Our intention here was to determine whether lesional WM tract damage of greater severity has an increased impact on longitudinal GM atrophy.
The percentage WM tract disruption was evaluated for all SGM regions. Change in percentage disruption was calculated by subtracting baseline from follow-up values. This step resulted in an absolute change, in which a positive value indicated increased disruption caused by lesions.
Statistical Analysis
Independent-sample t tests and the Fisher exact test were applied to compare the MS group with HC regarding age, sex, and race (due to differential MS progression and incidence by race). We applied ANCOVAs, controlling for age and sex, to examine group differences in percentage atrophy of each SGM region under investigation. HC were used only for comparison of longitudinal atrophy (not for comparison of lesion-based tract disruption). One-sample t tests were used to determine whether the change in percentage tract disruption of connected WM was statistically significant for each SGM region. All longitudinal percentage changes were annualized before analysis.
To replicate results in previous cross-sectional studies,6,10⇓⇓–13 we applied preliminary hierarchic regressions to associate cross-sectional predictor variables with cross-sectional SGM volumes at follow-up for each SGM region under investigation. In model 1, age, sex, and disease duration were included as predictors. In model 2, we added percentage disruption of WM tracts connected to the SGM region while retaining variables from model 1.
Our central hypothesis was that increases in focal WM damage would predict increased SGM atrophy in connected regions, beyond what could be explained by a general progression of MS-related pathology if WM damage is a primary driver of SGM atrophy. To evaluate this cross-sectionally, we used hierarchic regressions to control for overall disease burden and to better elucidate specific interrelationships between focal WM damage and SGM atrophy beyond what would be expected if these were only indirectly related co-occurring processes arising from a common cause. In model 1, we predicted SGM region volume from T2LV, WBV, age, sex, and disease duration. Next, in model 2, we added disruption of connected WM tracts while retaining variables from model 1. In the case of a specific, locally causative relationship between connected WM damage and SGM atrophy, we would expect a significant increase in R2 when including this additional information in model 2.
Next, we extended this analysis longitudinally using similar hierarchic regressions with single derived percentage change outcome variables. In model 1, regional atrophy of >5 years was predicted using baseline age, sex, disease duration, change in T2LV (ΔT2LV), change in WBV (ΔWBV), and baseline disruption of WM tracts connected to the SGM region. Then, in model 2, longitudinal change in the disruption of connected WM tracts (Δ tract disruption) was also included, while retaining predictors from model 1. Because we would expect a causal relationship to be temporally related, if WM damage directly contributes to SGM atrophy, then we would expect new WM damage to explain a significant portion of new SGM atrophy across 5 years.
R2 values were adjusted for the number of predictors included in each model. Model fit and changes in R2 between models were considered significant on the basis of F tests at P < .05. T2LV and localized tract disruption data were cube-root-transformed for normality before analyses. These analyses were performed using tract-disruption data generated on the basis of T2-FLAIR lesions. To determine the value of more pathologically specific lesion assessment, we repeated the longitudinal hierarchic regression analysis using the combination T2-FLAIR and T1WI black hole approach described above.
All P values reported for the hierarchic regression models were corrected for multiple comparisons using the Holm-Bonferroni test correction.
Results
Study Participant Characteristics
At baseline, participants were 47.0 ± 11.2 years of age with a disease duration of 15.2 ± 9.9 years. One hundred thirty-eight (78.4%) were using disease-modifying therapies. Mean follow-up time was 5.5 ± 0.7 years. Subjects with MS did not significantly differ from HC regarding age, sex, or race (Table 1).
Demographic and clinical characteristics of study participants
Atrophy and WM Tract Disruption
The mean annualized ΔT2LV in subjects with MS was 0.58 ± 5.1 mL, and the percentage tract disruption increased significantly in 13 of 14 regions studied. The mean annualized whole-brain volume loss in our study participants with MS and HC was −0.61% ± 0.38% and −0.52% ± 0.05% (P = .11), respectively. Subjects with MS exhibited significantly greater atrophy for most SGM regions under investigation. Further information is provided in Table 2 and Fig 3.
Annualized atrophy and change in tract disruptiona
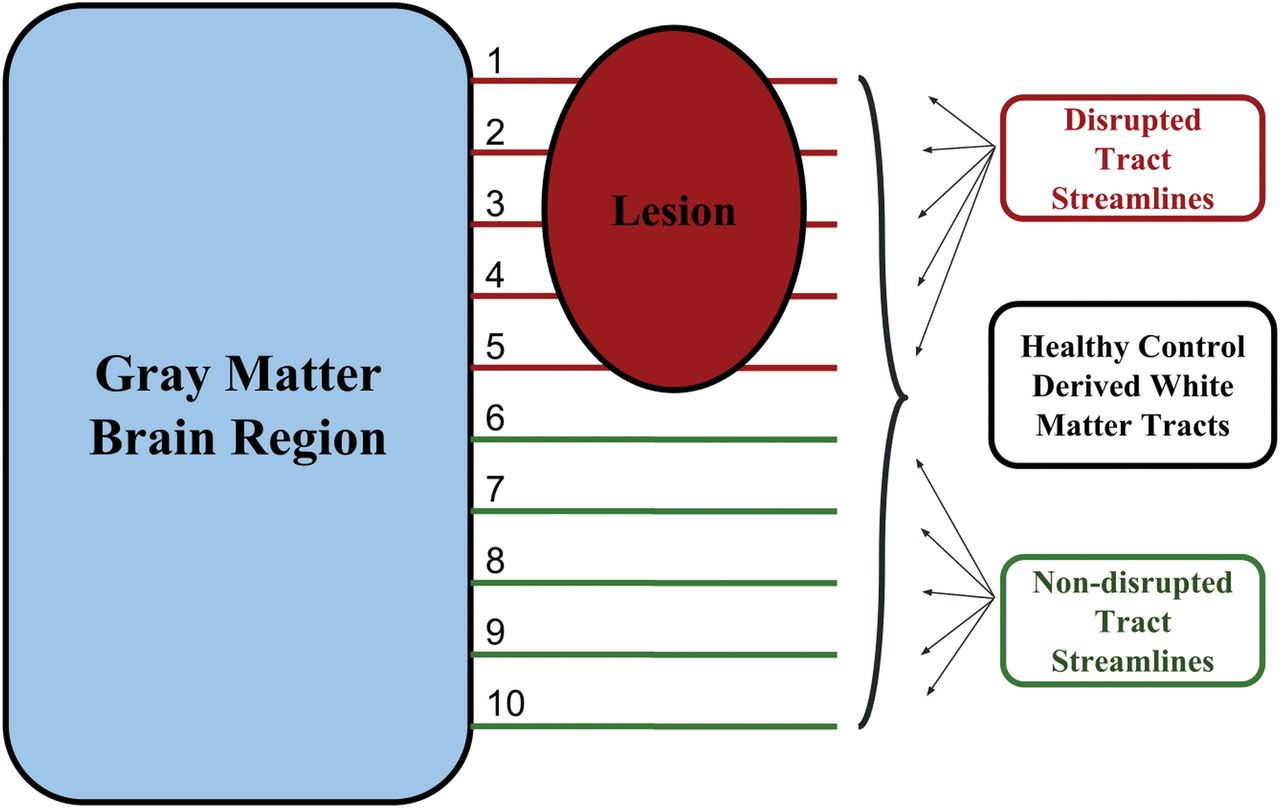
The Network Modification tool measures the proportion of disrupted WM tracts connected to a given GM region. An individual WM abnormality mask is referenced with respect to a data base of HC tractograms to probabilistically determine the proportion of connected tract streamlines that pass through a WM abnormality and are therefore considered disrupted.

Mean annualized atrophy (A) and change in WM tract disruption (B) for each SGM region across 5 years. Each sphere represents an SGM region. The size of each sphere is proportional to the magnitude of longitudinal atrophy and increased disruption of connected WM tracts.
Preliminary Analysis
The preliminary linear regression, model 1 (age, sex, and disease duration) was significant for 12 of 14 SGM regions included in our analyses (all regions except the left globus pallidus and right amygdala). When regional percentage tract disruption was added to the model, the explained variance increased significantly for 13 of 14 regions. This increased explained variance remained significant for 13 of 14 regions after controlling for multiple corrections. Average ΔR2 across all regions was 0.165. Detailed results are presented On-line Table 1.
Cross-Sectional Analysis Controlling for T2LV and WBV
In our primary cross-sectional analysis, T2LV and WBV were included in addition to age, sex, and disease duration in models 1 and 2. In contrast to the preliminary analysis, tract disruption explained significant additional variance for only 3 of 14 SGM regions when controlling for overall disease burden: left caudate, right amygdala, and left accumbens (On-line Table 2). This increased explained variance did not remain significant for any SGM region after controlling for multiple corrections. The average ΔR2 across all regions was 0.004.
Longitudinal Analysis Controlling for T2LV and WBV
The model 1 regression, predicting regional annualized SGM atrophy from age, sex, disease duration, ΔWBV, ΔT2LV, and baseline tract disruption, was significant for 13 of 14 regions (all regions except the right amygdala). In model 2, the addition of Δ tract disruption resulted in a significant increase in the total explained variance for 5 of 14 regions: left putamen, right putamen, left globus pallidus, right amygdala, and left accumbens. This increased explained variance remained significant for only 1 of 14 regions (right putamen) after controlling for multiple corrections. Average ΔR2 across all regions was 0.016. Detailed information regarding model R2 values is provided in Table 3.
Longitudinal analysis controlling for T2LV and WBVa
Separate Analysis of T2 FLAIR and T1WI Black Hole Lesions
In the supplementary longitudinal analysis based on both T2-FLAIR and T1WI black hole lesions, results were very similar to those observed in the models accounting for only T2-FLAIR lesions (average ΔR2 across all regions was 0.016). See On-line Table 3 for additional details.
Discussion
We aimed to characterize the extent to which focal WM damage in MS contributes to atrophy in connected SGM regions, beyond what would be expected as a result of indirectly related co-occurring processes arising from a common cause. Previous cross-sectional studies indicated a moderate correlation between WM damage and SGM volume, establishing a relationship between WM damage and GM atrophy.6,10⇓⇓–13 That relationship was also observed longitudinally. However, overall disease burden and the location of WM damage relative to GM were not accounted for in these longitudinal analyses.12,14 Our analyses, controlling for global disease burden and accounting for lesion location along connected WM tracts, builds on this previous work to explore the specific causal relationship between focal WM damage and SGM atrophy.
We have confirmed earlier cross-sectional findings. In our models predicting regional SGM volumes, disruption of connected WM tracts explained significant added variance for 13 of 14 regions. Thus, we consistently observed an association between the degree to which connected WM tracts were disrupted by T2-FLAIR lesions and regional SGM volume. However, in subsequent analysis controlling for overall disease burden, the relationship between focal WM damage and connected SGM volume was substantially blunted: A significant relationship remained for only 3 of 14 regions (left caudate, right amygdala, and left accumbens), and the additional variance explained was an order of magnitude smaller. This added explained variance was nonsignificant for all SGM regions after controlling for multiple comparisons. The location of lesions in MS is highly heterogeneous in general and in our current population. Therefore, if lesions in connected tracts were truly the principal driver of SGM atrophy, we would expect information about their specific location to provide substantial additional explanatory value beyond whole-brain lesion volume or atrophy. Therefore, we believe that although anterograde and retrograde degeneration does play an important role, the magnitude of associations commonly observed between WM disruptions and SGM atrophy may, in large part, reflect the progression of parallel but indirectly related pathology.
We then extended our analysis longitudinally to better characterize the temporal relationship between new focal WM damage and SGM atrophy in connected regions. We observed a significant correlation between Δ tract disruption and regional atrophy for only 5 of 14 regions (left putamen, right putamen, left globus pallidus, right amygdala, and left accumbens) when controlling for age, sex, disease duration, ΔWBV, and ΔT2LV. This increase in explained variance remained statistically significant for only 1 SGM region (right putamen) after controlling for multiple comparisons. Furthermore, the absolute changes in explanatory power that we observed were small, on average 1.6% of a total 11.2% explained variance. This total explained variance is in accordance with a previous study.14 This also suggests that although important, direct disruption of connected WM tracts is not necessarily the primary driver of SGM atrophy.
Although our findings show that the relationship varies among SGM regions, the effect of new focal WM damage on SGM atrophy is weaker and less consistent than we expected. For many SGM regions, it seems likely that other pathologic mechanisms are more important drivers of the SGM atrophy in MS. There are a number of reasons why GM atrophy may occur independent of WM damage. Both cortical and deep gray matter lesions have been extensively documented in MS and may have a direct impact on local tissue volume.1,10 Microglial activation has also been observed in cortical tissue and SGM and may contribute to direct pathology.1,4 In addition, GM atrophy may be caused by local B-cell infiltration—for example, leptomeningeal enhancement has been shown to be related to cortical atrophy.4,27 Finally, thalamic atrophy in MS has been shown to vary according to the distance from CSF and may arise from CSF-mediated immune cytotoxic factors.28
Participants in this study were evaluated at only 2 time points 5 years apart. The simultaneous analysis of new lesions and increased atrophy may not be the best for measuring this relationship if there is a lag between incident lesions and atrophy. In future studies, annual imaging following individual new lesion incidence would be better suited for understanding the exact timeline of the impact of WM tract disruption on the atrophy of connected GM regions. These analyses may also allow a better account of resolving lesions. However, we observed similar results in our cross-sectional analysis. Also notable is that WM tract disruption data used for this study were derived from lesion masks using NeMo rather than via direct diffusion tractography. This finding is advantageous to avoid the issue of invalid streamlines due to lesions but increases the reliance on normative data. In our analysis, we attempted to account for the degree of WM damage by weighting disruption caused by T1WI black hole lesions more strongly than disruption caused by T2-FLAIR lesions. Nonetheless, this weighting was partly arbitrary and resulted in only a coarse estimate of actual tract damage. Future studies might better quantify the degree of WM tract damage using local magnetization transfer ratio or DTI tissue metrics. Another potential limitation associated with the use of the NeMo tool is that the tractogram data base is derived from a population of HC who are younger than the cohort under investigation. This difference may bias results. However, the NeMo tool determines the level of WM tract disruption caused by lesions probabilistically by taking the mean effect across all 73 HC tractograms. We believe that this processing step, in addition to the co-registration of the tractograms to the Montreal Neurological Institute space, helps mitigate this potential bias.
Average disease duration at baseline for our study participants was long, >15 years. Although potentially a strength, it is possible that substantial atrophy may have already occurred in early-affected SGM. However, we found significant longitudinal changes in tract disruption and atrophy for nearly all SGM regions. Therefore, the observed lack of significant associations is unlikely due to waning progression of either factor.
Taken as a whole, the current study emphasizes the need for continued investigation of primary pathologic factors in GM in MS and lends further credence to the idea that GM atrophy is at least partially independent from WM lesions. Hence, it is likely that SGM atrophy should be considered independently in imaging assessments of disease progression or clinical trials.29
Conclusions
Focal WM damage in connected tracts explains only a small amount of unique additive variance in cross-sectional and longitudinal atrophy of some connected SGM regions. These findings point toward independent mechanisms related to SGM atrophy and support the use of SGM metrics as additional end points in clinical trials.
Footnotes
Disclosures: Ralph H.B. Benedict—UNRELATED: Consultancy: Novartis, Roche, Sanofi, Takeda Pharmaceutical Company; Grants/Grants Pending: Biogen, Mallinkrodt, Genzyme, Genentech*; Payment for Lectures Including Service on Speakers Bureaus: EMD Serono; Royalties: Psychological Assessment Resources. Bianca Weinstock-Guttman—UNRELATED: Board Membership: Biogen, TEVA Neuroscience, Novartis, Celgene, Sanofi Genzyme, EMD Serono; Consultancy: Biogen, TEVA Neuroscience, Novartis, Celgene, Sanofi Genzyme, EMD Serono; Grants/Grants Pending: Biogen, TEVA Neuroscience, EMD Serono*; Payment for Lectures Including Service on Speakers Bureaus: Biogen, TEVA Neuroscience, Genentech. Robert Zivadinov—UNRELATED: Consultancy: Celgene, Sanofi Genzyme, Novartis; Grants/Grants Pending: Celgene, Sanofi Genzyme, Novartis, IMS Health, Protembis*; Payment for Lectures Including Service on Speakers Bureaus: Sanofi Genzyme, Novartis, EMD Serono. Michael Dwyer—UNRELATED: Consultancy: Claret Medical, EMD Serono; Grants/Grants Pending: Novartis*. *Money paid to the institution.
References
- Received March 19, 2018.
- Accepted after revision May 18, 2018.
- © 2018 by American Journal of Neuroradiology


