
Abstract
BACKGROUND AND PURPOSE: Acidification of the tumor microenvironment from abnormal metabolism along with angiogenesis to meet metabolic demands are both hallmarks of malignant brain tumors; however, the interdependency of tumor acidity and vascularity has not been explored. Therefore, our aim was to investigate the association between pH-sensitive amine chemical exchange saturation transfer echoplanar imaging (CEST-EPI) and relative cerebral blood volume (CBV) measurements obtained from dynamic susceptibility contrast (DSC) perfusion MRI in patients with gliomas.
MATERIALS AND METHODS: In this retrospective study, 90 patients with histologically confirmed gliomas were scanned between 2015 and 2018 (median age, 50.3 years; male/female ratio = 59:31). pH-weighting was obtained using chemical exchange saturation transfer echo-planar imaging estimation of the magnetization transfer ratio asymmetry at 3 ppm, and CBV was estimated using DSC-MR imaging. The voxelwise correlation and patient-wise median value correlation between the magnetization transfer ratio asymmetry at 3 ppm and CBV within T2-hyperintense lesions and contrast-enhancing lesions were evaluated using the Pearson correlation analysis.
RESULTS: General colocalization of elevated perfusion and high acidity was observed in tumors, with local intratumor heterogeneity. For patient-wise analysis, median CBV and magnetization transfer ratio asymmetry at 3 ppm within T2-hyperintense lesions were significantly correlated (R = 0.3180, P = .002), but not in areas of contrast enhancement (P = .52). The positive correlation in T2-hyperintense lesions remained within high-grade gliomas (R = 0.4128, P = .001) and in isocitrate dehydrogenase wild-type gliomas (R = 0.4300, P = .002), but not in World Health Organization II or in isocitrate dehydrogenase mutant tumors. Both magnetization transfer ratio asymmetry at 3 ppm and the voxelwise correlation between magnetization transfer ratio asymmetry and CBV were higher in high-grade gliomas compared with low-grade gliomas in T2-hyperintense tumors (magnetization transfer ratio asymmetry, P = .02; Pearson correlation, P = .01). The same trend held when comparing isocitrate dehydrogenase wild-type gliomas and isocitrate dehydrogenase mutant gliomas (magnetization transfer ratio asymmetry, P = .04; Pearson correlation, P = .01).
CONCLUSIONS: A positive linear correlation between CBV and acidity in areas of T2-hyperintense, nonenhancing tumor, but not enhancing tumor, was observed across patients. Local heterogeneity was observed within individual tumors.
ABBREVIATIONS:
- CEST-EPI
- chemical exchange saturation transfer echo-planar imaging
- IDH
- isocitrate dehydrogenase
- IDHMUT
- IDH mutant
- IDHWT
- IDH wild-type
- LGG
- low-grade glioma
- HGG
- high-grade glioma
- MTRasym
- magnetization transfer ratio asymmetry
- SAGE
- spin and gradient-echo
- WHO
- World Health Organization
- MGMT
- O-6-methylguanine-DNA methyltransferase
Primary central nervous system tumors occur in approximately 21 per 100,000 population, with gliomas representing 27% of all primary brain tumors and 81% of malignant brain tumors.1 Five-year survival rates for patients diagnosed with gliomas range from 5.5% for glioblastoma to >80% in World Health Organization (WHO) grade II oligodendrogliomas,1 illustrating the wide disparity in survival depending on the level of malignancy and the need for noninvasive techniques for early delineation of malignant transformation.
Metabolic reprogramming is a critical characteristic of cancer. Tumor cells often inefficiently shunt glucose, glutamine, and other substrates down the glycolytic pathway, regardless of the presence of oxygen.2 This feature results in acidification of the tumor microenvironment through lactic acid accumulation and inefficient elimination of metabolic by-products3 at a rate proportional to the degree of aggressiveness4,5 and invasion.6,7 In addition to increased metabolic activity, tumor angiogenesis is critical for malignant transformation,8⇓–10 either through neovascularization or cooption of existing vasculature.11,12 As tumors grow larger and growth rates are accelerated by this increased vascularity, regions of the tumor can become hypoxic as metabolic demands outpace nutrient delivery.13 This decreased oxygen tension increases the acidity of interstitial space through carboxylic acid buildup and further increases the rate of lactic acid accumulation from glycolysis. Thus, we hypothesized that gliomas with a high degree of perfusion may also have a high level of acidity.
In the current study, we used a fast pH-weighted molecular MR imaging technique using amine chemical exchange saturation transfer echo-planar imaging (CEST-EPI)14 and compared it with DSC-perfusion MR imaging to examine the association between tumor acidity and vascularity in patients with histologically confirmed gliomas with various levels of malignancy.
Materials and Methods
Patients
A total of 90 histologically confirmed gliomas (WHO II, n = 24; WHO III, n = 26; WHO IV, n = 40) were included in this retrospective study at either initial diagnosis (n = 43), following an operation (n = 15), or during active treatment with radiation and/or chemotherapy (n = 32). All scans were obtained between April 2015 and August 2018. All patients provided informed, written consent to participate in advanced imaging and our research data base according to the guidelines approved by the institutional review board (University of California, Los Angeles), in compliance with the Health Insurance Portability and Accountability Act. All diagnoses were determined histopathologically after surgical resection or biopsy, according to the 2016 WHO classification of CNS tumors,15 by neuropathologists who were blinded to the MR imaging data. Isocitrate dehydrogenase 1 (IDH1 R132H) mutation status was available for all 90 patients (51 IDH mutant [IDHMUT]) and 39 IDH wild-type [IDHWT]) tumors), determined by genomic sequencing analysis using the polymerase chain reaction IDH1 mutation-detection kit and immunohistochemistry according to manufacturer's instructions. Briefly, tumor DNA was isolated from the frozen or formalin-fixed tissue using DNeasy Blood and Tissue Kit (Qiagen). A 236-bp fragment that included codon 132 was amplified using the primers 5′-GCGTCAAATGTGCCACTATC-3′ and 5′-GCAAAATCACATTATTGCCAAC-3′ to generate a 236 bp fragment. PCR products were sequenced by BigDye Terminator v1.1 (Applied Biosystems), and sequences were determined via a 3730 sequencer (Applied Biosystems). The O-6-methylguanine-DNA methyltransferase (MGMT) promoter methylation status, determined from formalin-fixed paraffin-embedded tissue samples, was available in 44 of 90 cases. Additional patient information is in the Table.
Patient demographics
Anatomic MR Imaging
In addition to CEST-EPI before contrast administration and DSC-perfusion MR imaging, all patients underwent anatomic imaging according to the international standardized brain tumor imaging protocol,16 including T2-weighted FLAIR images, T2-weighted turbo spin-echo images, and diffusion-weighted images with 3-mm slice thickness and no interslice gap, and parameter-matched, 1-mm isotropic 3D-T1-weighted MPRAGE scans before and following injection of 0.01 mg/kg of Gd-DTPA, and DSC-MR imaging. All anatomic images were registered to postcontrast T1-weighted images for subsequent analyses.
pH-Weighted Amine CEST-EPI
Amine CEST-EPI was obtained with either a single-echo CEST-EPI sequence14 or a multiecho CEST spin and gradient-echo (SAGE) EPI sequence17 using the 2 gradient echoes. MR imaging acquisition parameters included the following: FOV = 240–256 × 217–256 mm, matrix size = 128 × 116–128, slice thickness = 4 mm with no interslice gap, 25 consecutive slices, excitation pulse flip angle = 90°, TE = 27 ms for single-echo CEST-EPI and 14.0 and 34.1 ms for the 2 gradient-echoes using CEST-SAGE-EPI, bandwidth = 1628 Hz, and generalized autocalibrating partially parallel acquisition factor = 2–3. Off-resonance saturation was applied using a pulse train of 3 × 100 ms Gaussian pulses with a peak amplitude of 6 microtesla. A total of 29 off-resonance or z-spectral points were sampled at frequency offsets of −3.5 to −2.5 ppm, −0.3 to +0.3 ppm, and +2.5 to +3.5 ppm, all in increments of 0.1 ppm. A reference scan (S0) was obtained with the same acquisition parameters, without the saturation pulses. Total scan time for CEST-EPI was approximately 7 minutes 30 seconds, benchmarked on a 3T Magnetom Prisma MR imaging scanner (Versions VE11A–C; Siemens, Erlangen, Germany).
Clinical postprocessing of CEST-EPI consisted of affine motion correction (MCFLIRT; FSL, https://fsl.fmrib.ox.ac.uk/fsl/fslwiki/MCFLIRT) and B0 correction via a z-spectra-based K-means clustering and Lorentzian fitting algorithm.18 An integral of the width of 0.4 ppm was then obtained around both the −3.0 and +3.0 ppm (−3.2 to −2.8 and +2.8 to +3.2 ppm, respectively) spectral points of the inhomogeneity-corrected data. These data points were combined with the S0 image to calculate the asymmetry in the magnetization transfer ratio (MTRasym) at 3.0 ppm as defined by equation MTRasym(ω) =  , where ω is the offset frequency of interest (3.0 ppm). For data from the CEST-SAGE-EPI acquisition, the average MTRasym at 3.0 ppm calculated from the first (TE = 14.0 ms) and second (TE = 34.1 ms) gradient-echoes was averaged to increase the SNR of the resulting MTRasym images. All resulting maps were registered to high-resolution postcontrast T1-weighted images for subsequent analyses.
DSC-Perfusion MR Imaging
For DSC-MR imaging, a total dose of 0.1 mmol/kg of Gd-DTPA (Magnevist; Bayer HealthCare Pharmaceuticals, Wayne, New Jersey) was administered, 0.025 mmol/kg for the preload dosage to mitigate T1-based leakage contamination and the remaining 0.075 mmol/kg for dynamic bolus administration. A 2-minute gap was placed between the preload dose and the start of baseline DSC-MR imaging. DSC-MR imaging was acquired with a TE/TR = 21–23/1250–1293 ms, flip angle = 60°, matrix size = 128 × 128, slice thickness = 5 mm with no interslice gap, number of baseline acquisitions before contrast agent injection = 10–25, and number of timepoints = 120. The total scan time for DSC-MR imaging was approximately 1.5 minutes.
All DSC-MR imaging acquisitions completely covered the spatial extent of contrast-enhancing and nonenhancing tumors. Calculation of CBV was performed by first motion-correcting the dynamic time-series using FSL (MCFLIRT). Next, CBV maps were calculated using a bidirectional contrast agent leakage-correction algorithm to model contrast flux into and out of the vasculature. Last, normalized CBV was computed by dividing the CBV map by the average CBV value within a 5-mm sphere in contralateral, normal-appearing white matter. Last, final CBV maps were aligned to the corresponding postcontrast T1-weighted images for subsequent analyses.
Data Analysis and Statistics
In patients with high-grade gliomas, contrast-enhancing tumor ROIs, defined on contrast-enhancing T1-weighted subtraction maps, were segmented using a semiautomatic procedure as previously described,19 and the Analysis of Functional Neuro Images (AFNI; http://afni.nimh.nih.gov/) software. Additional, semiautomatically defined ROIs including T2-hyperintense lesions consistent with peritumoral edema and/or nonenhancing tumor, including contrast enhancement but not central necrosis, along with areas of obvious central necrosis, were also delineated and examined in all patients. Briefly, the semiautomatic segmentation procedure consists of the following: 1) manually defining the general region of lesion occurrence, 2) thresholding T2/FLAIR images or T1-weighted subtraction map images using an empiric threshold to best define the extent of abnormality, and then 3) manually editing the resulting masks to exclude any nontumor tissue. Two raters performed the segmentation independently and cross-checked each other's segmentation. A neuroradiologist with 13 years of clinical experience performed the final evaluation and minor corrections of ROIs.
In all ROIs, the median estimates of CBV and MTRasym at 3 ppm were calculated and used for subsequent analyses. For voxelwise correlation, the MTRasym at 3 ppm and CBV values of all voxels in different ROIs were analyzed using the Pearson correlation. For ROI-wise analysis, the linear correlation between the median MTRasym at 3 ppm and CBV values across all patients within different ROIs was analyzed using the Pearson correlation coefficient. We conducted the analysis in all patients and in subgroups of patients, including different treatment cohorts and across grades. Additionally, a nonparametric Kruskal-Wallis test and a Dunn test for multiple comparisons were used to compare pH- and perfusion-weighted MR imaging measurements and correlation coefficients across tumor grades. Normality was assessed using a Shapiro-Wilk test. A nonparametric Mann-Whitney U test was used to compare measurements within tumors on the basis of MGMT promoter methylation status and IDH mutation status. All statistical tests were performed using GraphPad Prism software, v6.0H (GraphPad Software, San Diego, California). Significance was set at P < .05.
Results
Correlation between CBV and MTRasym at 3 ppm
A total of 50 of 90 patients had contrast-enhancing lesions in the current study that could be evaluated. Although regions of elevated vascularity appear generally colocalized to areas of increased acidity, local intratumor heterogeneity is frequently observed (Fig 1). The observation is consistent with the finding that both CBV and MTRasym at 3 ppm are more elevated in contrast-enhancing regions (MTRasym median = 2.276%, CBV median = 1.910) compared with T2-hyperintense regions (MTRasym median = 1.667%, CBV median = 1.095; Mann-Whitney U test, P < .0001 for MTRasym, P < .0001 for CBV). When we examined the correlation between median CBV and MTRasym at 3 ppm across the entire patient cohort, no statistically significant linear association was observed in areas of contrast enhancement (Pearson correlation R = 0.0925, P = .5231). In areas of T2 hyperintensity, however, a statistically significant positive association was observed between median CBV and MTRasym at 3 ppm (Fig 2A; R = 0.3180, P = .0023), suggesting that patients with nonenhancing tumor demonstrating a high blood volume (possibly due to responsive vessel dilation, vessel cooption, or angiogenesis) may also have higher acidity. These same trends were observed when considering all patients not on active therapy (ie, pre- or postsurgery and before radiation and/or chemotherapy), with no correlation found between CBV and MTRasym at 3 ppm in contrast-enhancing tumor (R = 0.2097, P = .3369), but a significant correlation was seen within T2-hyperintense regions (On-line Fig 1A; R = 0.2875, P = .0287). For patients on active therapy, this significant correlation no longer existed (On-line Fig 1B; R = 0.2638, P = .1446), indicating a change of perfusion/metabolism pattern in these patients.

Postcontrast T1-weighted images, T2-weighted FLAIR images, CBV, and pH-weighted MR images of a 68-year-old male patient (A) with a recurrent IDHWT, MGMT-unmethylated anaplastic (WHO III) oligodendroglioma and a 68-year-old male patient (C) with a recurrent IDHWT, MGMT-unmethylated glioblastoma. Note the high vascularity and acidity within the areas of contrast enhancement and high acidity extending into the areas of T2 hyperintensity. B and D, The bivariate histogram of pH-weighted MTRasym and CBV of all voxels within the T2-hyperintense lesion and contrast-enhancing lesion of the corresponding patient. The lesion ROIs are outlined in red (contrast-enhancing lesion) and blue (T2-hyperintense lesion) in the MR images. In the patient in C, the white arrow indicates a nonenhancing part of the lesion, which demonstrates low CBV with elevated acidity, while the black arrow indicates an enhancing lesion with both high CBV and high MTRasym contrast.
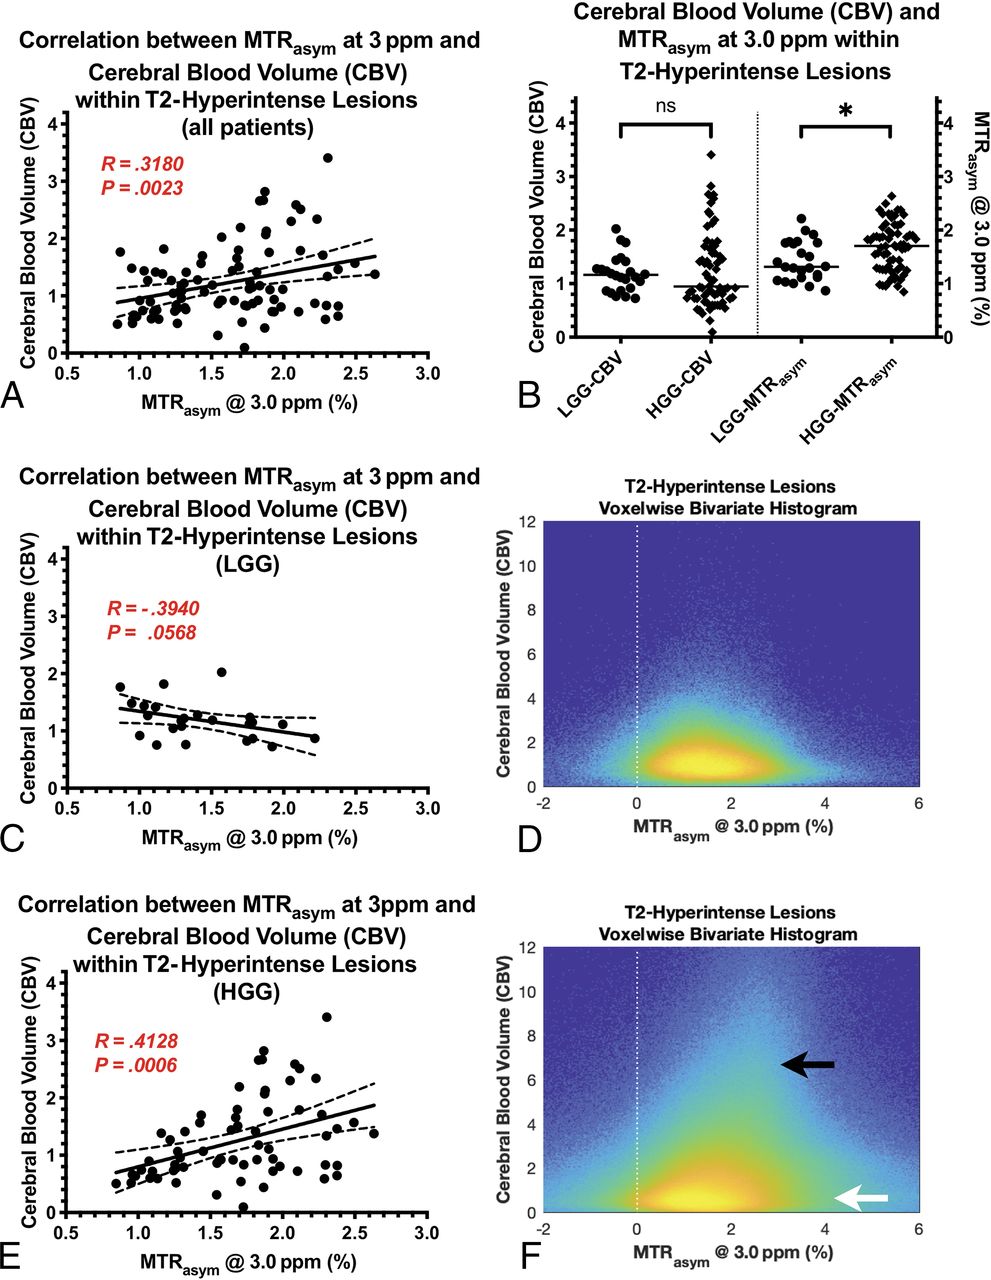
A, Association between CBV and tumor acidity within T2-hyperintense lesion areas in all patients, both treatment-naïve and those on active treatment. B, Cerebral blood volume and MTRasym at 3 ppm, a measure of tumor acidity, within T2-hyperintense lesions compared between low-grade and high-grade gliomas. The median value of CBV is 1.163 in LGGs and 0.9470 in HGGs. The median value of MTRasym at 3 ppm is 1.316% in LGGs and 1.706% in HGGs (P = .0176). C and E, The correlation between CBV and tumor acidity in LGGs and HGGs, respectively. D and F, The bivariate histograms of pH-weighted MTRasym and CBV of all voxels within T2-hyperintense lesions across patients in LGGs and HGGs, respectively. Note that in HGGs, in all voxel analyses (F), there is a high correlation component (black arrow) and a low correlation component (white arrow). The bivariate histograms were plotted with the logarithmic scale for better visualization.
Consistent with the patient-wise observation that T2-hyperintense lesions exhibit a more significant median CBV–median MTRasym correlation than contrast-enhancing lesions, the voxelwise analysis in different ROIs across all patients showed that the P value of the Pearson correlation was lower in T2-hyperintense lesions (median = 5.55 × 10−122) compared with contrast-enhancing lesions (median = 3.68 × 10⁻²⁶, P = .0003). However, the correlation coefficient R was not significantly different in the 2 ROIs (Mann-Whitney, P = .3344), indicating the heterogeneity within individual tumors.
CBV and MTRasym at 3 ppm across Tumor Grades
In the particular cohort of patients that we examined, which included both treated and treatment-naïve tumors, no significant association was observed between CBV and tumor grade within contrast-enhancing tumor (On-line Fig 1C; Kruskal-Wallis, P = .7408) or T2-hyperintense lesions (On-line Fig 1D; Kruskal-Wallis, P = .0815). The MTRasym at 3 ppm within contrast-enhancing tumor did not vary significantly among tumor grades (On-line Fig 2A; Kruskal-Wallis, P = .0895); however, it did show a higher MTRasym at 3 ppm in high-grade gliomas (HGGs, WHO III and IV) compared with low-grade gliomas (LGGs, WHO II) (On-line Fig 2C; Mann-Whitney, P = .0365; HGG = 2.351%, LGG = 1.665%). Likewise, the MTRasym at 3 ppm within areas of T2 hyperintensity was not significantly different among tumor grades (On-line Fig 2B; Kruskal-Wallis, P = .0532), but it did demonstrate increasing acidity within HGGs (Fig 2B; Mann-Whitney, P = .0176; HGG = 1.706%, LGG = 1.316%).
We also analyzed the patient-wise correlation of CBV and MTRasym in T2-hyperintense lesions in different WHO tumor grades. The correlation was significant within HGGs (Fig 2E; R = 0.4128, P = .0006), but not within WHO grade II tumors (Fig 2C; R = −0.3940, P = .0568). However, the correlation changed from a negative correlation in grade II to a positive correlation in high grades. The bivariate histograms of all voxels across all patients in the corresponding cohort were plotted in Fig 2D, -F.
As for the difference in the Pearson correlation of voxelwise CBV and MTRasym across tumor grade, we observed significantly different R values across the grades in T2-hyperintense lesions (On-line Fig 2E; Kruskal-Wallis, P = .0329) but not in contrast-enhancing lesions (On-line Fig 2D; Kruskal-Wallis, P = .3338). The Pearson correlation coefficient R was significantly higher in HGGs than in LGGs in T2-hyperintense lesions (On-line Fig 2F; Mann-Whitney, P = .0088; HGG = 0.0842, LGG = −0.0288), but not in contrast-enhancing lesions (On-line Fig 2F; Mann-Whitney U test, P = .4817).
CBV and MTRasym at 3 ppm in MGMT-Methylated and IDH Mutant Gliomas
In 44 patients with MGMT promoter methylation status available, no difference in CBV was observed in contrast-enhancing tumor (On-line Fig 3A; Mann-Whitney, P = .8085) or T2-hyperintense disease (On-line Fig 3B; Mann-Whitney, P = .5038). Similarly, no difference in the MTRasym at 3 ppm was observed in contrast-enhancing tumor (On-line Fig 3A; Mann-Whitney, P = .3234) or T2-hyperintense lesions (On-line Fig 3B; Mann-Whitney, P = .8301).
Measures of CBV within contrast-enhancing tumor were higher in IDHWT tumors compared with IDHMUT tumors (On-line Fig 3C; Mann-Whitney, P = .0134; IDHWT = 1.993, IDHMUT = 1.081), but there was not a difference in CBV within T2-hyperintense tumor regions (Fig 3A; Mann-Whitney, P = .6892). Measurements of MTRasym at 3 ppm in contrast-enhancing tumor was not significantly higher in IDHWT compared with IDHMUT tumors (On-line Fig 3C; Mann-Whitney, P = .5896). However, the difference became significant in T2-hyperintense lesions (Fig 3A; Mann-Whitney, P = .0368; IDHWT = 1.722%, IDHMUT = 1.538%). The voxelwise Pearson correlation coefficient R was significantly higher in IDHWT gliomas compared with IDHMUT gliomas in T2-hyperintense lesions (Fig 3B; Mann-Whitney, P = .0076; IDHWT = 0.0941, IDHMUT = −0.00187), but not in contrast-enhancing lesions (On-line Fig 3D; Mann-Whitney, P = .7599).

A, Measurements of CBV and MTRasym at 3 ppm within T2-hyperintense lesions for IDH mutant and IDH wild-type gliomas are compared. The median value of CBV is 1.163 in IDHMUT and 0.9298 in IDHWT. The median value of MTRasym at 3 ppm is 1.538% in IDHMUT and 1.722% in IDHWT (P = .0368). B, The Pearson correlation R values between CBV MTRasym at 3 ppm in T2-hyperintense lesions for IDHMUT and IDHWT are compared. The median value of R is −0.001871 in IDHMUT and 0.09405 in IDHWT (P = .0076). C and D, The patient-wise correlation between CBV and MTRasym at 3 ppm in T2-hyperintense lesions for IDHWT and IDHMUT tumors, respectively.
Discussion
The high metabolic demand of growing tumor could result in increased intracellular acidity. Altered vascularity and blood flow within tumors can lead to local regions of hypoxia.20 This lack of oxygen, in turn, can increase glycolysis and result in accumulation of carboxylic acid and lactic acid within the extracellular space.3,21 Acidification of the tumor microenvironment can result in vascular endothelial growth factor22 and platelet-derived endothelial cell growth factor23 expression, resulting in further angiogenesis and altered blood flow. This positive feedback loop can lead to additional decreased oxygen tension, increased glycolysis, increased acidification, and eventual tumor invasion and alterations of the tumor genome.
Consistent with this well-characterized process, we observed overall higher acidity and vascularity, as quantified by amine CEST-EPI and DSC-perfusion MR imaging, in contrast-enhancing tumors compared with T2-hyperintense lesions. However, within individual tumors, heterogeneous distribution of high-perfusion areas and high-acidity areas was frequently observed. Regions of high perfusion do not necessarily colocalize with regions of high acidity. For example, in Fig 1C, the arrow indicates a nonenhancing tumor region that exhibits high acidity but normal perfusion, which could indicate the existence of active tumor at the stage in which vessel cooption or angiogenesis has not occurred yet. The black arrow indicates a more traditional case in which the contrast-enhancing tumor is both highly perfused and highly acidic, suggesting that amine CEST-EPI as a pH-sensitive imaging technique is able to provide complementary information about tumor metabolism and microenvironment to current standard imaging protocols.
When examining the median values only within tumor regions across the entire patient cohort, we observed a significant correlation between acidity and vascularity within T2-hyperintense, nonenhancing tumor. Because this may have been due to the mixture of both treatment-naïve and treated gliomas included in our patient cohort and because we observed substantially higher levels of acidity in areas of necrosis known to have poor blood flow and hypoxia,24⇓–26 we isolated only patients who were not on active therapy. Results from this subset of patients (n = 58 of 90) showed the same trends, with no apparent relationship between blood volume and acidity in areas of contrast enhancement, but a significant, positive correlation in areas of T2 hyperintensity. Most interesting, when we examined the correlation within different tumor grades or different IDH-mutation statuses, the results were different. For high-grade gliomas (WHO III and IV) and IDH-wild type gliomas, the correlation between perfusion and acidity was positive, consistent with the hypothesis of a vicious cycle between tissue acidosis and altered blood flow due to the increasing metabolic demand of malignant tumor. However, in grade II gliomas and in IDH mutant gliomas, the correlation between perfusion and acidity was lost, indicating a possible different metabolic signature.
High-resolution microscopy work from Helmlinger et al27 in solid tumors has shown an apparent lack of correlation between areas of interstitial pH and pO2, suggesting that areas of angiogenesis may not necessarily be spatially colocalized to regions of acidity. Thus, results from the current study showed that tumor acidity, oxygen consumption, and neovascularity are complex processes and potentially spatially heterogeneous, which is consistent with this known genetic, histopathologic, proteomic, and metabolic spatial heterogeneity.28,29 To better interpret the radiologic findings and to develop a full picture of the complex relationship between perfusion and acidity in gliomas, additional histopathologic studies will be needed, for example, the tissue evaluation of proliferation, cell density, vessel density, and glycolytic pathway biomarkers.
The current study also observed a lower level of acidity in IDHMUT compared with IDHWT gliomas. This is consistent with recent observations by Paech et al30 using relaxation-compensated multipool CEST at 7T, and the work by Jiang et al31 using amide proton transfer imaging, as well as IDHMUT gliomas being known as less aggressive and having inhibition of the conversion of isocitrate to alpha-ketoglutarate, resulting in a buildup of 2-hydroxygluterate, inhibiting oxidative phosphorylation and altering the ability of IDHMUT tumor cells to effectively use glycolysis.32 The current study also observed higher CBV in contrast-enhancing tumors in IDHWT compared with IDHMUT tumors, which is consistent with a previous report.33 Uniquely, we found that the correlation between voxelwise CBV and MTRasym in T2-hyperintense regions is significantly higher in IDHWT compared with IDHMUT tumors. Because the distribution of IDH status is related to grade, we were not able to rule out the difference being more related to the genetic phenotype of glioma or the aggressiveness. However, our result does reveal that there are different patterns of perfusion/acidity distribution in gliomas, the heterogeneity of which may be related to genetic alternations and patient prognosis. We believe that further investigation of the corresponding histology features will clarify the potential role of combining perfusion and acidity imaging in the clinical setting of the management of patients with brain tumors.
With its unique contrast, CEST MR imaging has been shown to have great potential for various clinical applications.17,34,35 However, there is no standard sequence and postprocessing protocol for it yet, which may limit its use by clinicians. Apart from pH, MTRasym at 3.0 ppm may also be affected by several other factors, including amine proton concentration, tissue relaxivities, and field inhomogeneity.14 In the current study, we have corrected only for B0 inhomogeneity, but not the effect of T2 and amine concentration, the increase in which would amplify the MTRasym contrast enhancement under the condition of tissue acidity. We will continue to work on improving the CEST technique. This includes correcting for the confounding factors, exploring CEST metrics other than the asymmetric analysis, and accelerating the acquisition time.
One conceived limitation of our current study was the inhomogeneity in the patient population because we included both treatment-naïve and treated tumors. It is possible that some of the treated tumors may have undergone malignant transformation by the time of the MR imaging examination, leading to miscategorization because tumor grade was mostly based on pathologic findings at initial diagnosis. However, we propose that the mixture of both treated and untreated tumors allowed us to better generalize across all patient populations in a way that is consistent with clinical practice, suggesting that amine CEST-EPI may be useful as a clinical tool under a variety of treatment conditions.
Conclusions
Patients with both untreated and treated gliomas have spatially colocalized, regional, altered vascularity and acidity. Examination of median measurements within tumor regions across a large number of patients demonstrated a positive linear association between blood volume and tumor acidity in areas of T2-hyperintense, nonenhancing tumor; however, areas of contrast enhancement were more complex and did not show a strong relationship. Future studies aimed at therapeutically altering either vascularity, hypoxia, or acidity in patients with gliomas may reveal more information about the intricate interplay among these tumor characteristics.
Footnotes
Y.L. Wang and J. Yao contributed equally to this work.
Disclosures: Linda M. Liau—UNRELATED: Grants/Grants Pending: Northwest Biotherapeutics*; Stock/Stock Options: Actuate Therapeutics.* Albert Lai—UNRELATED: Consultancy: Merck, Comments: Advisory Board; Payment for Development of Educational Presentations: AbbVie, Comments: Society for NeuroOncology Annual Meeting lecture. Whitney B. Pope—RELATED: Consulting Fee or Honorarium: Bracco, Guerbet. Timothy F. Cloughesy—UNRELATED: Board Membership: Global Coalition for Adaptive Research, 501c3 for sponsoring clinical trials. No payment to author; Consultancy: VBI, VBL, Deciphera Pharmaceuticals, Agios Pharmaceuticals, Tocagen, Merck, Celgene, Puma, AbbVie, Eli Lilly and Company; Stock/Stock Options: Notable Labs. Benjamin M. Ellingson—UNRELATED: Consultancy: MedQIA, Agios Pharmaceuticals, Imaging Endpoints, Hoffman-La Roche/Genentech, Insys Therapeutics, OmniOx, Nativis, Siemens, Janssen Pharmaceutica, Medicenna, Novogen/Kazia; Grants/Grants Pending: Agios Pharmaceuticals, Roche, Janssen Pharmaceutica, Siemens. *Money paid to the institution.
This work was supported by the American Cancer Society Research Scholar Grant (RSG-15-003-01-CCE) (B.M. Ellingson); Art of the Brain (T.F. Cloughesy); UCLA Specialized Program of Research Excellence in Brain Cancer (National Institutes of Health/National Cancer Institute 1P50CA211015-01A1) (B.M. Ellingson, L.M. Liau, P.L. Nghiemphu, A. Lai, W.B. Pope, T.F. Cloughesy); and National Institutes of Health/National Cancer Institute, 1R21CA223757-01 (B.M. Ellingson).
Indicates open access to non-subscribers at www.ajnr.org
REFERENCES
- Received October 22, 2018.
- Accepted after revision April 10, 2019.
- © 2019 by American Journal of Neuroradiology


Jump to section
Related Articles
Cited By...
- No citing articles found.