
Abstract
BACKGROUND AND PURPOSE: Voxel-based morphometry is widely used for detecting gray matter abnormalities in epilepsy. However, its performance with changing parameters, smoothing and statistical threshold, is debatable. More important, the potential yield of combining multiple MR imaging contrasts (multispectral voxel-based morphometry) is still unclear. Our aim was to objectify smoothing and statistical cutoffs and systematically compare the performance of multispectral voxel-based morphometry with existing T1 voxel-based morphometry in patients with focal epilepsy and previously negative MRI.
MATERIALS AND METHODS: 3D T1-, T2-, and T2-weighted FLAIR scans were acquired for 62 healthy volunteers and 13 patients with MR imaging negative for focal epilepsy on a Magnetom Skyra 3T scanner with an isotropic resolution of 0.9 mm3. We systematically optimized the main voxel-based morphometry parameters, smoothing level and statistical cutoff, with T1 voxel-based morphometry as a reference. As a next step, the performance of multispectral voxel-based morphometry models, T1+T2, T1+FLAIR, and T1+T2+FLAIR, was compared with that of T1 voxel-based morphometry using gray matter concentration and gray matter volume analysis.
RESULTS: We found the best performance of T1 at 12 mm and a T-threshold (statistical cutoff) of 3.7 for gray matter concentration analysis. When we incorporated these parameters, after expert visual interpretation of concordant and discordant findings, we identified T1+FLAIR as the best model with a concordant rate of 46.2% and a concordant rate/discordant rate of 1.20 compared with T1 with 30.8% and 0.67, respectively. Visual interpretation of voxel-based morphometry findings decreased concordant rates from 38.5%–46.2% to 15.4%–46.2% and discordant rates from 53.8%–84.6% to 30.8%–46.2% and increased specificity across models from 33.9%–40.3% to 46.8%–54.8%.
CONCLUSIONS: Multispectral voxel-based morphometry, especially T1+FLAIR, can yield superior results over single-channel T1 in focal epilepsy patients with a negative conventional MR imaging.
ABBREVIATIONS:
- AUC
- area under the curve
- CR
- concordant rate
- DR
- discordant rate
- EEG
- electroencephalography
- GMC
- gray matter concentration
- GMV
- gray matter volume
- SP
- specificity
- VBM
- voxel-based morphometry
In focal epilepsy, detection of a focal lesion in MR imaging increases the odds of seizure-free outcome after an operation by 2.5–3 times.1 A common epileptogenic lesion is focal cortical dysplasia, which has notable morphologic characteristics on MR imaging.2 However, pure visual analysis, especially in subtle cases, can be challenging. Also, many histopathologically proven focal cortical dysplasias escape visual detection.3 Failure to identify these lesions can often label patients as having negative MR imaging for focal cortical dysplasia. These patients have poor surgical outcomes or may not even be referred for a potential epilepsy surgery.4
During the past decade, multiple MR imaging postprocessing methods have been applied to improve lesion detection in epilepsy,5 of which the most common applications are based on voxel-based morphology (VBM), usually using T1-weighted images (single-channel T1 VBM). VBM enables a voxelwise comparison between 2 groups of subjects and can highlight areas of statistically significant differences.6 This approach is commonly applied in the presurgical evaluation of epilepsy, comparing a single patient against a group of healthy controls. Martin et al, in 2015,5 reviewed various studies that have reported the potential use of VBM based on T1 within a sensitivity range of 60%–100%, whereas its application in identifying structural abnormalities in cryptogenic epilepsy remains challenging, with a sensitivity between 10% and 38%. Also, past studies used variable smoothing (between 5 and 14 mm)7⇓–9 and statistical cutoffs to elucidate VBM findings.10,11 Studies have shown that changing smoothing kernel size9 and statistical thresholds have a direct impact on the VBM findings,10 also affecting the specificity of the results.10
Recently, multispectral VBM (ie, the combination of multiple MR imaging contrast sequences) was proposed and made available in SPM8/SPM12 (http://www.fil.ion.ucl.ac.uk/spm/software/spm12) within its unified segmentation framework (New Segment). This approach enables combining different MR image contrasts. Lindig et al, in 2018,12 showed that multispectral VBM improves tissue segmentation for gray matter, white matter, and CSF and improves lesion detection in MR imaging positive for focal epilepsy compared with T1 VBM. However, it is still unclear whether multispectral VBM is beneficial in the more challenging cohort of MR imaging negative for epileptogenic lesions.
In this study, we wanted to objectify the selection of smoothing and statistical cutoffs with reference to the established and frequently used T1 VBM. This enabled us to systematically compare the diagnostic value of T1 and multispectral VBM using multiple image contrast combinations, T1+T2, T1+FLAIR, and T1+T2+FLAIR, in patients with focal epilepsy, but negative conventional MR imaging (i.e. previously MRI-negative).
Materials and Methods
Subjects
We recruited 62 healthy volunteers (number of controls, NC; 36 women, 26 men; mean age, 27.5 years) and 13 patients with MR imaging negative for cryptogenic epilepsy (number of patients, NP; 6 women, 7 men; mean age, 35.9 years) with a lobar clinical hypothesis of epilepsy origin. The clinical hypothesis was established through multiexpert consensus in the monthly epilepsy case conference, which uses all available clinical information in the presurgical epilepsy program (On-line Table 1). The multispectral VBM results analyzed in this work were not used in forming the clinical hypothesis. All patients had undergone video-electroencephalography (EEG) telemetry and neuropsychological assessment, and 6 of them had undergone PET/CT. After an epilepsy case conference for each of the 13 patients, 7 were identified as candidates for further intracranial EEG and possible subsequent epilepsy surgery due to medically refractory seizures (for clinical details see On-line Table 1). To date, intracranial EEG was performed in 5 patients and was offered to 2 patients who have not yet decided. Of the 5 patients with implants, 3 patients (patients 1, 2, and 6) had undergone an operation; in 2 patients with implants (patients 4 and 11), surgery was declined due to suspected multifocal epileptogenesis. In postsurgical patients, histopathology revealed evidence of hippocampal sclerosis in 1 patient (patient 2), but this patient did not achieve postoperative seizure freedom (Engel class II). The histopathologic tests of the other 2 operated patients (patients 1 and 6) were unremarkable, and to date, 1 patient (patient 1) is seizure-free without anticonvulsive medication (Engel I). The other patient (patient 6) had postoperative seizure freedom, but only for 1 year. All subjects were scanned on a 3T MR imaging scanner (Magnetom Skyra; Siemens, Erlangen, Germany) at the University Hospital Tübingen. The acquisition protocol was previously reported12 and consists of 0.9-mm3 isotropic 3D T1-weighted MPRAGE (= T1), 3D T2-weighted sampling perfection with application-optimized contrasts by using different flip angle evolutions (SPACE sequence; Siemens) (= T2), and 3D inversion recovery prepared SPACE sequence (= FLAIR).
Image Processing
At first, all scans were converted from DICOM to NIfTI format using MRIConvert (https://lcni.uoregon.edu/downloads/mriconvert). The postprocessing was performed with SPM12 in a Matlab R2016a (MathWorks, Natick, Massachusetts) environment and with an in-house Matlab code. We used VBM based on T1 images only (T1 VBM) as a reference. This was compared with multispectral VBM combinations based on multiple MR images (ie, T1+T2, T1+FLAIR, and T1+T2+FLAIR). For multispectral VBM, T2 images (T2 and FLAIR channels) were coregistered to their respective T1 images using linear coregistration with 12 df and a normalized mutual information cost function. Segmentation was performed with default settings of bias regularization of 0.001 and a bias cutoff full width at half maximum of 60 mm. As a next step, the segmented GM images were normalized to the Montreal Neurological Institute space by using the Diffeomorphic Anatomical Registration Through Exponentiated Lie Algebra (DARTEL, part of SPM) toolbox, with an isotropic resolution of 1.5 mm3.13 To correct for regional volume changes in normalization, we modulated images to preserve the quantity of GM tissue (gray matter volume [GMV]) within a voxel and unmodulated images for preserving the concentration of GM tissue (gray matter concentration [GMC]). Finally, spatially normalized images were smoothed, using a Gaussian kernel with a range from 4- to 16-mm full width at half maximum in a step size of 2. The smoothed GMC and GMV images were further analyzed using SPM12.
Statistical Analysis
We used the general linear model from SPM12 to analyze regional increased differences in the smoothed GMC and GMV images. The general linear model analysis was performed using the factorial design specification (2-sample t test) in SPM12 to compare each patient against the control cohort (patient comparison) and each control in a leave-one-out cross-validation against the remainder of the controls after removing the subject in question (control comparison). We included age and sex as covariates for GMC. Total intracranial volume was also included as a covariate for GMV. The resulting statistical maps (t-contrast maps, subject > controls, ie, increase of GM) were thresholded with T-score cutoffs from 2.5 to 6 in step sizes of 0.1. The suprathreshold clusters at each smoothing level and each T-threshold were used for reporting the results.
Objective Diagnostic Performance Assessment
We created a brain mask by summation of normalized unmodulated GM and WM images from T1 segmentation. Voxel intensities <0.5 were excluded to remove nonbrain areas. On the basis of the expert clinical hypothesis, the lobes of the hypothesis were identified for each patient in the Montreal Neurological Institute structural atlas provided with FSL, Version 5.0 (http://www.fmrib.ox.ac.uk/fsl).14,15 For each patient, “concordant lobes” were defined as the atlas lobes/regions (for example, left frontal lobe) that are identified as the lobes of clinical hypothesis. The lobes that are not a part of the clinical hypothesis for each patient were defined as “discordant lobes.” For controls, because no epileptogenic lesions are expected, all atlas regions were defined as discordant.
Analysis
Every suprathreshold cluster was considered as a concordant or a discordant finding provided one-third or greater of the suprathreshold cluster overlapped the respective lobar ROI (concordant or discordant).
The concordant rate (CR) was calculated as
 The discordant rate (DR) was calculated as
 For controls, each suprathreshold cluster was considered a nonepileptogenic finding provided one-third or greater of the cluster overlapped the control cortical mask (excluding likely artifactual findings outside the brain). Specificity (SP) was calculated as
 NCON, NDIS and NNF in the above equations refer to the number of patients with concordant and discordant findings and the number of controls with no findings, respectively.
Diagnostic Assessment
To determine the ideal parameters (smoothing level and T-threshold), we generated receiver operating characteristic curves at each smoothing level by plotting 100-SP versus CR for all T-thresholds. The area under the curve (AUC) was calculated using a trapezoidal integration function in Matlab as a performance index for each smoothing kernel width. For comparing single-versus-multispectral VBM, we considered the smoothing level with the best performance (the highest AUC across all smoothing levels; 4–16 mm) for T1 as a reference.
Determining T-Threshold, SP, and CR
For this reference smoothing kernel, SP and CR values at T-thresholds of 2.5–6 were plotted.8 We considered the T-threshold in which the remainder of CR–SP was the smallest but still positive. This point was referred to as the “optimized T-threshold.” At this threshold, a balanced trade-off between these 2 diagnostic indices (CR and SP) can be achieved. At this defined T-threshold and the reference smoothing level, SP, CR, and DR values were reported for all VBM models. Later, the Euclidean distance (ED) (Fig 1D) of the pair SP, CR from (100, 100) was calculated for all VBM models as

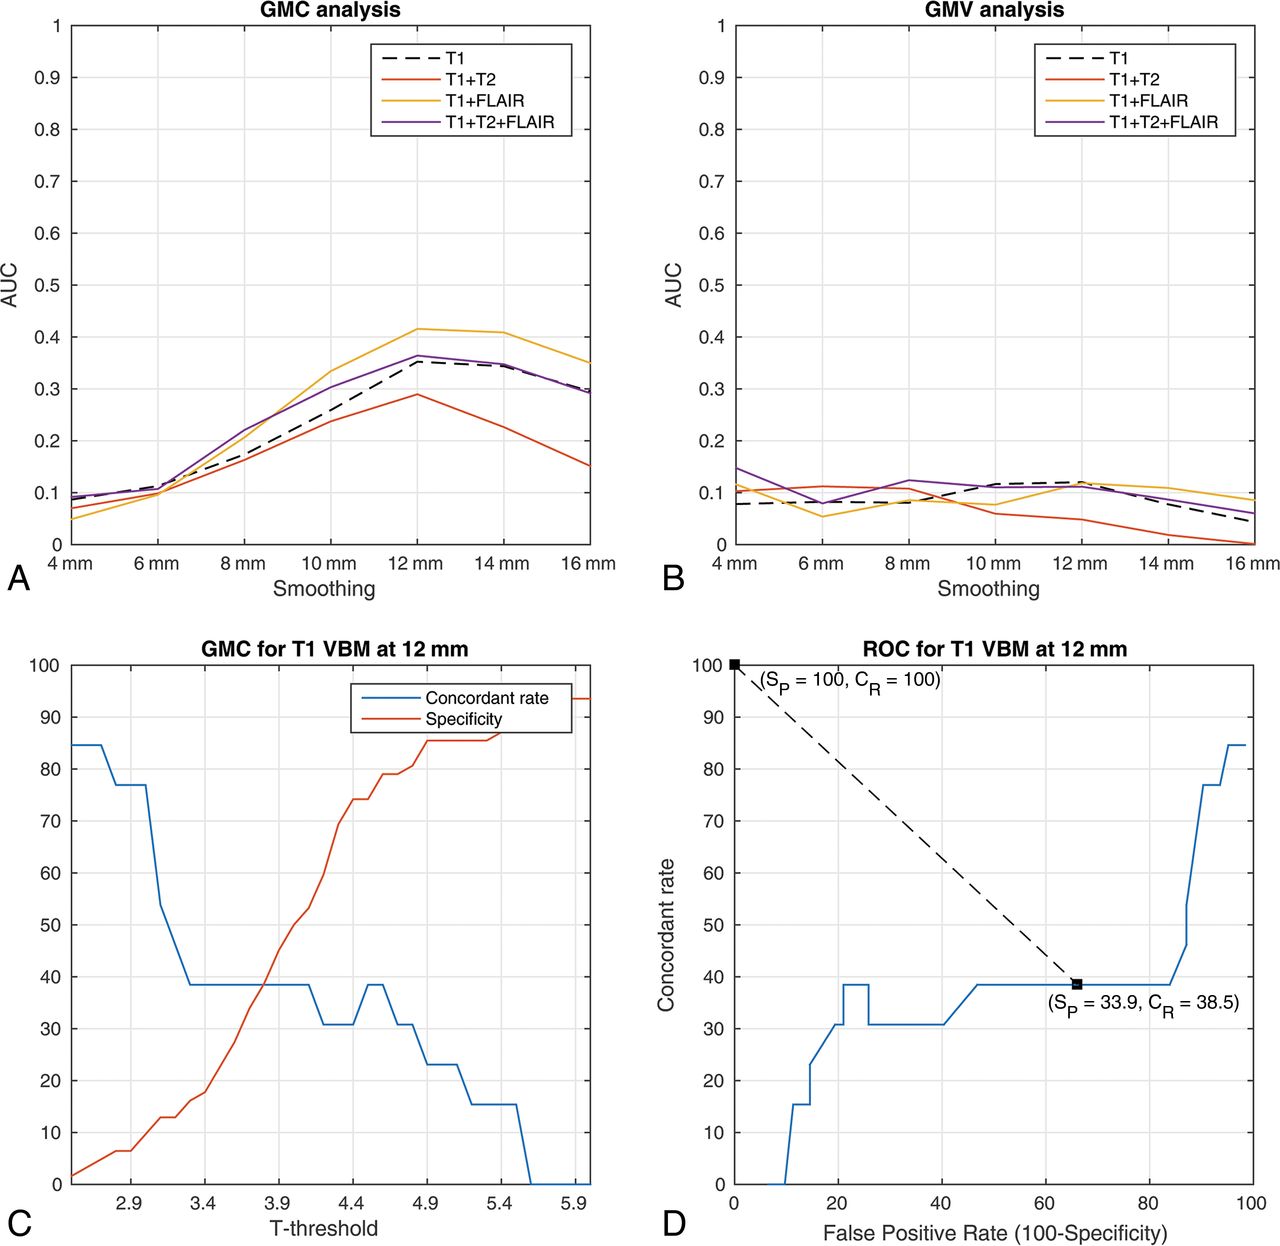
Diagnostic performance of different VBM models. A and B, The area under the curve for different smoothing kernels for gray matter concentration and volume. C, An example of an intersection plot for T1 VBM for the concordant rate and specificity against statistical cutoffs. D, An example of a receiver operating characteristic curve for T1 VBM at 12-mm smoothing for GMC. The Euclidean distance is calculated from the optimized T-threshold (3.7 in GMC analysis), where CR, SP = 38.5, 33.9 to CR, SP = 100, 100. False positive rate = 100-SP.
Visual Interpretation of VBM Findings
On the basis of the minimum Euclidean distance value across models and analysis, we selected analysis findings for visual interpretation. Visual analysis was performed to verify VBM findings in patients and controls. At the reference smoothing kernel and the optimized T-threshold, all findings across models were inverse-transformed to native space using the deformation utility in SPM12 for each subject separately (“back-normalization”). To group clusters in a close spatial relation, we applied a smoothing of 8-mm full width at half maximum to the transformed cluster maps and considered all clusters connected at a statistical value of >0.5 as a single cluster for the visual review process. Later, these clusters (native space findings) across all models were combined for each subject. Finally, native space findings were overlaid on corresponding patient native T1 and coregistered T2 and FLAIR scans. An expert board-certified neuroradiologist (B.B.) inspected each finding without prior knowledge of the lobar hypothesis and labeled each cluster as the following: 1, potentially epileptogenic and visible; 2, potentially epileptogenic but not visible; 3, nonepileptogenic; 4, unclear/not visible or ambiguous; and 5, artifacts. For visual inspection of controls, each cluster was categorized into the following: 1, visible and nonepileptogenic; 2, unclear/not visible; and 3, artifacts. The reviewer used the nonepileptogenic label when the finding was visible but likely not epileptogenic, such as microangiopathy or perivascular spaces. VBM clusters were rated as unclear when the finding was not sufficiently visible to confirm these findings as potentially epileptogenic, nonepileptogenic, or artifacts. As part of the visual analysis, we reviewed all clusters again to ascertain the correctness of the automated lobar classification and to flag them as either concordant or discordant clusters. This step was needed in only 1 case in which 63.2% of voxels were in the concordant lobar mask. Hence, this cluster was eventually marked as a concordant finding.
Results
VBM Automated Results: Smoothing Parameters in GMC and GMV
For all models in the GMC analysis, the ideal smoothing was found to be 12 mm. T1+FLAIR showed the best AUC of 0.42 at 12 mm in comparison with T1 (0.35), T1+T2 (0.29), and T1+T2+FLAIR (0.36). For the GMV analysis, the ideal smoothing was also at 12-mm full width at half maximum of different smoothing levels as shown in Fig 1A, -B and On-line Table 2.
T-Threshold, Concordant Rate, and Specificity
We found the intersection of CR and SP across different T-thresholds at 3.7 for 12 mm in GMC analysis (Fig 1C). At this T-threshold, T1+T2 and T1+FLAIR showed CR, SP at 46.2, 40.3 and 46.2, 37.1, respectively, compared with T1 at 38.5, 33.9. The ratio of CR/DR was also higher for T1+T2 and T1+FLAIR at 0.86 and 0.75, respectively, compared with T1. The Euclidean distances for all models were in the range of 80.37–90.29. The performance details of all models are presented in Table 1. For the GMV analysis, a lower T-threshold of 3.0 was found at 12 mm as the intersection point for CR and SP. The concordant rate across models was between 7.7% and 38.5%, with specificity between 9.7% and 21%. CR/DR across models was between 0.10 and 0.50. The Euclidean distances were in the range of 105.32–123.66. All details for GMV analysis are provided in Table 2.
GMC analysis for VBM models at 12 mm and a T-threshold of 3.7a
GMV analysis for VBM models at 12 mm and a T-threshold of 3.0a
Visual Interpretation Results of VBM Findings
Visual interpretation was performed for GMC analysis at 12-mm full width at half maximum and a T-threshold of 3.7. The highest concordant rate was found for T1+FLAIR at 46.2% in comparison with T1 at 30.8%. Also, T1+FLAIR showed the highest CR/DR ratio at 1.20 compared with T1 (0.67) and the rest of the models. Only T1+FLAIR and T1+T2+FLAIR showed more or equal concordant-to-discordant findings. The discordant finding rate dropped from 53.8%–84.6% to 30.8%–46.2% after visual interpretation. All results for visual interpretation of patient findings are presented in Table 3. In the visual interpretation of controls, 14.5%–21% of findings were marked as nonepileptogenic, while 45.2%–53.2% were marked as unclear (Table 4); 17.7%–25.8% of controls also had findings that were classified as artifacts. The overall specificity after visual interpretation across models was between 46.8% and 54.8%.
Patients—visual analysis results for GMCa
Controls—visual analysis results for GMCa
Discussion
In this study, we identified ideal analysis parameters, namely smoothing and T-threshold (statistical cutoff), with reference to T1 VBM. Incorporating these parameters, we systematically compared T1 and multispectral VBM using a combination of T1, T2, and FLAIR images for detecting gray matter structural abnormalities in patients with MR imaging previously negative for focal epilepsy. We objectified the main VBM parameters, smoothing and statistical cutoffs, with reference to the classic T1 VBM. Furthermore, by systematically comparing multispectral VBM models against T1 VBM and using visual inspection of VBM findings, we found T1+FLAIR as the best performing model based on the concordant rate, specificity, and concordant-to-discordant ratio.
Smoothing and Statistical Cutoff
There is a wide variation in parameters in VBM studies for lesion detection in epilepsy for smoothing kernel sizes ranging from 5 to 14 mm7⇓–9,16⇓–18 and for a statistical cutoff from P < .001 uncorrected (corresponding to a statistical cutoff T of approximately 3.2 in our sample) to P < .05 family wise error–corrected (corresponding to a statistical cutoff T of approximately 5.1 in our sample)10 as well as comparisons at multiple statistical cutoffs.8 We provide a systematic comparison of the 2 main parameters focused on patients with focal epilepsy, but negative conventional MRI, given that this is the main target cohort for advanced lesion detection in epilepsy. For the most frequently used T1-only approach, we found that a smoothing of 12-mm full width at half maximum and a threshold of T = 3.7 provide the highest AUC and best diagnostic balance between concordant rate and specificity. Most interesting, our recommendation of a 12-mm smoothing kernel is similar to that in a previous study conducted by Salmond et al.19 In line with this study, we found a low specificity with decreased diagnostic performance (AUC, Fig 1A and On-line Table 2) at 4 mm across all models.
Second, as expected, the concordant rate decreased and specificity increased with respect to increasing statistical cutoffs (Fig 1C). This finding is in agreement with a previous study on a lesional cohort based on Z-scores.8 We aimed for a balance between sensitivity/CR and specificity (maximal AUC, intersection of CR and SP). It is debatable whether a different approach with maximized sensitivity could also be clinically useful, dealing with little or no specificity. However, in our view, a VBM approach should have at least some degree of specificity to be informative in the difficult context of MRI-negative patients, in which invasive diagnostics and invasive EEG are commonly performed and carry low-but-non-negligible risks for patients. Martin et al10 found that the best odds ratio for predicting postoperative seizure freedom was achieved by the VBM variant with the best specificity, namely the normalized FLAIR signal. Nonetheless, our results will also provide guidance if other groups want to select their analysis parameters with a different intention, either maximizing sensitivity or specificity (On-line Figs 1 and 2).
Gray Matter Concentration versus Volume Analysis
We found that gray matter concentration analysis revealed better results for both single- and multispectral models in comparison with volume analysis. This is in agreement with a previous study in a different cohort in which gray matter concentration was found to be better in detecting epileptogenic lesions in MRI-negative and MRI-positive patients.10 The only difference between the 2 analyses is the additional step of modulation, which is intended to preserve the original tissue volume.6 The exact reason for this diagnostic difference remains speculative. It is possible that epileptogenic lesions and focal cortical dysplasias are better characterized by local changes of tissue composition, and global volume effects attenuate the effect size (eg, “compensating” gray matter increase in the lesions with atrophy in the surrounding area). Whether superiority of GMC over GMV analysis remains true for different MR imaging pulse sequences with different tissue contrasts needs to be determined.
Visual Interpretation of VBM Findings
After visual interpretation of control findings, we found a specificity range between 46.8% and 54.8% across all models. We cannot draw a direct comparison with previous studies because our VBM models, smoothing and statistical cutoffs, are different from those in past studies.10,16,20 However, we are in line with our previous study on 50 controls, in which a specificity of 42% was reported for T1 gray matter concentration analysis10 at P < .05 (family-wise error). Moreover, 12.%–16.1% of controls had only visible (nonepileptogenic/artifacts) findings (ie, controls who had visible findings but no unclear findings). This finding contributed to an increase in specificity after visual analysis (Table 4). In a previous study based on the morphometric analysis program, approximately 25% of findings in controls (13 of 52) were marked as nonepileptogenic normal variants,20 similar to our results. Across models, after visual analysis, we observed a drop in concordant and discordant rates (Tables 1 and 3). In a previous study based on an MR imaging cohort negative for epileptogenic lesions, after visual analysis, the concordant rate for FLAIR and T1 VBM dropped from 28.6% and 14.3% to 14.3% and 0%, respectively.21 This result shows that visual interpretation of VBM findings is needed before considering these for epilepsy surgery. Nevertheless, we and others have previously shown that VBM findings carry a positive odds ratio for a good outcome after epilepsy surgery and are, thus, clinically relevant.10,20
Effect of Multispectral VBM
After visual inspection, the highest concordant rate was confirmed for multispectral T1+FLAIR at 46.2% in comparison with T1 (30.8%) and the other models. This is in line with a previous study in patients with lesional epilepsy, in which multispectral T1+FLAIR also showed a superior performance compared with T1.12 Similarly, the enhanced performance of FLAIR-VBM (concordant rate, 14.3%) over T1 (0%) was also found in a study cohort of children with cryptogenic epilepsy.21 Additionally, intensity-normalized FLAIR-VBM11 showed positive odds of 7.3 for a successful surgical outcome in comparison with T1 VBM in 129 patients with MR imaging negative for epilepsy.10 This finding indicates that inclusion of a new channel, FLAIR in this case, can contribute to increasing concordant rates in a cohort with MR imaging negative for focal epilepsy. Overall these results show that multispectral VBM is superior to T1 VBM, but there still is a need for new modalities and approaches to be explored (eg, based on [resting-state] functional imaging, alternative tissue contrasts like MP2RAGE/diffusion imaging, and higher magnetic fields).
Discordant Findings in Patients
All VBM variants had a relevant number of findings discordant with the primary clinical hypothesis, but these differed substantially among the variants. Only T1+FLAIR showed more concordant-than-discordant findings, with the highest concordant-to-discordant ratio among all models and approximately 2 times more than in T1. In a previous study, Martin et al10 showed that only normalized FLAIR-VBM had more concordant than discordant findings in MRI-negative patients against T1. In the same study, only normalized FLAIR-VBM had no discordant findings in the group of 15 patients with MR imaging positive for focal cortical dysplasia. We are not aware of any other VBM-based study addressing discordant findings in the cryptogenic epilepsy cohort; 30.8%–46.2% of patients still had discordant findings that were marked as potentially epileptogenic. In this most challenging epilepsy surgery cohort (MR imaging negative for focal epilepsy), the definition of an epileptogenic zone is often limited because fast propagation of epileptogenic activity can be difficult to detect in scalp video-EEG.22,23 Furthermore, patients can have >1 epileptogenic zone/lesion, and our hypotheses were derived from noninvasive data (especially video telemetry EEG) in many cases (On-line Table 1). Thus, VBM findings initially considered discordant may still be real and clinically relevant. We also provided the concordant and discordant findings in patients for all VBM models that were visually confirmed as potentially epileptogenic as in On-line Table 3.
Nonvisible Findings
Patients and controls also had findings marked as not visible (Table 5). The biologic meaning of these findings that are not visible, is difficult to assess. They can be due to subtle artifacts beyond the visible threshold (eg, field inhomogeneities or movement) or minor differences in cortical morphology without direct pathologic meaning. In patients, these findings can also represent subtle epileptogenic lesions that escape visual detection. In a direct comparison, the frequency of detecting a nonvisible finding was only slightly higher in patients than in controls (for some models), making it likely that these findings are largely nonspecific. However, more clinical data and follow-up are needed to draw further conclusions from such nonvisible findings.
Nonvisible findings—visual analysis results for GMCa
Diagnostic Value of Multispectral FLAIR-VBM in Focal Epilepsy
A major advantage of multispectral VBM lies in simultaneously including FLAIR along with T1. It takes only an extra 5–7 minutes to acquire 3D-FLAIR. Additionally, processing time for T1 and T1+FLAIR VBM differs only in the extra step of coregistration for the latter. Second, many lesions in focal epilepsy (focal cortical dysplasia, hippocampal sclerosis, tumors) have a prolonged T2-relaxation, resulting in hyperintense signal and increased visibility on a FLAIR image.2,21 Thus, it is not surprising that FLAIR-based methods could detect those lesions better than T1 alone.11,12 For example, Fig 2 shows the presumed lesion to be more visible on FLAIR than on T1 images. All VBM models eventually detect this abnormality, but the coverage and effect size were best in VBM models that include FLAIR. The finding is in concordance with the clinical lobar hypothesis, which was in the right frontal lobe, indicated by noninvasive EEG and intracranial EEG.

Sample case (patient 4). A and C, An overview in the native space T1, T2, and FLAIR images. B and D, Zoomed-in images focusing on a possible epileptogenic lesion. A subtle disruption of cortical morphology is visible in this figure, more prominent on FLAIR images. This finding is concordant with the clinical hypothesis supported by noninvasive and intracranial EEG, indicating seizure onset in the right frontal lobe. The possible lesion was detected as increased GM by all VBM models, but the extent and effect size were clearly better for the VBM models, including FLAIR (E).
Another example is shown in Fig 3, where only T1+FLAIR VBM detects a subtle structural abnormality in the left temporoinsular region. In comparison with the right side, a subtle blurring of GM-WM is visible at the left temporal operculum/posterior insula. This finding is in concordance with the clinical lobar hypothesis of bilateral temporal onset. In both cases, it is likely that the suspected abnormalities are segmented as gray matter and, consequently, increase the gray matter probability when the FLAIR image is added. Furthermore, the improved tissue classification by multimodal segmentation may improve the lesion detection.12,24,25 Of the 3 patients with operations, 1 patient (patient 6) had findings concordant with the lobar clinical hypothesis in the left temporal region detected by T1 and T1+FLAIR but not coinciding with the resected area. The patient was seizure-free for only 1 year before seizures resumed, raising the possibility of a partial resection and prompting further clinical investigations.

Sample case (patient 13). A, A VBM finding detected only by T1+FLAIR in the left temporoinsular region overlaid on the native space FLAIR image. B, Magnified images of T1, T2, and FLAIR suggesting a blurred gray-white matter junction (arrow). This finding is concordant with the clinical hypothesis of seizure onset.
Limitations
Five of 6 patients with concordant findings did not have surgical resection; the 1 patient with a resection did not have the finding in the resection area and later had seizure relapse. Hence, a histopathologic confirmation was not possible. Low rates of surgical resection as well as reduced chances of seizure freedom are typical for patients with MR imaging negative for epilepsy.1 Nonetheless, a visual review of the findings by an expert radiologist blinded to the clinical hypothesis shows clear improvement in the concordant/discordant ratio for multispectral VBM. This indicates that these findings can be of diagnostic relevance. However, our study cannot assess whether multispectral VBM will eventually improve the surgical outcome. This will require longitudinal multimodal studies by large multicenter collaborations. Our results can guide the choice of sequences and analysis parameters for such projects.
Conclusions
We provide optimized VBM parameters, specifically smoothing and statistical cutoff (T-threshold), for lesion detection in MR imaging previously negative for focal epilepsy with T1 VBM as a reference. We systematically compared multispectral VBM with T1 VBM. We found a smoothing level of 12 mm and a T-threshold of 3.7 for GMC analysis as ideal parameters. With these parameters, after we visually confirmed VBM findings, multispectral VBM T1+FLAIR yielded results superior to those of all other models. We also found VBM an important computational advancement, which, after a careful visual interpretation, can aid the presurgical evaluation of focal epilepsy. We recommend multispectral VBM, especially T1+FLAIR, as currently the best VBM model in detecting increased gray matter structural abnormalities in patients with MR imaging previously negative for focal epilepsy.
Footnotes
Disclosures: Benjamin Bender—UNRELATED: Expert Testimony: Medtronic*. Niels K. Focke—RELATED: Grant: Deutsche Forschungsgemeinschaft/Deutsche Forschungsgemeinschaft, Comments: Deutsche Forschungsgemeinschaft grant FO750/5–1; UNRELATED: Consultancy: Bial, Eisai; Payment for Lectures Including Service on Speakers Bureaus: UCB; Payment for Development of Educational Presentations: Bial. *Money paid to the institution.
This work was funded by the University of Tübingen/Applied Clinical Research (321-0-1) and Deutsche Forschungsgemeinschaft (FO750/5-1).
Indicates open access to non-subscribers at www.ajnr.org
References
- Received February 5, 2018.
- Accepted after revision August 6, 2018.
- © 2018 by American Journal of Neuroradiology


Jump to section
Related Articles
Cited By...
- No citing articles found.