
Abstract
SUMMARY: The routine use of arterial spin-labeling (ASL) in a clinical population has led to the depiction of diverse brain pathologic features. Unique challenges in the acquisition, postprocessing, and analysis of cerebral blood flow (CBF) maps are encountered in such a population, and high-quality ASL CBF maps can be generated consistently with attention to quality control and with the use of a dedicated postprocessing pipeline. Familiarity with commonly encountered artifacts can help avoid pitfalls in the interpretation of CBF maps. The purpose of this review was to describe our experience with a heterogeneous collection of ASL perfusion cases with an emphasis on methodology and common artifacts encountered with the technique. In a period of 1 year, more than 3000 pulsed ASL cases were performed as a component of routine clinical brain MR evaluation at both 1.5 and 3T. These ASL studies were analyzed with respect to overall image quality and patterns of perfusion on final gray-scale DICOM images and color Joint Photographic Experts Group (JPEG) CBF maps, and common artifacts and their impact on final image quality were categorized.
Arterial spin-labeling (ASL) is an MR perfusion method for quantitatively measuring cerebral blood flow (CBF) by taking advantage of arterial water as a freely diffusible tracer.1–3 ASL is completely noninvasive and repeatable and is performed without gadolinium, thus bypassing concerns regarding nephrogenic systemic fibrosis in patients with significant renal insufficiency.4 Despite this versatility, dynamic susceptibility contrast (DSC) MR imaging, CT perfusion, and nuclear medicine positron-emission tomography and single-photon emission CT techniques have been the methods of choice in large studies investigating CBF in disease states, having been validated in a variety of neurologic disorders including stroke, tumor, and seizure.5 ASL has been extensively performed in the research arena and sporadically validated in disease6–11 but, because of obstacles related to licensing as well as postprocessing, has seen little in the way of routine application in large clinical populations. A fully automated postprocessing pipeline at our institution has overcome this impediment and allows for real-time system-wide review of CBF maps independent of any manual processing steps. A growing volume of clinical ASL studies is mounting at our institution on which various imaging patterns have been observed.
An inversion pulse is used to tag inflowing spins at a level proximal to the imaging slab, and, following a transit delay to allow these tagged spins to enter the imaging plane and exchange with tissue, control and label images are obtained. After the acquisition of approximately 60 control-label volumes for signal intensity averaging, the pair-wise subtraction of these 2 images yields maps of brain tissue perfusion, expressed in units of mL/100 g/min. At our institution, a fully automated postprocessing cascade is set off on extraction of the raw ASL data and includes data transfer to network-attached storage, conversion from DICOM to Neuroimaging Informatics Technology Initiative format, motion correction, tissue segmentation, flow quantification, creation of color Joint Photographic Experts Group (JPEG) CBF maps, conversion back to DICOM format, and insertion into the clinical PACS. These steps are performed with use of distributed grid processing with the Sun Grid Engine (Sun Microsystems, Santa Clara, Calif). Our pipeline includes automated error-recovery with data-provenance (output logs are analyzed to initiate appropriate automated error-recovery procedures), and e-mail notifications of results and summary logs with links to JPEG images compliant with the Health Information Portability and Accountability Act. With use of our automated pipeline, the final postprocessed images appear in the PACS within 10 minutes after acquisition and transfer, frequently before the remainder of the conventional clinical study is completed.
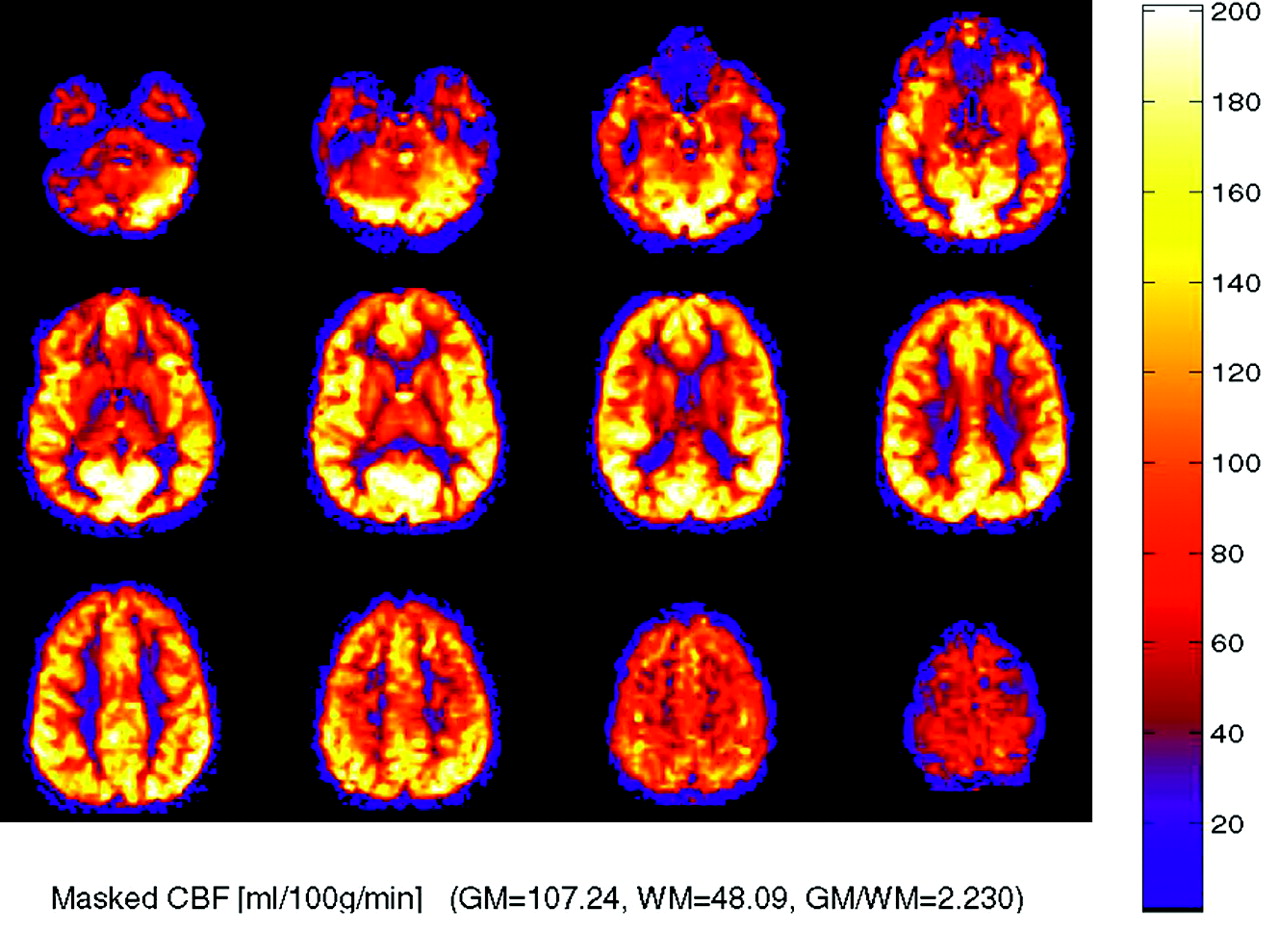
The colorized multisection JPEG format generated in our processing protocol (Fig 1) provides an easy-to-interpret figure, which can be quickly correlated with anatomic MR images in the same PACS viewer. Gray-scale CBF maps are also transferred to the PACS workstation in DICOM format and have full spatial cross-referencing capability with standard anatomic MR images. As ASL techniques evolve, improved spatial resolution will allow even more precise anatomic localization of blood flow abnormalities. In our experience, identification of isolated ASL abnormalities has not infrequently led to a “second look” at the conventional images and has yielded improved detection of subtle abnormalities on fluid-attenuated inversion recovery and postgadolinium sequences.

Normal ASL CBF map. Multisection JPEG map with color ramp representing units of mL/100 g tissue/min. No flow asymmetry or artifact is present.
ASL Technique
Perfusion data were acquired with use of quantitative imaging of perfusion and a single subtraction with thin section TI1 periodic saturation (QUIPSS II TIPS a.k.a. Q2TIPS)12 with a flow-sensitive alternating inversion recovery (FAIR).13 The Q2TIPS-FAIR sequence is a multisection sequence that incorporates saturation pulses to minimize the uncertainty associated with tagged blood's transit time into the imaging section.14 The saturation pulses in our implementation of Q2TIPS are very selective suppression (VSS) radio-frequency pulses,15 which are applied every 25 ms between 800 ms (TI1) and 1200 ms (TI1s). The VSS pulses saturate a 2-cm slab of tissue with a 1-cm gap between the saturation slab and the first imaging section. Our implementation of the Q2TIPS-FAIR sequence uses a C-shaped frequency offset corrected inversion (FOCI) pulse (β = 1361, μ = 6).16 A C-FOCI pulse is used instead of the standard adiabatic hyperbolic secant pulse to reduce section imperfections and improve sensitivity.
The maximum number of sections that can be imaged with the Q2TIPS-FAIR sequence is limited by several factors (imaging time per section, the inversion time [TI], the repetition time [TR], the longitudinal relaxation rate of blood, the blood transit time, etc). We have combined the Q2TIPS-FAIR sequence with single-shot echo-planar imaging,17 which allows CBF maps to be acquired with 11 sections with excellent reproducibility. The 11 oblique sections are prescribed parallel to the anterior/posterior commissure (AC/PC) line and are acquired sequentially inferior to superior. Other imaging parameters are as follows: TE, 28ms; TI1, 800ms; TI1s, 1200ms; TI, 2000 ms; TR, 3000 ms; receiver bandwidth, 62.5 kHz; flip angle, 90°; FOV, 24 cm; (frequency) × 18 cm (phase), an acquisition matrix 64 × 48 (11 sections, 8-mm thickness, 0-mm section gap); and frequency encoding direction, anterior to posterior. The sequence was performed at field strengths of both 1.5 and 3T. A diffusion gradient with an equivalent b-value of 5.25 mm2/s is added to suppress intra-arterial spins.18 Sixty label/control pairs are obtained to provide perfusion-weighted images with good signal-to-noise ratio in a reasonable acquisition time of 6 minutes and 30 seconds. The first 30 seconds (10 volumes) are used to establish steady state and acquire proton attenuation (M0) image. The M0 image serves as an internal reference to scale the perfusion-weighted images appropriately to obtain absolute quantitative CBF maps.
The reconstructed control/label images are transferred in the background to an off-line workstation for fully automated processing as described above. The perfusion images are motion corrected with a 6-parameter rigid body transformation applied to the control and label volumes separately within statistical parametric mapping (SPM5).19 After motion correction, the different images are averaged together, and quantitative perfusion maps are calculated from the equation:  1) where CBF is the cerebral blood flow, ΔM(TI2) is the mean difference in the signal intensity between the label and control images, M0,blood is the equilibrium magnetization of blood, α is the tagging efficiency, TI1 is the time duration of the tagging bolus, TI2 is the inversion time of each section, T1,blood is the longitudinal relaxation time of blood, and qp is a correction factor that accounts for the difference between the T1 of blood and the T1 of brain tissue.20 The M0,blood is approximated from the M0, white matter, which is measured directly from the M0 image acquired with the perfusion-weighted images.20 The mean white matter M0 is determined by applying a white matter mask from an automated segmentation step performed in SPM5 on a high-resolution T1 volume acquired in the same scan session. The correction factor, qp, requires that the T1 of the brain tissue be measured at each voxel. In our clinical implementation, we do not measure the T1 of the tissue and assume that it is equal to the T1 of blood. This is a relatively good approximation for gray matter but results in the CBF of blood being overestimated for white matter. The advantage of this assumption is that it eliminates the need for acquiring data to generate a T1 map. The resulting quantitative CBF images contain values that represent the magnitude of perfusion (mL/100 g tissue/min) for each voxel.
Preprocessing and Postprocessing Methods
The postprocessing of arterial spin-tagging data typically involves several steps: subtraction of alternating tag and control image pairs, motion correction, segmentation of the anatomic T1-weighted image, and voxel-wise computation of absolute CBF maps. The subtraction of magnetically “tagged” blood and control images (no tag) provides the perfusion-weighted signal intensity. Because the increase in signal intensity of label over control is on the order of only 1% to 2%, many repetitions of the control and label pairs are acquired during several minutes to provide the required signal to noise. The computation of absolute perfusion requires that the perfusion-weighted image be scaled by the mean signal intensity (M0) of the blood. This value is difficult to obtain, so the M0 value of the white matter is used as a surrogate.20 A segmentation step is performed on the anatomic T1-weighted images into gray and white matter, which is then applied to the M0 image from the perfusion data. The resulting absolute perfusion maps can be colorized with use of a standard scale, and a JPEG of the resulting image sections is sent to the PACS.
Discussion
Normal CBF Maps
Colorized multisection JPEG maps are generated as part of the image-processing pipeline. CBF maps are displayed with a color ramp representing units of perfusion in mL/100 g tissue/min (Fig 1). Viewed in this format, the colorized JPEG maps allow a convenient overview of global perfusion. Scrollable gray-scale maps of baseline magnetization (used for assessment of possible artifacts and other technical factors), mean perfusion images, and quantitative CBF maps are also transferred to the PACS and have full cross-referencing capabilities with the anatomic MR images.
Pediatric ASL
In pediatric patients undergoing ASL, a consistent pattern of increased signal-to-noise ratio as well as globally elevated absolute CBF has been observed compared with adults (Fig 2). Possible explanations for this globally increased signal intensity include higher baseline CBF, faster mean transit time, increased baseline magnetization values in gray and white matter, and increased T1 values in blood and tissue21 (ie, a longer tracer half-life). Decreased susceptibility artifact at the base of the skull from immature paranasal sinus development may also play a role in improved image quality and added signal intensity in the frontal and inferior regions. Pediatric CBF has been shown to begin at a low level in the perinatal period and increase to peak levels at 3 to 8 years, then gradually decrease to adult levels.21,22 From a paradoxical standpoint, ASL performed in neonates has been shown to yield negative CBF values in certain congenital heart defects due, at least in part, to small patient size relative to the labeling slab.23
Robust CBF in a pediatric patient, an 8-year-old boy with elevated CBF values in gray and white matter, a normal finding in this age group. CBF has been reported to peak around 8 years of age before gradually decreasing to normal adult levels.
Physiologic Regional Hyperperfusion
Not infrequently, regional increases in signal intensity occur in the bilateral occipital lobes corresponding to visual cortex activation (Fig 3). Perhaps a reflection of heightened sensory stimulation in the MR environment, this activation is difficult to control for in the clinical population. A hyperfrontal pattern of regional CBF distribution has also been previously described with use of various perfusion methods.24–27 This pattern is believed to be a normal finding in young and middle-aged patients and may decrease both with normal aging and with increasing cerebrovascular risk factors. A hyperfrontal pattern has also been sporadically linked with schizophrenia and other psychoses in the literature.28,29
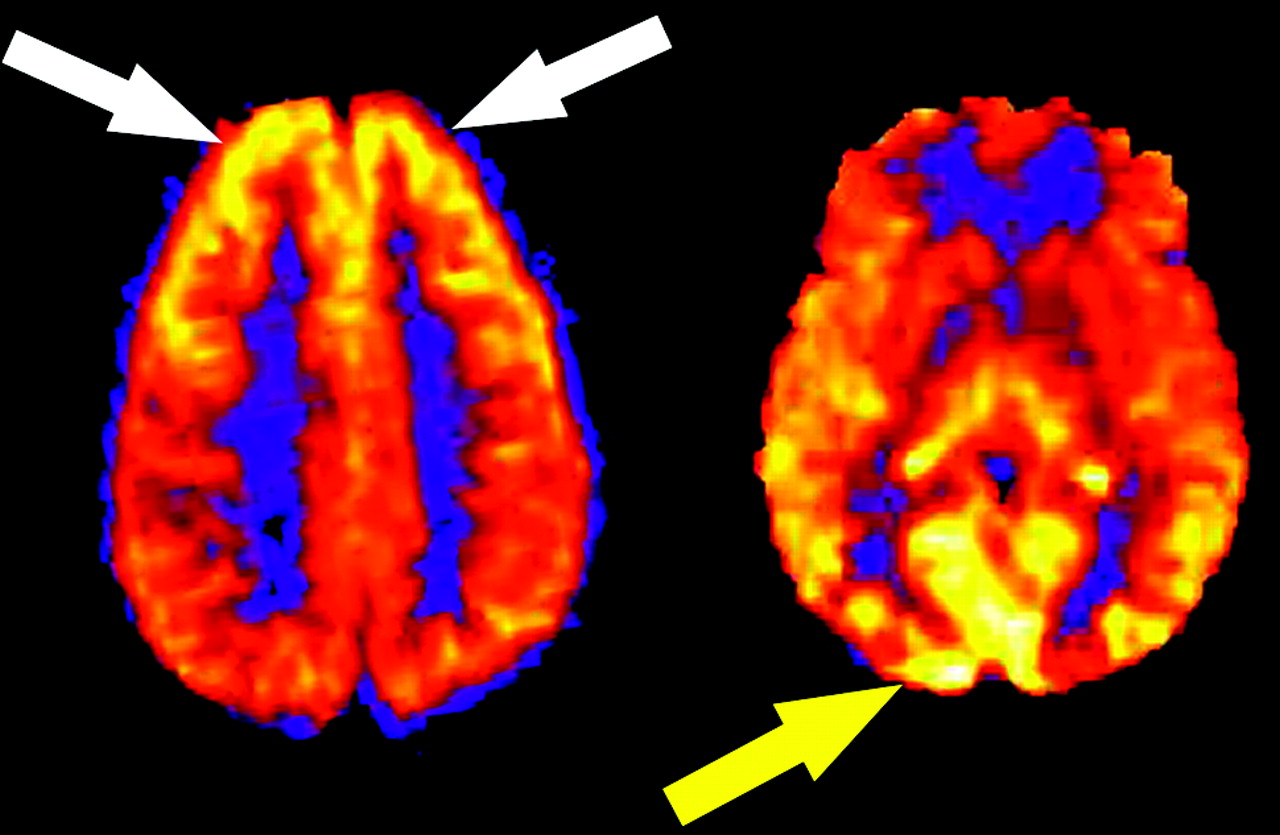
Physiologic regional distribution of spin tag. Hyperfrontal (white arrows) and visual cortex (yellow arrow) patterns of signal intensity, normal variants on ASL CBF maps.
Spin-Label Decay
The tracer in spin-tag perfusion imaging is magnetically labeled blood water, which decays with the T1 of blood (approximately 1200 ms at 1.5T). As a result, sections acquired toward the end of the volume contain less label than those acquired at the beginning. Consequently, lower perfusion signal intensity is often seen in the more rostral images of the CBF maps as images are acquired from inferior to superior (Fig 4). This effect is mitigated, given a constant delay time, at 3T as the T1 of blood is longer.30 In addition, the process of image acquisition partially destroys the labeled spins, and beginning section acquisition too far below the area of interest can compromise usable signal intensity.

Effect of spin tag decay during image acquisition. ASL CBF map shows decreased global signal intensity in the more rostral images compared with more inferior levels. Images are acquired from inferior to superior.
Tissue-Masking Effect
During postprocessing, voxels are segmented into 1 of 3 tissue types on the basis of signal intensity on the high-resolution T1-weighted images: gray matter, white matter, or CSF. These tissue maps are combined to create a tissue mask, which is then applied to the quantitative CBF images to remove scalp tissues and background noise. Although this segmentation technique is robust for healthy patients, lesions such as vascular malformations or tumors, which have very high signal intensity because of gadolinium enhancement, may be misclassified. This misclassification can result in the mask discarding relevant portions of the final image (Fig 5).
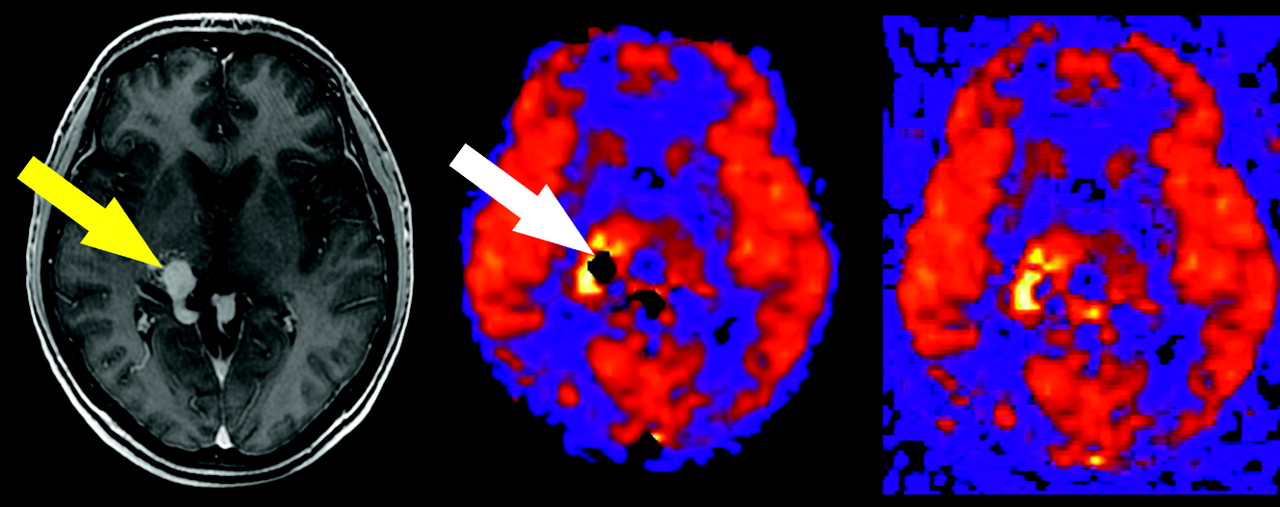
Tissue masking artifact. Postgadolinium T1-weighted image reveals a tangle of enhancing vessels in the right posterior thalamic region consistent with arteriovenous malformation (yellow arrow). The lesion is markedly hyperperfused on the ASL CBF map, but a central signal intensity void is seen because of tissue-masking error (white arrow). Corresponding unmasked image confirms the source of the artifact.
Intravascular Spin-Label
Despite the use of a crusher gradient to suppress intravascular spins, focal high-signal intensity on ASL maps may occasionally be seen in the Sylvian fissures, basal cistern regions, and dural venous sinuses, depending on the magnitude and direction of flowing spins. Linear high signal intensity may also occur as a result of slow flow within cortical vessels in the setting of acute infarct or elevated mean transit time (Fig 6). This pattern can usually be differentiated from true gyral hyperperfusion on the ASL CBF maps.

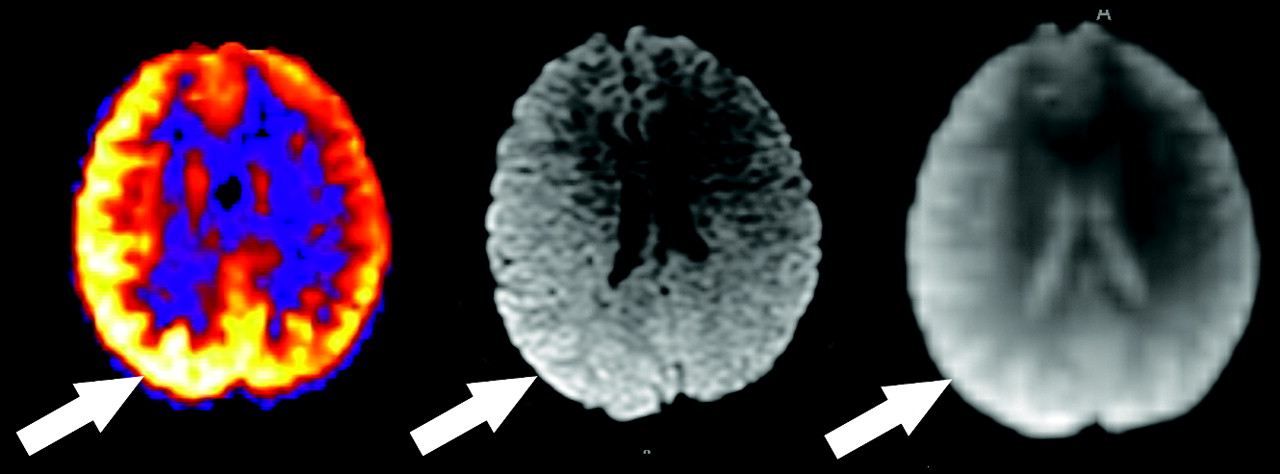
Transit time effects. Axial T2-weighted image through the cavernous sinuses revealed absence of flow void in the right internal carotid artery (not shown), indicating slow flow or occlusion. Restricted diffusion is present, which is consistent with watershed infarct (arrow). ASL CBF map reveals decreased flow in the right posterior watershed zone as well as linear high signal intensity representing slow flow in cortical vessels (arrowheads).
Susceptibility Artifact
As on any echo-planar MR imaging sequence, susceptibility artifact is represented as signal intensity void on ASL CBF maps. Metallic hardware, blood products, calcification, and air may all contribute to susceptibility effects. The presence of neurosurgical hardware near a resection cavity (Fig 7) represents a significant limitation of ASL and DSC MR imaging in the evaluation of residual or recurrent disease because of magnetic field distortion. Nonsurgical metal, such as orthodontic appliances, hair berets, and other materials may also significantly confound interpretation of ASL CBF maps by producing focally diminished signal intensity. Blood products produce local gradient susceptibility artifact and thus are seen as low signal intensity on gradient sequences, including ASL. Hemorrhagic transformation of an infarct, for example, may exaggerate the perceived perfusion deficit because of the paramagnetic effects of local blood products. Conversely, hemorrhage complicating areas of reperfusion or vasomotor instability (as in posterior reversible encephalopathy syndrome [PRES]) may mask the underlying high signal intensity on ASL CBF maps. Blooming and signal intensity dropout from the paramagnetic properties of intracranial calcification may also hinder interpretation of blood flow on ASL maps. Assessment of tumor vascularity in calcified masses such as meningiomas or oligodendrogliomas may be particularly problematic because the competing effects of susceptibility and neovascularity may coexist. Low signal intensity in the inferior frontal lobes is commonly encountered because of the aerated paranasal sinuses and air-bone interfaces at the skull base. This effect is less pronounced in pediatric ASL because of nonaerated frontal or sphenoid sinuses, or both, which may, in part, explain the higher global CBF values commonly observed in this population.6,21
Susceptibility artifact in a 5-year-old boy with previous resection of a glioma. Focally decreased signal intensity is present in the right parietotemporal region on the ASL CBF maps (arrow). The baseline magnetization map confirms the presence of metallic hardware causing magnetic field distortion (arrow).
Gadolinium Effect
Circulating gadolinium-based contrast agents significantly shorten T1 in all tissues in both the control and label conditions. The effect of this T1 shortening is to minimize the measurable differences between the spin tag and control conditions on all images, thus producing maps with almost no usable signal intensity. Therefore, care must be taken to acquire the raw ASL data at a time before gadolinium administration in any clinical protocol. Although we have observed reductions in signal-to-noise ratio on ASL studies up to several days after administration of gadolinium, this factor should not limit repeatability from day-to-day in most cases.
Baseline Magnetization Artifact (M0“Shinethrough”)
The relative increase in signal intensity from magnetically tagged spins entering the imaging section in ASL is on the order of only approximately 1% to 2%. As such, effective saturation of background signal intensity must occur to allow the spin-tag signal intensity to be recognized. If failure of this suppression occurs, T2-weighted signal intensity from the background tissue can dominate the signal intensity averaging and subtraction process and will result in large amounts of global signal intensity. This effect is shown in Fig 8, with characteristic bright signal intensity in the lateral ventricles and supraphysiologic CBF values in gray matter structures.

Globally increased ASL signal intensity due to artifact. Perfusion pattern appears normal except for high signal intensity in the lateral ventricles (arrows), due to shinethrough of T2-weighted signal intensity that was not adequately suppressed during only 1 volume (vol 10). Vol 11 represents a normal control-label image subtraction obtained during signal intensity averaging.
Motion Artifact
Motion is a common problem in most clinical MR examinations, particularly in hospitalized patients. Various factors make even small amounts of motion a significant source of error in clinical ASL, despite the use of signal intensity averaging and spatial coregistration steps. Motion artifact may produce increases or decreases in signal intensity on a focal or global basis. The most consistent motion-related pattern we have observed is a peripheral ring of high signal intensity (Fig 9).

Artifact secondary to motion. A peripheral ring of high signal intensity is a common finding in ASL cases degraded by motion (arrow).
Coil Sensitivity Artifact
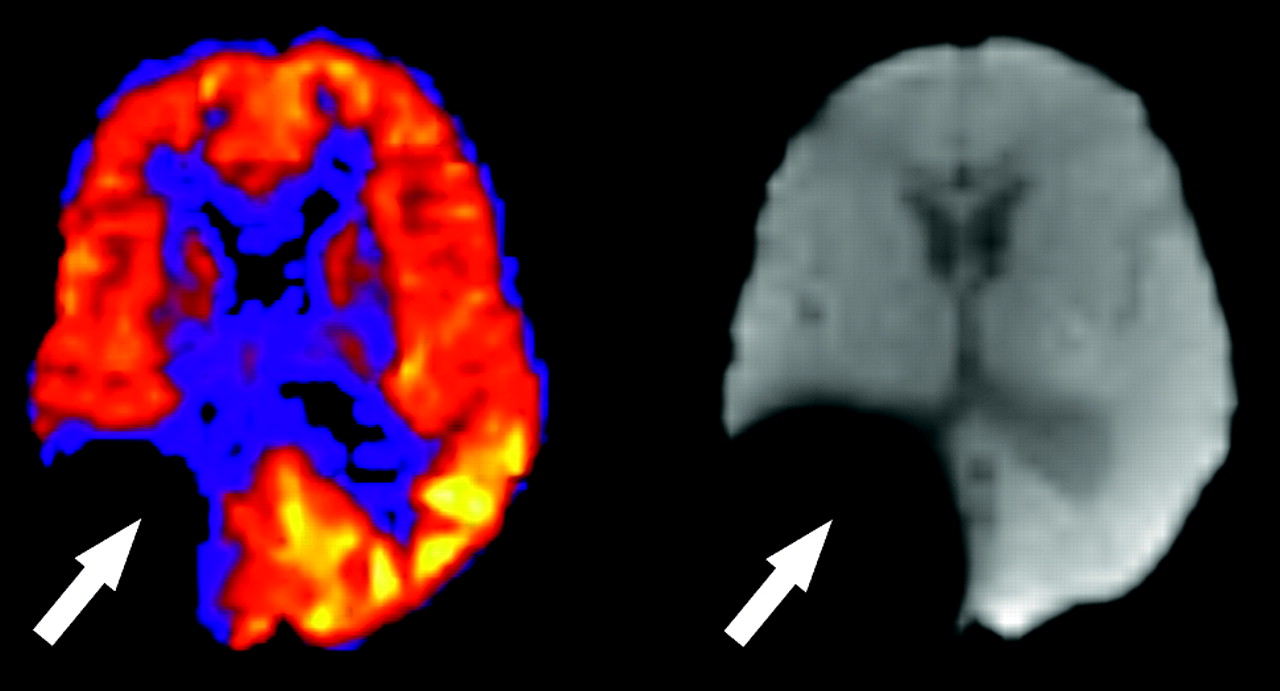
Asymmetric coil sensitivity can lead to increase in the regional perfusion signal intensity adjacent to the problematic coil. This artifact can be detected by analysis of the M0 or diffusion-weighted image, which will also show a corresponding area of increased signal intensity (Fig 10). This is secondary to patient head positioning or asymmetric coil sensitivity within the head coil array. If this artifact is detected, the ASL sequence can be repeated after repositioning the head or by use of an alternative coil. Future applications of ASL may include an M0 weighting factor to compensate for coil sensitivity issues.
Artifact secondary to asymmetric coil sensitivity. There is a regional zone of high perfusion signal intensity in the right cerebral hemisphere that corresponds to the same zone of high signal intensity on the diffusion image and the M0.
Limitations of ASL
As a technique, ASL has limitations. In general, ASL suffers from relatively low signal-to-noise ratio, a problem which can be amplified in the clinical population because of patient lack of cooperation, vascular disease, and artifacts. Assumptions regarding tagging efficiency, delay time to imaging (TI2), and flow quantification are based on predominantly normal populations in the research setting, and their translation to disease states has not been rigorously tested. Finally, additional investigations are needed to define the impact of heart rate and cardiac output variations on image quality as well as how factors such as anemia may affect well-accepted parameters such as the T1 of blood used to quantify CBF. For these reasons, clinical ASL has been used largely as a semi-quantitative tool at our institution, though studies are currently in progress with the goal of defining ranges of tissue-specific perfusion in large clinical cohorts.
Conclusion
Knowledge of common imaging artifacts and processing-related factors will allow correct interpretation of apparent high or low signal intensity on the final CBF maps. In the ASL-processing pipeline currently used at our institution, several intermediate and ancillary image volumes are generated, which may contain additional information useful in the interpretation of the final CBF maps. These include the mean perfusion image, the baseline magnetization image (M0), the unfiltered maps (before filtering of sections with aberrant signal intensity or motion parameters), and the unmasked maps before the application of tissue-based masking to remove unwanted extracerebral signal intensity, primarily scalp soft tissues and background noise. Many of the artifacts shown in our study can be eliminated or significantly improved with the use of a filtering technique on the basis of exclusion of individual control or label sections with excessive motion or aberrant signal intensity. This filter has salvaged several clinical ASL cases, which would have been otherwise uninterpretable because of transient radio-frequency amplifier or other scanner malfunction or a brief but significant motion.
Acknowledgments
We thank Kathy Pearson for her assistance with computer programming.
Footnotes
This study was supported by the Human Brain Project and the National Institute of Biomedical Imaging and Bioengineering through grants EB004673, EB004673-02S2, and EB003880. This study was also partially supported by the Center for Biomolecular Imaging of Wake Forest University School of Medicine.
References
- Copyright © American Society of Neuroradiology
In this issue


Jump to section
Related Articles
Cited By...
- Anoxic Brain Injury Detection with the Normalized Diffusion to ASL Perfusion Ratio: Implications for Blood-Brain Barrier Injury and Permeability
- Response Assessment in Neuro-Oncology Criteria for Gliomas: Practical Approach Using Conventional and Advanced Techniques
- ExploreASL: an image processing pipeline for multi-center ASL perfusion MRI studies
- Comparison of CBF Measured with Combined Velocity-Selective Arterial Spin-Labeling and Pulsed Arterial Spin-Labeling to Blood Flow Patterns Assessed by Conventional Angiography in Pediatric Moyamoya
- Cerebral Blood Flow and Marrow Diffusion Alterations in Children with Sickle Cell Anemia after Bone Marrow Transplantation and Transfusion
- Cerebral Perfusion Is Perturbed by Preterm Birth and Brain Injury
- Can Arterial Spin-Labeling with Multiple Postlabeling Delays Predict Cerebrovascular Reserve?
- Lower cardiac index levels relate to lower cerebral blood flow in older adults
- Perfusion MR Imaging Using a 3D Pulsed Continuous Arterial Spin-Labeling Method for Acute Cerebral Infarction Classified as Branch Atheromatous Disease Involving the Lenticulostriate Artery Territory
- Improving the Grading Accuracy of Astrocytic Neoplasms Noninvasively by Combining Timing Information with Cerebral Blood Flow: A Multi-TI Arterial Spin-Labeling MR Imaging Study
- Medial Occipital Lobe Hyperperfusion Identified by Arterial Spin-Labeling: A Poor Prognostic Sign in Patients with Hypoxic-Ischemic Encephalopathy
- Raw Arterial Spin Labeling Data Can Help Identify Arterial Occlusion in Acute Ischemic Stroke
- Bright Vessel Appearance on Arterial Spin Labeling MRI for Localizing Arterial Occlusion in Acute Ischemic Stroke
- Arterial Spin-Labeled Perfusion Imaging in Acute Ischemic Stroke
- Arterial Spin-Labeling Assessment of Normalized Vascular Intratumoral Signal Intensity as a Predictor of Histologic Grade of Astrocytic Neoplasms
- Arterial Spin-Labeled Perfusion of Pediatric Brain Tumors
- Arterial Spin-Labeled Perfusion Imaging Reflects Vascular Density in Nonfunctioning Pituitary Macroadenomas
- Does MR Perfusion Imaging Impact Management Decisions for Patients with Brain Tumors? A Prospective Study
- Quantitative Blood Flow Measurements in Gliomas Using Arterial Spin-Labeling at 3T: Intermodality Agreement and Inter- and Intraobserver Reproducibility Study
- Arterial spin labeling and altered cerebral blood flow patterns in the minimally conscious state
- Arterial Spin-Labeling MRI Can Identify the Presence and Intensity of Collateral Perfusion in Patients With Moyamoya Disease
- The Acetazolamide Challenge: Techniques and Applications in the Evaluation of Chronic Cerebral Ischemia
- Pulsed Arterial Spin-Labeled MR Imaging Evaluation of Tuberous Sclerosis
- Hypercapnia-Induced Cerebral Hyperperfusion: An Underrecognized Clinical Entity