
Abstract
BACKGROUND AND PURPOSE: Quantitative susceptibility mapping is useful for assessing iron deposition in the substantia nigra of patients with Parkinson disease. We aimed to determine whether quantitative susceptibility mapping is useful for assessing the lateral asymmetry and spatial difference in iron deposits in the substantia nigra of patients with Parkinson disease.
MATERIALS AND METHODS: Our study population comprised 24 patients with Parkinson disease and 24 age- and sex-matched healthy controls. They underwent 3T MR imaging by using a 3D multiecho gradient-echo sequence. On reconstructed quantitative susceptibility mapping, we measured the susceptibility values in the anterior, middle, and posterior parts of the substantia nigra, the whole substantia nigra, and other deep gray matter structures in both hemibrains. To identify the more and less affected hemibrains in patients with Parkinson disease, we assessed the severity of movement symptoms for each hemibrain by using the Unified Parkinson's Disease Rating Scale.
RESULTS: In the posterior substantia nigra of patients with Parkinson disease, the mean susceptibility value was significantly higher in the more than the less affected hemibrain substantia nigra (P < .05). This value was significantly higher in both the more and less affected hemibrains of patients with Parkinson disease than in controls (P < .05). Asymmetry of the mean susceptibility values was significantly greater for patients than controls (P < .05). Receiver operating characteristic analysis showed that quantitative susceptibility mapping of the posterior substantia nigra in the more affected hemibrain provided the highest power for discriminating patients with Parkinson disease from the controls.
CONCLUSIONS: Quantitative susceptibility mapping is useful for assessing the lateral asymmetry and spatial difference of iron deposition in the substantia nigra of patients with Parkinson disease.
ABBREVIATIONS:
- aSN
- anterior part of the substantia nigra
- CN
- caudate nucleus
- GP
- globus pallidus
- mSN
- middle part of the substantia nigra
- PD
- Parkinson disease
- pSN
- posterior part of the substantia nigra
- PT
- putamen
- QSM
- quantitative susceptibility mapping
- RN
- red nucleus
- S
- susceptibility
- SN
- substantia nigra
- UPDRS
- Unified Parkinson's Disease Rating Scale
Parkinson disease (PD) is characterized by the progressive loss of dopaminergic neurons in the substantia nigra (SN).1 Histologic studies showed that the vulnerability of dopaminergic neurons varies spatially within the SN of patients with PD. This loss is more severe in the SN pars compacta, particularly in the ventrolateral tier.1⇓⇓–4 The increased iron in the SN pars compacta of patients with PD may promote oxidative stress harmful to dopaminergic neurons.5⇓⇓⇓–9 Devos et al,10 who measured the level of SN iron on MR imaging in their clinical outcome assessment, reported a disease-modifying PD therapy by using deferiprone iron chelation.
Devos et al10 used R2* maps derived from gradient-echo data that are sensitive to nigral iron in patients with PD.11⇓⇓⇓⇓⇓⇓⇓⇓–20 However, R2* depends not only on the iron distribution in an object but also on the object orientation, the surrounding iron distribution (blooming artifacts), and the imaging parameters, including the TE, voxel size, and field strength.21,22 This dependence renders the use of R2* problematic for performing multicenter, cross-scanner longitudinal studies.
Quantitative susceptibility mapping (QSM) is a novel technique that calculates tissue magnetic susceptibility in vivo. It eliminates the blooming artifacts by deconvolving the susceptibility-generated magnetic field.23⇓⇓⇓⇓⇓⇓–30 Postmortem studies revealed a strong correlation between the iron concentration and QSM-measured susceptibility in the deep gray matter,31 and QSM can be used to measure nigral iron accumulation in PD.32⇓–34 However, it can be difficult to identify the SN pars compacta on MR imaging scans,13,35 and nigral iron measurements are easily contaminated by the adjacent subthalamic nucleus.35⇓⇓–38 Consequently, the asymmetry and spatial difference in the accumulation of iron in the SN of patients with PD have not been fully evaluated with QSM, to our knowledge.
We describe a practical method to evaluate the subdivision of the SN. Our study aimed at determining whether QSM is useful for detecting asymmetry and spatial differences in the accumulation of iron in the SN of patients with PD.
Materials and Methods
Subjects
The local ethics committee of Kumamoto University approved this study, and all subjects provided prior written informed consent. The patients were 16 women and 8 men ranging in age from 35 to 77 years (mean, 63.3 years). They were seen between April 2013 and November 2014 in Kumamoto University Hospital. Their clinical characteristics are summarized in Table 1. Ten patients underwent deep brain stimulation after MR imaging studies. The clinical diagnosis of PD was based on the UK Parkinson's Disease Society Brain Bank criteria.39 Clinical disease severity of movement symptoms was assessed by using the motor section of the Unified Parkinson's Disease Rating Scale (UPDRS III) in the “on” state. According to a previous article,40 the total daily levodopa-equivalent dose of patients with PD in our study ranged from 200 to 1016 mg (mean, 456.2 ± 265.5 mg). For the more and less affected body sides, the lateralized UPDRS III motor score on each side was calculated (sum of items, 20–26). The contralateral hemibrain of the more affected body side was defined as the more affected, and the other, as the less affected hemibrain.19
Demographics and clinical status of the study participants
The controls were 24 age- and sex-matched healthy volunteers (15 women, 9 men), ranging in age from 39 to 81 years (mean, 64.1 years); they were recruited from Kumamoto University Hospital staff and the local community. Volunteers with a history of cardiovascular, metabolic, neurologic, and psychiatric disorders or brain abnormalities on MR imaging were excluded from this study.
MR Imaging
Brain MR imaging scans were acquired on a 3T MR imaging system (Magnetom Trio; Siemens, Erlangen, Germany) by using 12-channel head coils. All scans were in the axial plane parallel to the anterior/posterior commissure line. A 3D multiecho gradient-echo sequence was acquired; the parameters were TE = 6.2/12.4/18.6/24.8/31.0/37.2/43.4/49.6 ms; FOV = 24 cm; matrix = 256 × 256 mm2; flip angle = 15°; voxel size = 0.9 × 0.9 × 2.0 mm3; scan time = 5 minutes 35 seconds. The MR imaging protocol also included fluid-attenuated inversion recovery, turbo spin-echo T2-weighted, diffusion-weighted, and 3D T1-weighted magnetization-prepared rapid acquisition of gradient echo acquisitions.
The 3D multiecho gradient-echo data were used for generating QSM images; QSM was generated by using a morphology-enabled dipole inversion method and the complex data.25,41,42
Image Analysis
The susceptibility (S) of the deep gray matter structures was determined by using ImageJ software (National Institutes of Health, Bethesda, Maryland). For the major deep gray matter structures, excluding the SN, the mean S value of the bilateral globus pallidus (GP), red nucleus (RN), putamen (PT), and caudate nucleus (CN) were measured on axial QSM by 2 neuroradiologists (M.A. and Y.I., with 5 and 9 years of MR imaging experience, respectively). They were blinded to clinical and neurologic findings and independently placed ROIs on the structures (Fig 1). The unit of S measured on QSM was expressed as parts per billion.

A 59-year-old woman with Parkinson disease. A, QSM, axial section at the level of the basal ganglia. ROIs as large as possible were placed. Areas encircled in red, green, and blue are the caudate nucleus, putamen, and globus pallidus. B, QSM, axial section at the level of the midbrain. The encircled area identifies the red nucleus medial to the substantial nigra.
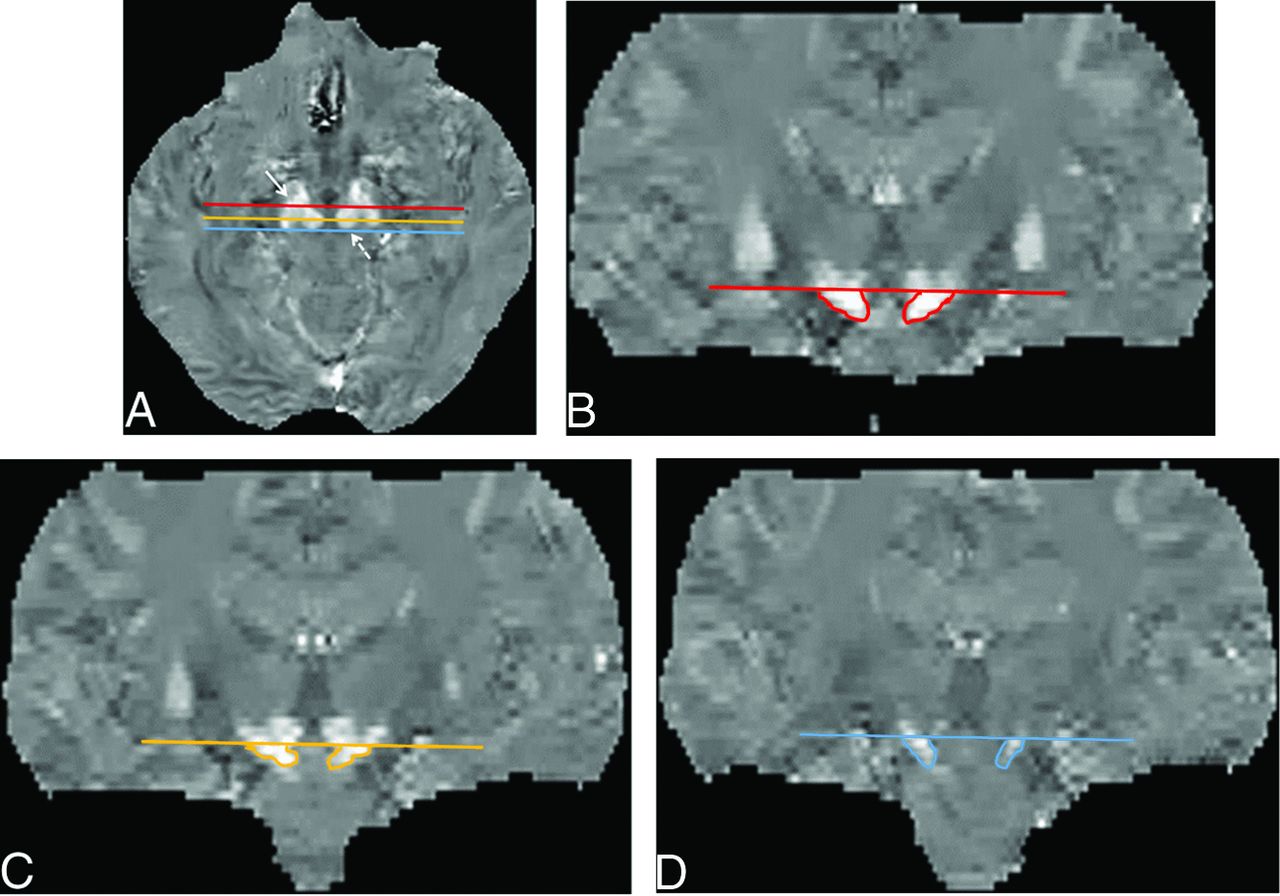
To measure the S value of the SN, we used coronal multiplanar reconstruction images to place an ROI in the SN with reference to the Schaltenbrand and Wahren atlas.36,37 We selected 3 coronal multiplanar reconstruction images at the level of the anterior, middle, and posterior edges of the RN on axial images to measure the spatial susceptibility differences in the anterior, middle, and posterior parts of the SN (aSN, mSN, and pSN) (Fig 2). To avoid contamination by the subthalamic nuclei,36,37 we placed ROIs on the aSN, mSN, and pSN inferior to the caudal edge of the RN (Fig 2). The averaged value of the aSN, mSN, and pSN was defined as the value of the whole SN.

ROIs on the substantia nigra on QSM images. Multiplanar reconstruction coronal images were selected at the 3 planes, that is, the anterior (red line), middle (light orange line), and posterior (blue line) edges of the red nucleus on axial QSM images (A), to measure spatial susceptibility differences in the anterior, middle, and posterior parts of the SN. To avoid contamination by the subthalamic nuclei, we placed an ROI on the aSN (B), mSN (C), and pSN (D) below the caudal edge of the RN on coronal QSM images. The averaged value of the aSN, mSN, and pSN was defined as the value of the whole SN. Solid arrow indicates the SN; dotted arrow, the RN.
Statistical Analysis
We used the paired t test to assess the difference in the UPDRS III motor score between more and less affected body sides.
The 2 observers' measurements were averaged for each structure. Interobserver agreement for the 2 observers' measurements was assessed by using the intraclass correlation coefficient, in which an intraclass correlation coefficient of <0.40 = poor, 0.40–0.59 = fair, 0.60–0.74 = good, and >0.74 = excellent.43 The paired t test was used to assess differences in the S value of the hemibrains of healthy controls. Differences between the healthy controls and the patients with PD were determined with the Bonferroni correction. P < .05 was considered to indicate a statistically significant difference. To assess the sensitivity and specificity of QSM for discriminating patients with PD from healthy subjects, we performed receiver operating characteristic analysis. The cutoff value for S was determined by using the maximum value of the Youden index.
Results
There was a significant difference in the UPDRS III motor scores between more and less affected body sides in patients with PD (P < .001) (Table 1). The more affected hemibrain was right in 19 and left in 5 patients. The intraclass correlation coefficient values for 2 observers' measurements ranged from 0.8291 to 0.9644 for the S values, and all values showed excellent agreement (Tables 2 and 3).
Interobserver agreement for the ROI measurements: healthy controls, right and left hemibrain
Interobserver agreement for the ROI measurements: patients with PD, more and less affected hemibrain
The mean S value for the GP, RN, PT, CN, whole SN, aSN, mSN, and pSN in healthy controls is shown in Table 4. The highest S value was found in the GP, followed by the RN, whole SN, PT, and CN. Between the right and left hemibrains, there was no significant difference in the S values of any of the structures. The highest S value was observed in the aSN, followed by the mSN and pSN.
Hemispheric differences in mean susceptibility (parts per billion) in each structure of healthy controlsa
In Table 5 and Fig 3, we compare the mean S value of each structure in the controls and in the more and the less affected hemibrains of patients with PD. In the patients, the order of the mean S values, from high to low, was the following: GP, whole SN, RN, PT, and CN. The mean S value of the mSN, pSN, and whole SN in the more and the less affected hemibrains was significantly higher in patients than in controls (P < .05). In the pSN, the mean S value was significantly higher for the more affected hemibrain than for the less affected hemibrain (P < .05).
Comparison of the mean susceptibility values between healthy controls and the more and less affected hemibrains of patients with PDa
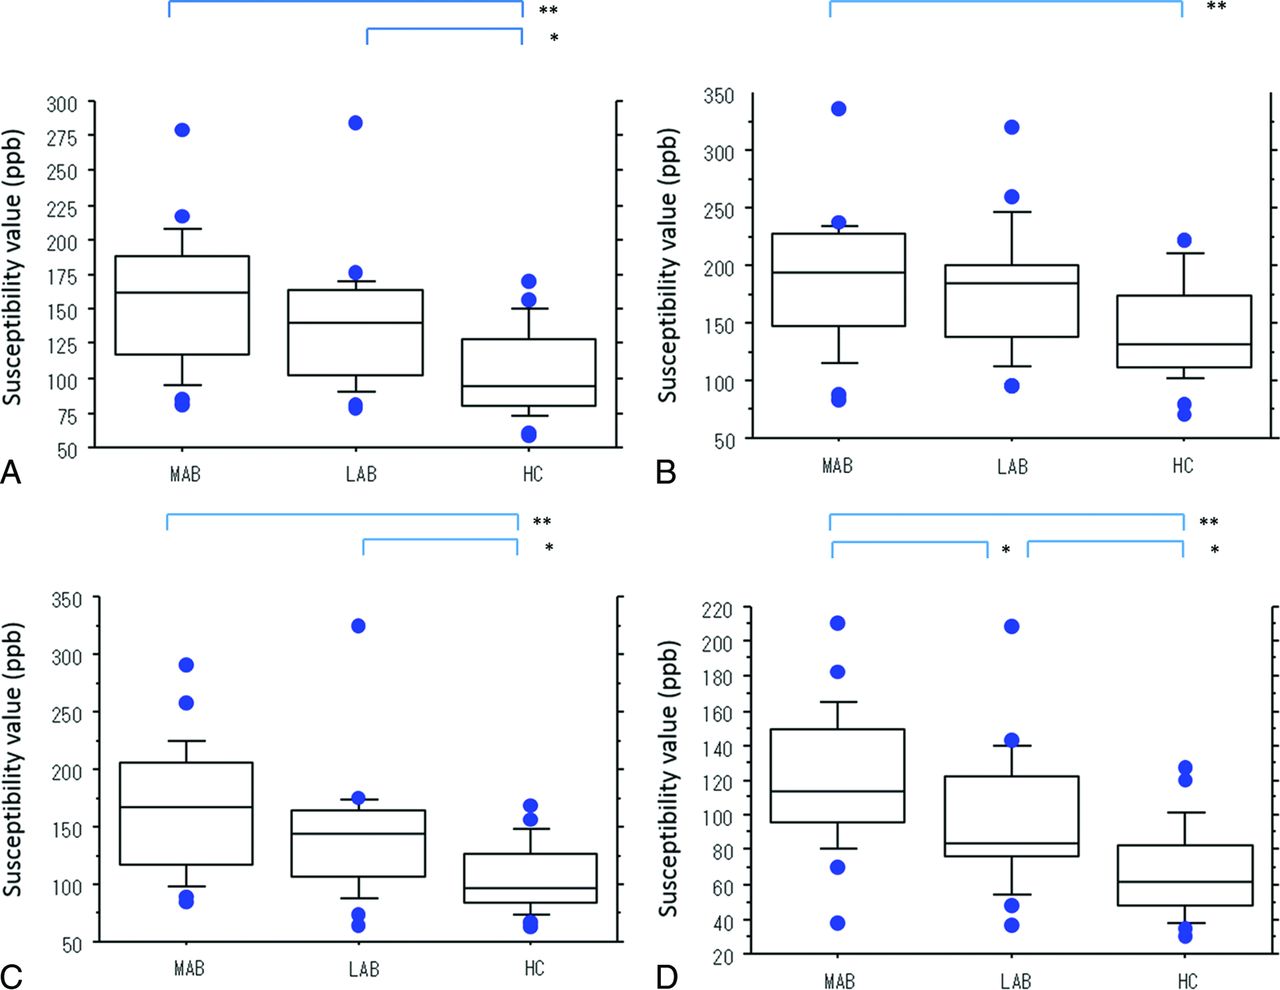
Boxplots of the mean susceptibility value (in parts per billion) of the more and the less affected hemibrains in patients with PD and healthy controls. Mean susceptibility values of the whole (A), anterior (B), middle (C), and posterior (D) parts of the substantia nigra. Lines in boxes indicate the median; lower and upper limits of boxes, the 25th and 75th percentiles, respectively; and whiskers, the 10th and 90th percentiles. Outliers are shown as individual points. One asterisk indicates P < .05; double asterisks, P < .001. ppb indicates parts per billion; MAB, more affected hemibrain; LAB, less affected hemibrain; HC, healthy controls.
In the patients with PD, there was no significant difference in the mean S value of the GP, RN, PT, and CN between the more and the less affected hemibrains. The mean S value of the GP and PT tended to be lower in the patients with PD than in the controls.
Receiver operating characteristic analysis showed that the area under the curve was highest (0.887) for the mean S value of the pSN in the more affected hemibrain (Table 6 and Fig 4); at a cutoff value of 68 parts per billion, sensitivity and specificity were 95.8% and 70.8%.
Area under the curve and sensitivity and specificity of QSM for discriminating patients with PD from healthy subjects

Diagnostic performance of QSM of the substantia nigra for discriminating patients with PD from healthy subjects. A, More affected hemibrain versus healthy controls. B, Less affected hemibrain versus healthy controls for the whole SN, and the anterior, middle, and posterior parts of the SN, respectively.
Discussion
Susceptibility in the mSN, pSN, and the whole SN was significantly higher in the more and the less affected hemibrains of patients with PD than in the healthy controls. Our findings agree with those of Barbosa et al33 and Murakami et al,34 who also used QSM. However, the latter did not address iron variation within the SN, and the former used QSM generated by truncated k-space division, which is known to be poorer than QSM generated by morphology-enabled dipole inversion.24 Their area under the curve was 0.77 for discriminating patients with PD from healthy controls; our area under the curve was 0.887.
We also found lateral asymmetry of iron deposition in the SN of patients with PD. Compared with the less affected hemibrain, susceptibility was significantly higher in the pSN of the more affected hemibrain. This lateral asymmetry was compatible with the manifestation of asymmetric signs and symptoms in PD. Earlier studies by using QSM33,34 did not detect susceptibility asymmetry in the SN of patients with PD. Unlike those investigations, our study avoided contamination by subthalamic nuclei because our evaluation was based on 3 coronal planes. All patients included in our study presented with asymmetric signs and symptoms. We posit that this and application of our new evaluation method affected the findings.
Although the highest susceptibility value was observed in the aSN, followed by the mSN and the pSN in healthy controls, the highest area under the curve in patients with PD was obtained for the susceptibility value of the pSN in the more affected hemibrain. This suggests that QSM can measure spatial differences in susceptibility within the SN of patients with PD. This spatial difference may be explicable by earlier neuropathologic and 7T MR imaging findings. Degeneration of dopaminergic neurons is greatest in the ventrolateral tier of the SN pars compacta and least in the dorsomedial tier.1⇓⇓⇓⇓⇓⇓–8,18 The ventrolateral tier is located mostly lateral and posterolateral to the RN2,3,18 and corresponds to the mSN and pSN. On the other hand, the dorsomedial tier is located mostly anterolateral to the RN2,3 and corresponds to the aSN.
In PD, iron increases within degenerated dopaminergic neurons in the SN.8,18 We did not subdivide the SN into pars compacta and pars reticulate layers. Although some MR imaging studies have shown the subdivision of the SN pars compacta and the SN pars reticulate, the definition of the 2 areas on MR images is not clear.13,14,35 Studies of the 3D structure of the SN pars compacta in humans indicated a complex organization with clusters of tyrosine hydroxylase–positive neurons extending into the SN pars reticulate.44 Consequently, the histologic determination of a boundary between the 2 areas in humans may be difficult, and it is even more difficult to resolve this issue at an MR imaging in-plane resolution of 0.9 mm. Instead, we chose to evaluate the spatial heterogeneity of the SN along its anteroposterior line, which approximates the rostral-caudal axis used in pathology studies, without a subdivision into the pars compacta and the pars reticulate.
According to histochemical studies, gray matter structures with a decreasing order of iron content are the GP, RN, SN, PT, and CN.41 This order agrees with the order of susceptibility values in our healthy controls, suggesting that they are correlated with the accumulation of iron in the deep gray matter. In addition, in postmortem studies, the chemically determined iron concentration was strongly correlated with the QSM-determined susceptibility in the deep gray matter,31 indicating that QSM measures iron in brain tissues.
The mean susceptibility value of the GP and PT in our patients with PD tended to be lower than that in the controls (Table 4). This finding is consistent with pathologic studies showing that iron in the GP and PT of patients with PD is lower than that in healthy controls.5,6 Earlier MR imaging studies also demonstrated a decrease in the iron content of the GP and PT in patients with PD compared with healthy controls.42 On the basis of the model of functional neuroanatomy of the basal ganglia, the activity of the GABAergic pathway from the PT to the GP is increased in patients with PD.45 Evidence indicates that the use of gamma-aminobutyric acid leads to a reduction in the iron concentration.46 Therefore, the iron decrease in the PT and GP of the PD brain may be explained by the altered metabolism of gamma-aminobutyric acid.42
Our study has some limitations. First, we did not mention the relationship between S value and progression of PD. As PD progresses, there are longitudinal changes in the R2* values in the SN.19,20 Others33,34 reported that QSM is superior to R2* mapping for the diagnosis of PD. Further QSM studies are needed to clarify the longitudinal changes for the spatial susceptibility difference in the SN in patients with PD. Second, the number of subjects in this study was relatively small. While we observed a susceptibility increase in the SN, we noted only a trend for a decrease in the PT and GP. Our findings warrant further studies with larger populations. Third, we did not evaluate differences in the susceptibility values between PD and other parkinsonian syndromes.
Conclusions
Our study demonstrated a practical method to assess nigral iron accumulation using QSM. Our observations showed that QSM is useful for assessing the lateral asymmetry and spatial difference of iron deposition in the SN of patients with PD.
Footnotes
Disclosures: Satoshi Yamashita—UNRELATED: Grants/Grants Pending: Grants-in-Aid for Science Research from the Ministry of Education, Culture, Sports, Science and Technology of Japan.* Yi Wang—RELATED: Grant: National Institutes of Health (R01 EB013443)*; UNRELATED: Grants/Grants Pending: National Institutes of Health; Patents (planned, pending or issued): Cornell University,* Comments: one of the inventors of QSM technology. *Money paid to the institution.
This work was supported in part by the National Institutes of Health (R01 EB013443).
Indicates open access to non-subscribers at www.ajnr.org
References
- Received July 22, 2015.
- Accepted after revision October 3, 2015.
- © 2016 by American Journal of Neuroradiology


Jump to section
Related Articles
Cited By...
- Microstructure-Informed Myelin Mapping (MIMM) from Gradient Echo MRI using Stochastic Matching Pursuit
- Magnetic susceptibility is predictive of future clinical severity in Parkinsons disease
- Comparison between Dual-Energy CT and Quantitative Susceptibility Mapping in Assessing Brain Iron Deposition in Parkinson Disease
- Transient swelling in the globus pallidus and substantia nigra in childhood suggests SENDA/BPAN