
Abstract
BACKGROUND AND PURPOSE: DSC perfusion MR imaging assumes that the contrast agent remains intravascular; thus, disruptions in the blood-brain barrier common in brain tumors can lead to errors in the estimation of relative CBV. Acquisition strategies, including the choice of flip angle, TE, TR, and preload dose and incubation time, along with post hoc leakage-correction algorithms, have been proposed as means for combating these leakage effects. In the current study, we used DSC-MR imaging simulations to examine the influence of these various acquisition parameters and leakage-correction strategies on the faithful estimation of CBV.
MATERIALS AND METHODS: DSC-MR imaging simulations were performed in 250 tumors with perfusion characteristics randomly generated from the distributions of real tumor population data, and comparison of leakage-corrected CBV was performed with a theoretic curve with no permeability. Optimal strategies were determined by protocol with the lowest mean error.
RESULTS: The following acquisition strategies (flip angle/TE/TR and contrast dose allocation for preload and bolus) produced high CBV fidelity, as measured by the percentage difference from a hypothetic tumor with no leakage: 1) 35°/35 ms/1.5 seconds with no preload and full dose for DSC-MR imaging, 2) 35°/25 ms/1.5 seconds with ¼ dose preload and ¾ dose bolus, 3) 60°/35 ms/2.0 seconds with ½ dose preload and ½ dose bolus, and 4) 60°/35 ms/1.0 second with 1 dose preload and 1 dose bolus.
CONCLUSIONS: Results suggest that a variety of strategies can yield similarly high fidelity in CBV estimation, namely those that balance T1- and T2*-relaxation effects due to contrast agent extravasation.
ABBREVIATIONS:
- AIF
- arterial input function
- Bidir
- bidirectional leakage correction algorithm
- CNR
- contrast-to-noise ratio
- EES
- extravascular extracellular space
- Ktrans
- efflux rate of contrast agent from the vasculature
- rCBV
- relative CBV
- Unidir
- unidirectional leakage correction algorithm
DSC-MR imaging is a PWI technique based on the indicator-dilution theory,1 which uses the first pass of a paramagnetic contrast agent to estimate cerebrovascular parameters, including relative CBV (rCBV) and CBF.2,3 A primary clinical application for rCBV includes the evaluation of brain tumor vascularity and angiogenesis; however, neovascularity within neoplasms tends to have elevated vascular permeability, resulting in contrast agent leakage into the extravascular extracellular space (EES) and violation of assumptions made by the indicator-dilution theory. These “leakage effects,” which can be either T1-weighted, which would cause underestimation of the rCBV, or T2*-weighted, which would cause overestimation of the rCBV, greatly depend on the acquisition strategy and protocol used for DSC-MR imaging signal acquisition.4 To address these problems, strategies have been proposed for reducing the influence of contrast agent leakage, many focusing on T1-weighted artifact reduction, including use of low flip angles,5 dual-echo acquisitions,6⇓–8 preload administration,9 and/or postprocessing leakage-correction algorithms.10⇓⇓–13
Previous studies have used a combination of these strategies to reduce extravasation-induced error of CBV estimates; however, these approaches have primarily been evaluated empirically. The goal of this study was to systematically evaluate, with simulation, the effects of various leakage-correction strategies on the fidelity of CBV estimation using simulated DSC-MR imaging data derived from the convolution theory14 and recent developments by Quarles et al.15 We hypothesized that this approach could provide insight into the interaction of pulse sequence parameters, preload dosing, and leakage-correction algorithms that are not readily determined experimentally.
Materials and Methods
Simulation Procedure
The following common DSC-MR imaging protocol variables were evaluated by using simulations: pulse sequence parameters, including flip angle, TE, and TR; preload dose and incubation time; truncation of the DSC-MR imaging dataset after first pass to limit postbolus leakage contamination; and postprocessing leakage-correction algorithms. Simulated DSC-MR imaging signal curves for brain tumors were generated via the following: 1) selection of pulse sequence parameters; 2) construction of the DSC-MR imaging relaxivity–time-series without leakage for “ground truth rCBV”; 3) construction of the leakage-affected intravascular and EES contrast agent concentration–time-series based on tumor characteristics; and 4) estimation of CBV by using no leakage correction, unidirectional leakage correction (Unidir) as described by Boxerman et al,10 or bidirectional leakage correction (Bidir) accounting for bidirectional contrast agent flux between the vasculature and EES.11,13
Simulated DSC-MR Imaging Relaxation Rate–Time Curve
The simulated DSC-MR imaging relaxation rate–time curve is derived from the gradient-echo signal equation, which has signal contributions from both T1 and T2. When the MR imaging signal intensities, which have arbitrary units, are converted to (ΔR*2(t), in units of 1/s, these contributions are modeled for a single-shot gradient-echo EPI acquisition as the following15:
 where α is the flip angle; E1 = e−TR/T10; subscripts E, I, and P represent the extravascular, intracellular, and plasma compartments, respectively; v represents the volume fraction; K represents “calibration susceptibility factors”; C represents contrast agent concentration; and r1 and r*2 are the T1 and T2 gadolinium relaxivities, respectively. The first term, r*2,PCp(t) represents the T2* contribution of the plasma concentration of contrast agent; the second term, r*2,ECE(t) represents the extravascular extracellular contrast agent contribution to T2*; KPVPVE|CP − CE|, represents the T2*-weighted contribution owing to the difference in the concentration of contrast agent between the vasculature and the EES; and
  represents the T1 contribution of contrast agent in both the plasma and EES.
Pulse Sequence Parameters
We tested all combinations of the following DSC-MR imaging parameters: flip angle = 35°, 60°, and 90°; TE = 15, 25, 35, 45, and 55 ms; TR = 1.0, 1.5, and 2.0 seconds; fractional preload + bolus dosage = ¼ + ¾ (6 mmol/L total, single dose), ½ + ½ (6 mmol/L total, single dose), and 1 + 1 (12 mmol/L total, double dose), in which a different value of peak arterial input function (AIF) concentration would simply scale all relaxivity–time curves proportionally.
Construction of Blood Plasma and EES Concentration
A generic AIF, which models the input of contrast agent into the tissue vasculature, was generated by using the following γ-variate-like approximation:
 where A = 200 mmol/L s, B = 1.75 mmol/L, and tp = 2 seconds (from Simpson et al16) and the peak concentration was 6.0 mmol/L for the full dose and scaled appropriately for the preload dosages and postpreload bolus injections. For preload simulations, the composite AIF was constructed as the superposition of the preload injection AIF and the bolus AIF was delayed by the specified incubation time.
The blood plasma contrast agent concentration was computed by convolving the AIF with an exponential residue function, where the residue function describes the tracer retention; the convolution is used to describe the AIF as a series of narrow, instantaneous boluses of contrast agent; and the CBF factor accounts for the proportionality of the concentration in the vasculature to the delivered blood14:
 where ρ is the density of brain tissue (1.04 g/mL), and kH is the hematocrit difference between capillaries and large vessels (0.73).17
The EES contrast agent concentration was computed by using a 2-compartment pharmacokinetic model as follows:
 where Ktrans describes the efflux rate of contrast agent from the vasculature, often equated with permeability, and Ktrans/νe describes the rate of contrast agent influx back into the vasculature.
The relaxivity-time curves were obtained from Equation 1. For each relaxivity–time curve, the baseline signal was calculated as the median of the first 30 seconds of the signal.
Tissue, Contrast Agent, and Noise Characteristics
Specific tumor characteristics were estimated on the basis of previous data from Schmiedeskamp et al,17 including CBV = 5 mL/100 g, CBF = 60 mL/100 g/min, and T*20 = 0.05 seconds. The blood volume fraction, vp, was set equal to ρ/kH × CBV. Relaxivity values for gadobutrol (Gadavist; Bayer Schering Pharma, Berlin, Germany) were assumed to be r1 = 3.6 mmol/L−1s−1 18, r2,P* = 87 mmol/L−1s−1,19 and r*2,E = 30 mmol/L−1s−1.7 Monte Carlo simulations were performed by using the following values: Ktrans = 0.214 ± 0.04 minute−1 (range = 0.114 − 0.318), ve = 0.722 ± 0.17 (range = 0.259 − 0.985), T10 = 1.59 ± 0.40 seconds (range = 0.84 − 2.87), r*2,P = 87.0 ± 17.4 mmol/−1s−1 (range = 42.4 − 132), and r*2,E = 30 ± 6 mmol/L−1s−1 (range = 14.4 − 45.5). νe was limited to a maximum of 1, and T10 was limited to a minimum of white matter (832 ms).20
Ktrans and νe were chosen by using the average values and SDs from Zhang et al.21 T10 was estimated from variable flip angle mapping from 25 glioblastomas (5 precontrast T1 flip angle maps were acquired for each patient [2°, 5°, 10°, 15°, 30°]) and fitted by using a Levenberg-Marquardt nonlinear approach to the gradient-echo signal equation. The variances for r*2,P and r*2,E are, to the best of our knowledge, not well-defined in the literature and were chosen to be 20% to approximately match the SDs of the other parameters. Kp, the susceptibility calibration factor, was chosen to generate a 40% peak signal drop in gray matter, for which CBF = 60 mL/100 g/min and CBV = 4 mL/100 g were chosen.22 The whole-brain average was selected as the average of 1000 white matter voxels (including noise), with CBF = 25 mL/100 g/min and CBV = 2 mL/100 g.
Contrast-to-noise ratio (CNR) was first measured in a sample of 25 human glioblastomas (flip angle = 35°, TE = 32 ms, and TR = 1.8 seconds), which had a CNR of 40.5. To model noise added by the TE and TR used, we scaled the CNR by C × sin(α) × e−TE/T*2(1 − e−TR/T1)/sin(35°) × e−0.032/T*2(1 − e−1.8/T1), where the numerator incorporates the dose (C) of the new protocol and TE, TR, the flip angle, and the denominator scales the CNR according to the parameters used in acquiring the human data.
The CNR, which is defined with the following equation, was used to calculate SD23,24:
 where ΔR*2,max is the maximum value of ΔR*2 and σ is the SD of the Gaussian noise added to each time point. Gaussian noise was added with mean of zero and a SD of σ.
Leakage Correction Algorithms
Uncorrected CBV was computed by integrating ΔR*2(t), while leakage-corrected CBV was obtained by using either Unidir10 or Bidir11,13 leakage-correction algorithms. The “ground truth” (ΔR*2(t)gt) estimate of CBV was calculated under conditions of no noise with Ktrans = 0. The percentage error from ground truth was calculated for uncorrected and leakage-corrected CBV estimates with added noise.
Effects of Preload Incubation Time and Truncation of the DSC Time-Series
To estimate the effects of preload incubation time, we compared estimates of CBV with delays of 5–10 minutes between preload and bolus injection. To estimate the effects of truncating ΔR*2(t) on CBV estimates, we compared CBV estimates by using the first 30, 60, 90, or 120 seconds of the postbaseline ΔR*2(t) as well as the entire 150-second data.
Monte Carlo Simulations to Estimate CBV Confidence Intervals
For each set of pulse sequence parameters, Gaussian noise was added to each time point with normal distribution (zero mean, SD equal to the maximum signal scaled by the CNR), and tumor characteristics were generated according to the normal distributions described previously. A Monte Carlo simulation was conducted by using 250 randomly chosen tumors, with random noise, for each set of pulse sequence parameters. Percentage error was calculated by using the computed CBV and the ground truth CBV. The 95% confidence intervals of percentage error were subsequently generated for the uncorrected CBV, and each of the leakage-correction algorithms and are shown in each of the figures. For Figs 1⇓–3, 1 particular protocol (flip angle = 60°, TE = 35 ms, TR = 1.0 s, ¼ preload dose + ¾ DSC-MR imaging, waiting time = 5 minutes) was chosen as the template based on American Society of Functional Neuroradiology recommendations,25 with variations to only 1 of the parameters shown for each subfigure. For Fig 4, all combinations of flip angle, TR, TE, and preload dosage were evaluated. For all figures, integration of the relaxivity–time curve was performed from the injection time point to the end (2.5 minutes), unless otherwise noted.

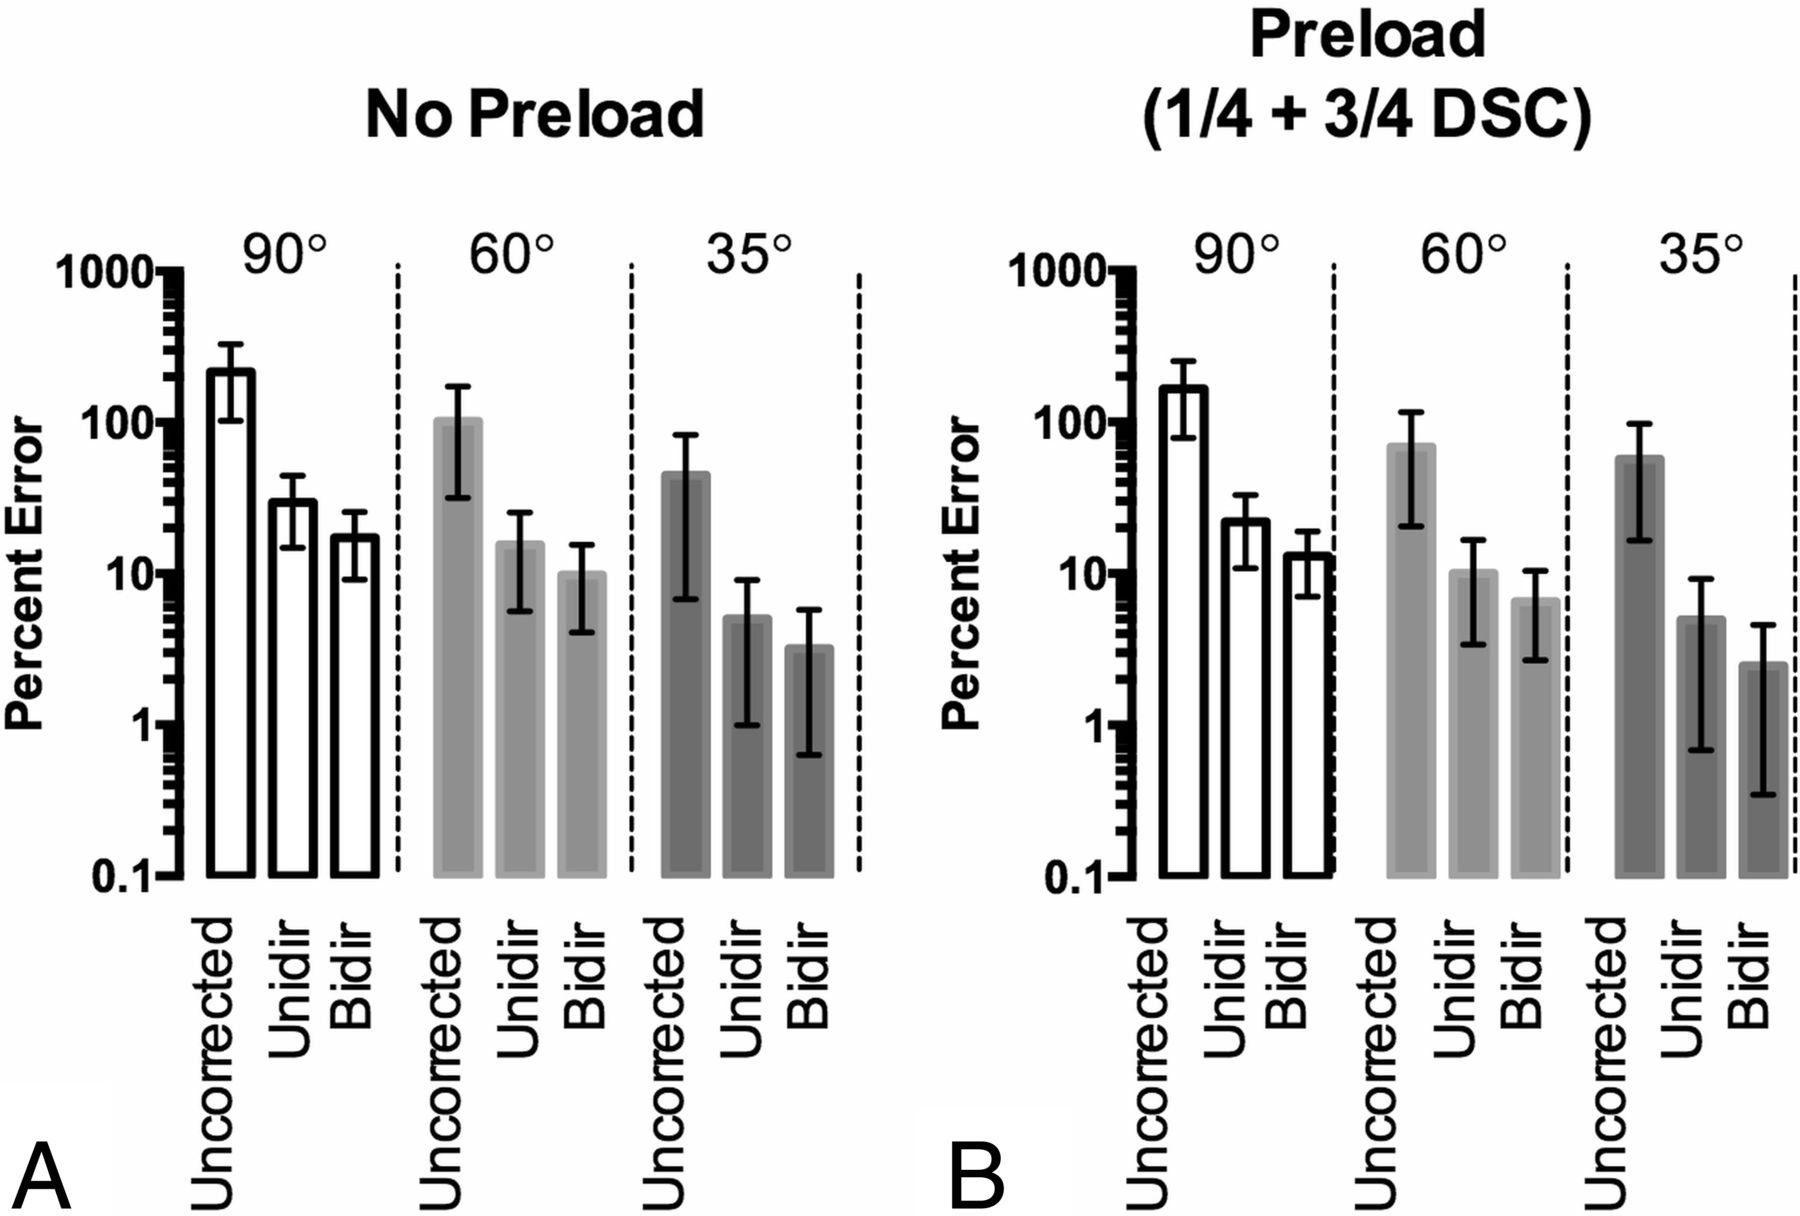
Effect of the flip angle on recovery of CBV (TE = 35 ms/TR = 1.0 second). A, Percentage error (with 95% CI) of the estimated CBV for different flip angles and leakage-correction strategies, without the use of preload, compared with ground truth CBV. B, Percentage error (with 95% CI) of the estimated CBV for different flip angles and leakage-correction strategies, with use of ¼ dose preload, compared with ground truth CBV.
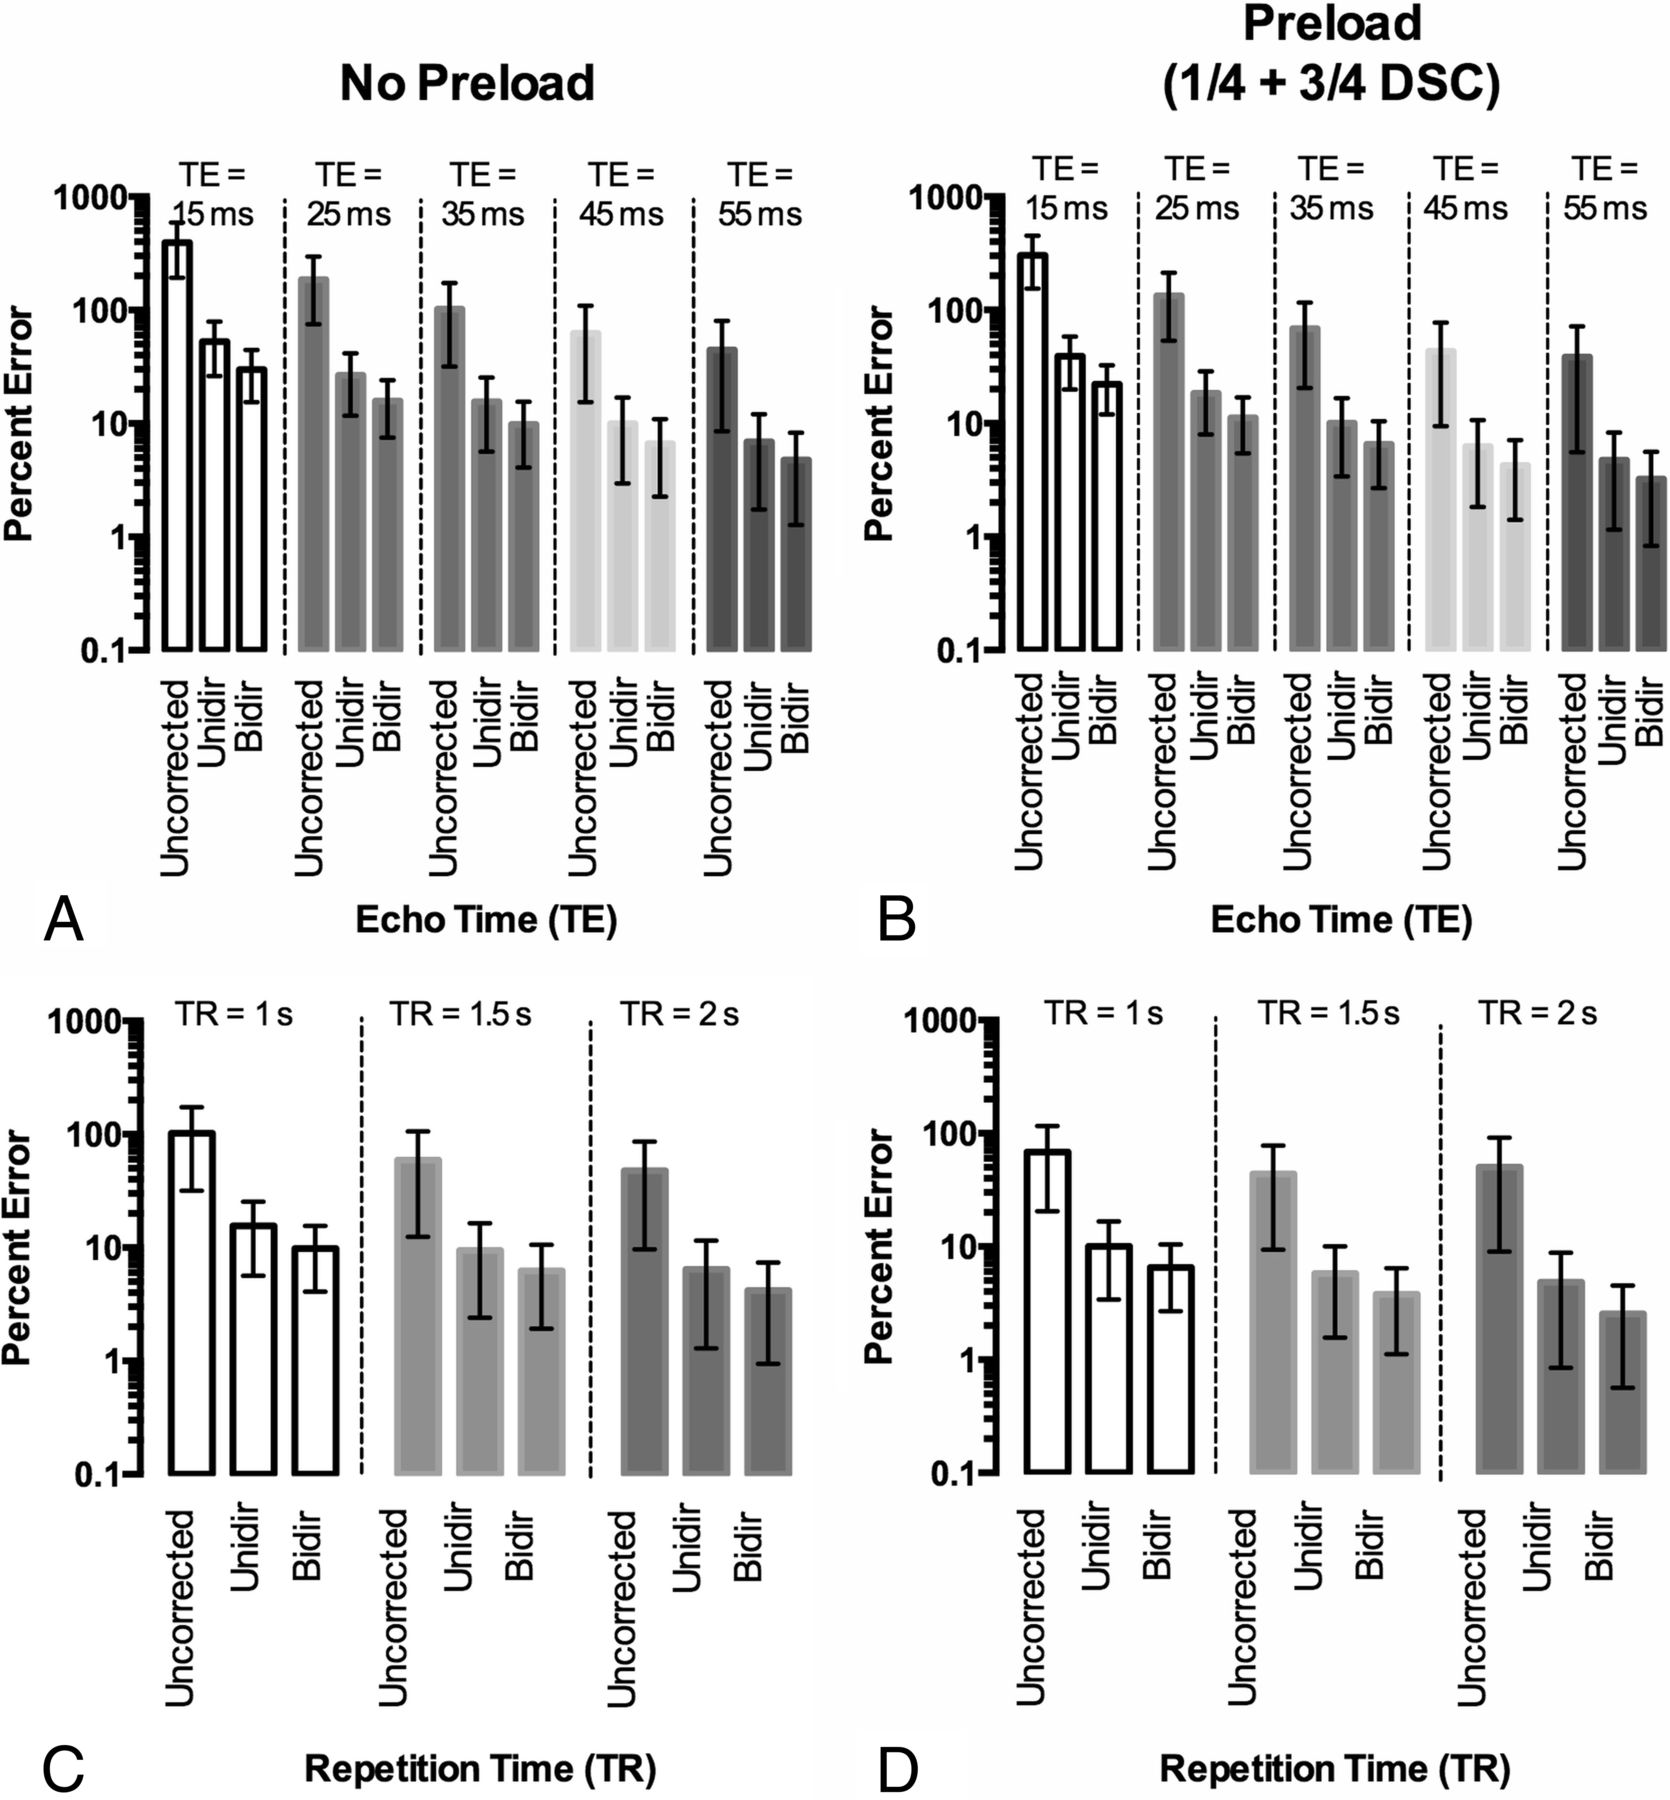
Effect of TE and TR on CBV accuracy with flip angle = 60°. A, Percentage error in CBV estimation for different TEs by using TR = 1.0 second without preload. B, Percentage error in CBV estimation for different TEs by using TR = 1.0 second with ¼ dose preload. C, Percentage error in CBV estimation for different TRs with a 60° flip angle and TE = 35 ms with no preload. D, Percentage error in CBV estimation for different TRs with a 60° flip angle and TE = 35 ms with a ¼ dose preload.

Effects of preload dosage, incubation time, and truncation of corrected ΔR*2(t) on CBV fidelity. A, Percentage errors in CBV for each preload dosage with 95% CI. The best performance was obtained with 1-dose preload and 1-dose DSC-MR imaging bolus when using TE = 35 ms, TR = 1.0 second, and flip angle = 60°. Note the increased T2*-weighting from a full-dose preload decreases the CBV error when using these acquisition parameters. B, Effects of preload incubation time on CBV estimation when using preload. C, Effects of truncation of the ΔR*2(t) curves and leakage-correction strategies on CBV estimation when using a 1-dose preload followed by a 1-dose DSC bolus injection.

Heat map diagrams depicting the percentage error in the CBV estimation for combinations of acquisition protocols with Bidir. Each quadrant within each subfigure represents a different preload dose. Each subfigure represents a different flip angle: 90° (A), 60° (B), and 35° (C). Optimal strategies balance T1-weighted and T2*-weighted effects from contrast agent extravasation via a combination of TE, TR, and preload. Red boxes indicate acquisition protocols with minimum error, while blue boxes indicate protocols with poor CBV fidelity (high error compared with ground truth).
Results
Without preload, there is reduced T1-weighting and increased T2*-weighting with smaller flip angles as manifested by higher ΔR*2(t), best seen in the “tail” (On-line Fig 1A). Preload administration increases T2*-weighting of the signal (On-line Fig 1B). In this case, without preload, the 35° relaxivity–time curve is closest to ground truth (ΔR*2(t)gt), while the 60° and 35° curves are equally close to the truth curve after preload (¼ dose + ¾ dose DSC-MR imaging). On the basis of the formula used for CNR, the 35° flip angle also yielded the most noise, as exemplified in the preload DSC-MR imaging curve. For both nonpreload and preload administration, Unidir-corrected ΔR*2(t) varied more from ΔR*2(t)gt across all tested flip angles compared with Bidir-corrected ΔR*2(t), particularly right after the first pass of the bolus (On-line Fig 1C–F). Figure 1A, -B illustrates the percentage errors for uncorrected, Unidir, and Bidir CBV estimates, compared with ΔR*2(t)gt, for different flip angles. With this particular combination of TR/TE/preload dosage, the 35° flip angle had the lowest error. Furthermore, error after both Unidir and Bidir leakage corrections tracked with error in the uncorrected CBV (ie, the lower error in uncorrected CBV corresponded with lower error after leakage correction). For all tested flip angles, uncorrected CBV estimates had the highest error, followed by the Unidir and then the Bidir estimates.
Results indicate longer TEs increase the T2*-weighting of ΔR*2(t) (On-line Fig 2A, -B; flip angle = 60°, TR = 1.0 second). Without preload (Fig 2A), TE = 55 ms yielded the most accurate ΔR*2(t) for all 3 correction strategies by using all leakage-correction strategies. With ¼ dose preload (Fig 2B), TE = 45–55 ms had smaller error than without preload, though the 55 ms performed slightly better. Post hoc leakage-correction error tracked with uncorrected error in these examples. Results also suggest an increased T2*-weighting (or decreased T1-weighting) with longer TRs (On-line Fig 2C, -D). Independent of preload, TR ≥ 1.5 seconds yielded ΔR*2(t) with less error compared with ΔR*2(t)gt for a 60° flip (Fig 2C, -D) for the chosen flip angle, TE, and preload dosage. In general, CBV error with the 3 methods was linearly correlated.
Preload primarily increases T2*-weighting and reduces T1-weighting in ΔR*2(t) (On-line Fig 3A; flip angle = 60°, TE = 35 ms, TR = 1.5 seconds). For these parameters, 1 preload + 1 bolus dosing yielded higher ΔR*2(t) fidelity compared with ground truth ΔR*2(t) than the ¼ + ¾ and ½ + ½ dosing schemes (Fig 3A). Even though the ½ + ½ and 1 + 1 dosing schemes had approximately the same uncorrected CBV percentage error, the post hoc leakage-correction algorithms benefited from the higher CNR that the full DSC-MR imaging dose provides. Results also suggest that preload does not act by decreasing the concentration-dependent rate of contrast agent efflux, but rather by decreasing baseline tissue T1 before bolus injection, as well as increasing T2*-weighting, as evidenced by identical wash-in rates and concentration-dependent reductions in baseline T1 (On-line Fig 3B, -C).
With incubation times of 5–10 minutes, the change in CBV error is virtually similar, with a slight, gradual decrease in error from 5 to 10 minutes (Fig 3B). Next, because CBV is computed from the integration of ΔR*2(t), 1 strategy for mitigating leakage effects is truncating ΔR*2(t) after the first pass. As expected, the less data used for computing CBV, the lower is the percentage error for uncorrected CBV. For Unidir CBV, mean percentage error is lowest when 30 seconds is used and gradually increases with time. For Bidir CBV, percentage error was approximately the same for all cutoff times (Fig 3C).
The protocol with the lowest overall mean percentage error used a 60° flip angle, TE/TR = 35/1000 ms with 1 dose preload, by using the bidirectional correction; however, there were multiple protocols whose 95% CIs overlapped (On-line Table), suggesting there are several strategies that could be used to get similar CBV estimates. In general, the best performing strategies (dark red areas in Fig 4 and On-line Fig 4) were those that balanced both T1- and T2*-weighting secondary to contrast agent extravasation, with a mean uncorrected CBV error of <70% for all the “optimal” strategies with 1 total dose of contrast and <80% for those with 2 total doses of contrast agent, as opposed to a much larger error for other protocols. Preload did not necessarily depress percentage error, as evidenced by the 35° flip angle, in which higher preload dosages could “overshoot” the “ground truth.” The acquisition strategies with the lowest mean error in this simulation (flip angle/TE/TR) for each preload dosing were the following: 1) with no preload and full dose for DSC-MR imaging: 35°/35 ms/1.5 seconds; 2) with ¼ dose preload and ¾ dose bolus: 35°/25 ms/1.5 seconds; 3) with ½ dose preload and ½ dose bolus: 60°/35 ms/2.0 seconds; and 4) with 1-dose preload and 1-dose bolus: 60°/35 ms/1.0 second. The 90° flip angle only appeared as an optimal strategy with 1-dose preload and 1-dose bolus.
Discussion
The purpose of this study was to evaluate the influence of various DSC-MR imaging acquisition strategies and post hoc leakage-correction algorithms on the fidelity of the estimation. In general, the performance of both leakage-correction algorithms improves as the leakage-contaminated ΔR*2(t) curve more closely approximates ΔR*2(t)gt. Furthermore, a much more “homogeneous” performance is seen for the double dose because many more protocols were “optimal” with the double dose. This finding would seem to imply that this scheme is less sensitive to the physiologic variations that would impact the estimates of ΔR*2(t).
As has been established previously, increased T2*-weighted leakage results from a lower flip angle, longer TR, longer TE, and higher preload dosage.15,26 Given that the errors before and after leakage correction are generally correlated, the optimal strategies minimize errors in uncorrected rCBV, which can be accomplished by balancing T1- and T2*-weighted leakage effects. Therefore, the optimal protocols balance these 2 opposing effects so that the DSC-MR imaging curves do not deviate too much from the ground truth. For example, a TR of 1.0 second, which is relatively T1-weighted, can be offset with a full dose of preload, which is quite T2*-weighted. Some of the optimal protocols, on the other hand, take a middle-of-the-road approach (ie, 60° flip angle or TE = 35 ms) so that none of the parameters cause the DSC-MR imaging curves to be overly affected by T1-weighted or T2*-weighted leakage effects.
Our results also suggest that the mechanism by which preload increases CBV fidelity is by increasing T2*-weighting and decreasing T1-weighting of the ΔR*2(t) curves rather than by decreasing the flux of contrast agent diffusion into the EES. While preload and postprocessing leakage-correction algorithms have been shown to work synergistically in many cases, including intermediate-to-high flip angle acquisitions,9 it is also possible for preload to overcompensate and worsen the deviation of the leakage-contaminated ΔR*2(t) curve compared with the ground truth; Hu et al27 drew the same conclusion. Furthermore, sufficient preload correction was found between 6 and 10 minutes, which agrees with the findings of Hu et al27 and Kassner et al.28
The bidirectional leakage correction accounts for backward flux of contrast agent and was shown to reduce CBV error compared with the unidirectional leakage correction in all 180 acquisition scenarios tested. Both leakage-correction algorithms work by first performing a least-squares fit of the model-generated corrected ΔR*2(t) curve plus the leakage term, and then subtracting the original ΔR*2(t) curve by the calculated leakage term. Thus, if the computed leakage term does not include back flux of contrast agent, it can cause the corrected ΔR*2(t) curve to adopt a shape noticeably different from Cp (Equation 3), thereby overestimating and underestimating the ground truth curve immediately following the first pass of the bolus. Thus, CBV estimates obtained by using the unidirectional algorithm have approximately twice the error compared with estimates obtained by using the bidirectional leakage-correction algorithm.
The study has several notable limitations. First, we did not account for errors arising from either variations in MTT (including bolus dispersion) or bolus delay, both of which would serve to increase the percentage error for the leakage-correction algorithms presented in the study due to MTT sensitivity. Therefore, the percentage errors are meant to be relative, with many of the optimal protocols providing a balance between T1 and T2* leakage effects over the population of tumors. Another limitation is the lack of more sophisticated integration of all of the effects of microvascular and microcellular morphologies on DSC-MR imaging data, including, but not limited to, the arbitrary geometry of the underlying vessels.29,30 Furthermore, the noise modeled does not take into account potential sources, such as coil quality, section thickness, and the use of a global AIF. Much of the population data used for these tumors were acquired in small cohorts, and a study in a larger population would be required for more accurate modeling of the tumor population characteristics, particularly r*2. Finally, the results in the simulation warrant validation in real patients. Testing every combination of MR imaging protocol is infeasible in real patients. Furthermore, it is currently impossible to ascertain the ground truth rCBV; however, these results could be validated in real brain tumors by using an extension of the Paulson and Schmainda4 methodology, in which the top performing protocols are tested against each other for variability between scans.
Conclusions
The current study demonstrates that the choice of image acquisition and preload dosing and/or fractionation has tremendous impact on the fidelity of CBV estimation. Results suggest that a variety of acquisition strategies can be used to obtain similar accuracy of CBV estimation, while the bidirectional leakage-correction algorithm aids in minimizing errors in CBV estimation under all scenarios. To compute the most accurate CBV, one should focus on standardizing a DSC-MR imaging acquisition strategy that minimizes errors in the underlying leakage-contaminated ΔR*2(t) curve by balancing T1 and T2* contamination effects over the tumor population, which will, in turn, reduce the residual errors in CBV estimation following leakage correction.
Footnotes
Disclosures: Benjamin M. Ellingson—UNRELATED: Consultancy: MedQIA, Siemens, Roche, Agios Pharmaceuticals, Bristol-Meyer Squib, Nativis, Insys Therapeutics, Omniox; Grants/Grants Pending: Siemens, Roche.
This work was supported by the American Cancer Society Research Scholar Grant RSG-15-003-01-CCE (B.M.E.); the National Brain Tumor Society Research Grant (B.M.E.); the Siemens Healthcare Research Grant (B.M.E.); and the University of California, Los Angeles Medical Scientist Training Program (K.A.B.L.).
References
- Received July 17, 2016.
- Accepted after revision October 4, 2016.
- © 2017 by American Journal of Neuroradiology


Jump to section
Related Articles
Cited By...
- "Synthetic" DSC Perfusion MRI with Adjustable Acquisition Parameters in Brain Tumors Using Dynamic Spin-and-Gradient-Echo Echoplanar Imaging
- Performance of Standardized Relative CBV for Quantifying Regional Histologic Tumor Burden in Recurrent High-Grade Glioma: Comparison against Normalized Relative CBV Using Image-Localized Stereotactic Biopsies
- Utility of Percentage Signal Recovery and Baseline Signal in DSC-MRI Optimized for Relative CBV Measurement for Differentiating Glioblastoma, Lymphoma, Metastasis, and Meningioma
- Moving Toward a Consensus DSC-MRI Protocol: Validation of a Low-Flip Angle Single-Dose Option as a Reference Standard for Brain Tumors
- Brain DSC MR Perfusion in Children: A Clinical Feasibility Study Using Different Technical Standards of Contrast Administration
- Multisite Concordance of DSC-MRI Analysis for Brain Tumors: Results of a National Cancer Institute Quantitative Imaging Network Collaborative Project