
Abstract
BACKGROUND AND PURPOSE: Increasing DTI studies have demonstrated that white matter microstructural abnormalities play an important role in type 2 diabetes mellitus–related cognitive impairment. In this study, the diffusional kurtosis imaging method was used to investigate WM microstructural alterations in patients with type 2 diabetes mellitus and to detect associations between diffusional kurtosis imaging metrics and clinical/cognitive measurements.
MATERIALS AND METHODS: Diffusional kurtosis imaging and cognitive assessments were performed on 58 patients with type 2 diabetes mellitus and 58 controls. Voxel-based intergroup comparisons of diffusional kurtosis imaging metrics were conducted, and ROI-based intergroup comparisons were further performed. Correlations between the diffusional kurtosis imaging metrics and cognitive/clinical measurements were assessed after controlling for age, sex, and education in both patients and controls.
RESULTS: Altered diffusion metrics were observed in the corpus callosum, the bilateral frontal WM, the right superior temporal WM, the left external capsule, and the pons in patients with type 2 diabetes mellitus compared with controls. The splenium of the corpus callosum and the pons had abnormal kurtosis metrics in patients with type 2 diabetes mellitus. Additionally, altered diffusion metrics in the right prefrontal WM were significantly correlated with disease duration and attention task performance in patients with type 2 diabetes mellitus.
CONCLUSIONS: With both conventional diffusion and additional kurtosis metrics, diffusional kurtosis imaging can provide additional information on WM microstructural abnormalities in patients with type 2 diabetes mellitus. Our results indicate that WM microstructural abnormalities occur before cognitive decline and may be used as neuroimaging markers for predicting the early cognitive impairment in patients with type 2 diabetes mellitus.
ABBREVIATIONS:
- AD
- axial diffusivity
- AK
- axial kurtosis
- CC
- corpus callosum
- DKI
- diffusional kurtosis imaging
- FA
- fractional anisotropy
- HbA1c
- glycosylated hemoglobin
- lEC
- left external capsule
- MD
- mean diffusivity
- MK
- mean kurtosis
- RD
- radial diffusivity
- rPF_WM
- right prefrontal white matter
- RK
- radial kurtosis
- RT of ANT
- reaction time of Attention Network Test
- T2DM
- type 2 diabetes mellitus
Type 2 diabetes mellitus (T2DM) is a common metabolic disorder with an increasing worldwide prevalence,1 and is widely accepted as a risk factor associated with mild cognitive impairment and dementia.2,3 A number of neuroimaging studies have demonstrated that GM structural abnormalities4⇓–6 might account for cognitive deficits in patients with T2DM. By contrast, studies on white matter structures, which play a vital role in transferring information between GM regions, are relatively rare. A few studies using the DTI method identified microstructural changes of WM in patients with T2DM,7⇓⇓⇓⇓⇓–13 and alterations of local and global network properties were also observed in patients with T2DM with the tractography method.14 In addition, the association between the WM microstructural abnormalities and cognitive performance was also revealed in patients with T2DM.7,10,12⇓–14
However, information provided by DTI was limited, partly because diffusion metrics obtained from DTI are calculated on the basis of the assumption of Gaussian diffusion of water molecules.15 However, non-Gaussian diffusion is known to be substantial16 and is believed to result from the diffusion barriers, such as cell membranes and organelles, as well as water compartments (eg, extracellular and intracellular) with altering diffusion properties. In this study, we sought to further characterize WM changes in patients with T2DM without cognitive impairment by using diffusional kurtosis imaging (DKI), which is a clinically feasible extension of DTI that enables the examination of additional non-Gaussian diffusion effects, providing both DTI-compatible diffusion metrics and additional kurtosis metrics.17 Additionally, due to the inclusion of non-Gaussian effects, DKI-derived estimates of diffusion metrics are generally more accurate than those obtained with conventional DTI,18 and the added kurtosis metrics can yield additional information about tissue microstructure beyond that provided by diffusion metrics.
The aims of this study were the following: 1) to assess the ability of DKI and DTI to identify microstructural abnormalities in patients with T2DM; 2) to investigate whether DKI-specific diffusion and kurtosis metrics could provide additional information about the WM microstructural changes; and 3) to investigate whether these microstructural abnormalities are related to clinical/cognitive variables in patients with T2DM without cognitive impairment.
Materials and Methods
Subjects
Fifty-eight right-handed patients with T2DM who met the guideline criteria of the American Diabetes Association “Diagnosis and Classification of Diabetes Mellitus”19 and did not have T2DM-related complications (retinopathy, peripheral neuropathy, and nephropathy) were enrolled. The presence of retinopathy was ascertained by using direct ophthalmoscopy, peripheral neuropathy by clinical examination, and nephropathy by a laboratory test of microalbuminuria. Exclusion criteria included a Mini-Mental State Examination score of <27, any psychiatric or neurologic disorders that could influence cognitive function, cerebrovascular accidents (screened by history and MR imaging), a self-reported history of alcohol or substance abuse, and a family history of dementia, hypertension, or hyperlipidemia. Additionally, all patients self-reported no experience of hypoglycemia during the past 2 years. Twenty-nine of the 58 patients with T2DM controlled blood glucose by using oral hypoglycemic agents, 9 patients were under treatment with insulin, 14 patients were treated with both insulin and oral hypoglycemic agents, and 6 patients were exclusively treated with moderate exercise and diet therapy (On-line Table 1). Fifty-eight euglycemic participants were recruited as healthy controls; the age, sex, and years of education of these controls were well-matched with those of patients with T2DM. Exclusion criteria for controls were the same as those for patients with T2DM.
In the morning of the day when the participants underwent MR imaging, fasting blood glucose, glycosylated hemoglobin (HbA1c), total cholesterol, triglyceride, high-density lipoprotein, and low-density lipoprotein levels were measured by standard laboratory tests after an overnight fast of at least 10 hours. Blood pressure was measured while sitting, at 3 different time points during the day, and averaged.
The protocol of this study was approved by the Ethical Committee of Tianjin Medical University General Hospital, and all participants provided written informed consent according to institutional guidelines.
Cognitive Testing
A battery of neuropsychological tests was performed to assess participants' general mental status and cognitive domains. Possible dementia was assessed by the Mini-Mental State Examination.20 Anxiety and depression were evaluated with the Self-Rating Anxiety Scale21 and Self-Rating Depressive Scale,22 respectively. Short- and long-term memory was tested by using the Auditory Verbal Learning Test.23 Working memory was assessed with the forward and backward Digit Span tests.24 Executive function was evaluated with the Wisconsin Card Sorting Test.25 A modified version26 of the Attention Network Test described by Fan et al27 was used to evaluate attention. Information-processing speed was tested with Trail-Making Test A.28
MR Imaging Data Acquisition
MR imaging data were obtained with a 3T MR imaging system (Discovery MR750; GE Healthcare, Milwaukee, Wisconsin). DKI data were acquired by using a spin-echo single-shot EPI sequence with the following parameters: TR = 5800 ms, TE = 77 ms, matrix = 128 × 128, FOV = 256 × 256 mm, in-plane resolution = 2 × 2 mm, section thickness = 3 mm without a gap, 48 axial sections, 25 encoding diffusion directions with 2 b-values (b=1000 and 2000 s/mm2) for each direction and 10 non-diffusion-weighted images (b=0 s/mm2). The total acquisition time for DKI was 5 minutes 54 seconds. Sagittal 3D T1WI was acquired by a brain volume sequence with the following parameters: TR = 8.2 ms, TE = 3.2 ms, TI = 450 ms, flip angle = 12°, FOV = 256 × 256 mm, matrix = 256 × 256, section thickness = 1 mm, no gap, and 188 sagittal sections.
Calculation of Kurtosis and Diffusion Metrics
Before the preprocessing of the diffusion data, we visually inspected all images to ensure that only volumes without visible artifacts in each subject were included in the subsequent analyses (On-line Table 2). Then, eddy current–induced distortion and motion artifacts in the DKI dataset were corrected by using affine alignment of each diffusion-weighted image to the b=0 image by using the FMRIB Diffusion Toolbox (FSL 4.0; http://fsl.fmrib.ox.ac.uk/fsl/fslwiki/FDT). After skull-stripping, the Diffusional Kurtosis Estimator (http://www.nitrc.org/projects/dke) was implemented to calculate the kurtosis and diffusion tensors by using the constrained linear least squares–quadratic programming algorithm as described previously.17 All data (b=0, 1000, 2000 s/mm2) were used for DKI fitting because DKI metrics (mean kurtosis [MK], axial kurtosis [AK], radial kurtosis [RK], fractional anisotropy [FA], mean diffusivity [MD], axial diffusivity [AD], and radial diffusivity [RD]) can only be estimated on the basis of at least 2 nonzero b-values in >15 independent directions.29
To compare the efficiency in detection of T2DM-induced changes between the DKI and classic DTI models, we additionally calculated the diffusion indices by using the classic DTI algorithm based on the monoexponential decay model and a single-tensor least squares solution with images of b=0 and 1000 s/mm2 as input.
Preprocessing of Kurtosis and Diffusion Parametric Images
The preprocessing was performed by using Statistical Parametric Mapping (SPM8; http://www.fil.ion.ucl.ac.uk/spm). First, all of the subjects' T1-weighted structural images were segmented into GM, WM, and CSF. Second, a high-dimensional Diffeomorphic Anatomical Registration Through Exponentiated Lie Algebra (DARTEL) algorithm was used to normalize these components into Montreal Neurological Institute space. Third, individual skull-stripped B0 images of DKI were affinely coregistered to the patient's skull-stripped native T1-weighted structural images and were written into the Montreal Neurological Institute space by using the deformation matrix generated by DARTEL. Then, all the parametric images (MK, AK, RK, FA, MD, AD, and RD) of each subject were transformed into the Montreal Neurological Institute space by using the deformation matrix generated by both of these registration steps and were resectioned into a voxel size of 2 × 2 × 2 mm. Finally, the images were smoothed with a Gaussian kernel of 6 × 6 × 6 mm at full width at half maximum by using SPM8. The preprocessing of DTI data was the same as that of DKI.
Statistical Analysis
Demographic and Clinical Characteristic Analyses.
The demographic and clinical data were analyzed by using the Statistical Package for the Social Sciences, Version 19.0 (SPSS; IBM, Armonk, New York). Before data analysis, we evaluated the normality of continuous variables by using the Kolmogorov-Smirnov test. Normally distributed variables were evaluated by using a 2-tailed independent samples t tests. For those variables that were non-normally distributed, the Mann-Whitney U test was used. A χ2 test was used to test the intergroup difference in sex. The significance level was set as P < .05.
Intergroup Comparisons of DKI Metrics.
To detect the intergroup differences in primary DKI metrics (FA, MD, and MK), we conducted the voxelwise General Linear Model embedded in SPM8 with group (T2DM versus controls) as the main effect and age, sex, and years of education as the nuisance regressors. The a priori WM template embedded in SPM8 binarized with a threshold of >0.5 was used as a mask to confine intergroup comparisons within WM regions. A correction for multiple comparisons was performed by using a Monte Carlo simulation (AlphaSim [http://afni.nimh.nih.gov/pub/dist/doc/program_help/AlphaSim.html] program in REST software [http://www.restfmri.net]). Parameters were the following: single-voxel P = .001; 5000 simulations; estimated full width at half maximum (FWHMx,y,z) of FA = 9.707, 10.839, 10.177 mm; FWHMx,y,z of MD = 14.156, 15.150, 15.346; FWHMx,y,z of MK = 11.629, 12.185, 12.228; cluster connection radius r = 3 mm within the WM mask with a resolution of 2 × 2 × 2 mm. The clusters with 54, 72, and 68 contiguous voxels for intergroup comparisons of FA, MD, and MK, respectively, would achieve an effective threshold of P < .05.
To further inspect the reason for the primarily altered DKI parameters (FA, MD, and MK), we drew a sphere (9 mm in diameter) centering at the peak coordinate of each cluster with a significant intergroup difference by voxelwise comparison and defined the overlapping voxels of each cluster and corresponding sphere as the ROI. Then, the average values of AD, RD, AK, and RK within corresponding ROIs were extracted, and ROI-based intergroup comparisons were further performed by using a General Linear Model after controlling for the effects of age, sex, and years of education to reveal the intergroup differences in the AD and RD values (the reason for the altered FA and MD values) and AK and RK values (the reason for the altered MK values).
Correlation Analysis.
The correlations between DKI metrics within all of the ROIs and clinical (disease duration and HbA1c)/cognitive variables in patients with T2DM and controls were analyzed by using the partial correlations after controlling for age, sex, and years of education with SPSS 19.0. The significant level was set as P < .05.
Subgroup Comparison between Patients with T2DM Treated with and without Insulin.
Considering that some of the patients were treated with insulin, we further compared the DKI metrics (ROI-based FA, MD, and MK) and the clinical/cognitive variables between 2 subgroups, which were classified according to the application of insulin, by using the General Linear Model after controlling for the effects of age, sex, and years of education with SPSS 19.0. The significant level was set as P < .05.
Comparison of DKI and DTI.
The intergroup comparisons of DTI metrics were also conducted by using voxel-based analysis, which is the same as the statistical analysis used for the DKI metrics. To verify the ability of DKI and DTI in identifying microstructural abnormalities in patients with T2DM, we overlapped the results of both DKI and DTI for observation.
Results
Demographic and Clinical Characteristic of Subjects
The demographic information and cognitive and clinical data of the 2 groups are provided in Tables 1 and 2. No significant intergroup differences were observed in terms of age, sex, years of education, and cognitive performance. Compared with the controls, patients with T2DM had increased fasting blood glucose (P < .001) and HbA1c (P < .001) levels and reduced high-density lipoprotein levels (P < .05).
Demographic and clinical informationa
Cognitive informationa
Diffusion Metrics from DKI
Patients with T2DM had significantly reduced FA values in the right prefrontal WM (rPF_WM) and the splenium of the corpus callosum (CC) compared with the controls (P < .05, AlphaSim correction) (Fig 1 and Table 3). Moreover, ROI-based intergroup comparisons showed that the RD values within the rPF_WM significantly increased in patients with T2DM compared with controls (P < .05) (Table 4); this result leads to decreased FA in patients with T2DM. However, there was no significant intergroup difference in the AD values within the rPF_WM (P > .05). The AD and RD values within the splenium of the CC significantly increased in patients with T2DM compared with controls (P < .05) (Table 4); this result leads to decreased FA in patients with T2DM.

WM regions showed significant differences in DKI metrics between patients with T2DM and controls. The regions with decreased FA (upper row), increased MD (middle row), and decreased MK (lower row) in patients with T2DM were overlapped on the FA template. Color bars represent the t values of intergroup comparisons.
Brain regions showing significant voxel-based intergroup differences in DKI metrics
Intergroup differences of the AD and RD values that contributed to the altered FA valuesa
Compared with controls, patients with T2DM had significantly increased MD values in the rPF_WM (including 3 clusters defined as superior, middle, and inferior rPF_WM according to their coordinates at the z-axis), the right superior temporal WM, the left prefrontal WM, the left external capsule (lEC), the splenium of the CC, and the pons (P < .05, AlphaSim correction) (Fig 1 and Table 3). The intergroup differences in MD were driven by increased AD and RD within corresponding ROIs in patients with T2DM (P < .05) (Table 5).
Intergroup differences of the AD and RD values that contributed to the altered MD valuesa
Kurtosis Metrics from DKI
In the voxel-based analysis, patients with T2DM showed significantly decreased MK values in the splenium of the CC and the pons compared with controls (P < .05, AlphaSim correction) (Fig 1 and Table 3). In addition, ROI-based intergroup comparisons showed that the AK and RK values within the splenium of the CC and the pons significantly decreased in patients with T2DM compared with controls (P < .05) (Table 6); this decrease drives the decreased MK within corresponding ROIs in patients with T2DM.
Intergroup differences of the AK and RK values that contributed to the altered MK valuesa
Correlation Analyses with Clinical and Cognitive Variables
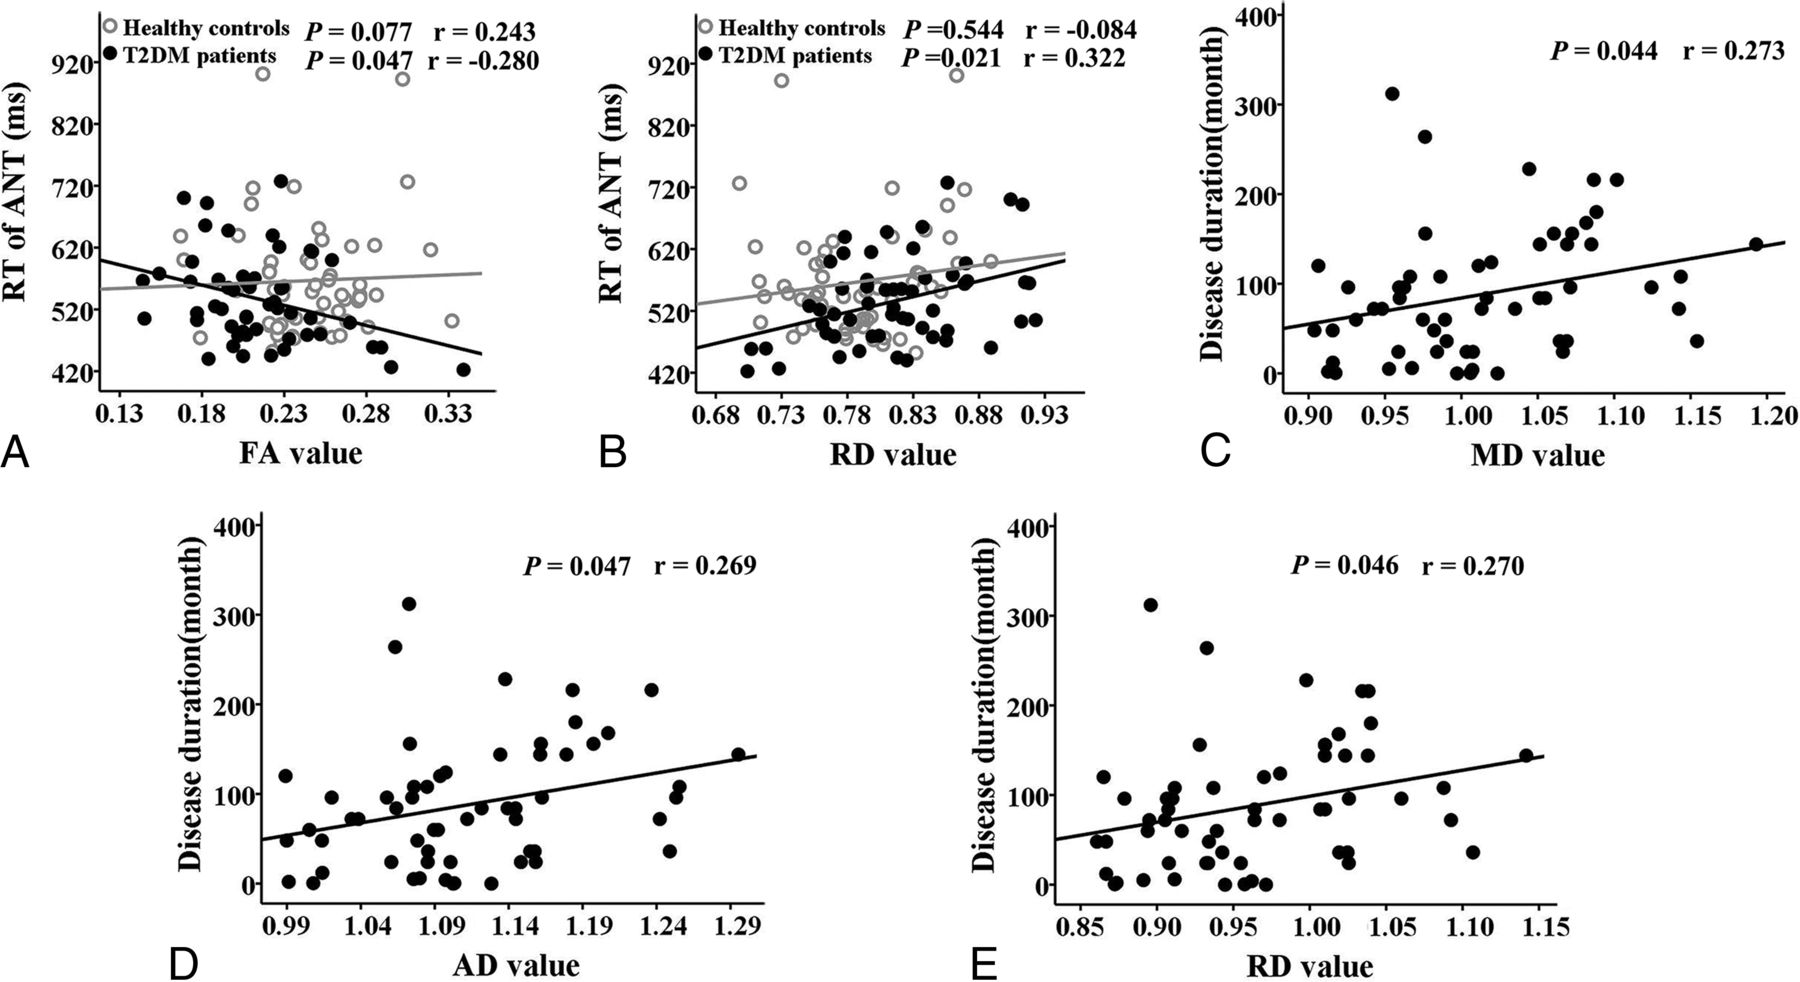
By using the partial correlation analyses, we found a negative correlation between the FA values of the rPF_WM and the reaction time of the Attention Network Test (RT of ANT) (r = −0.280, P = .047) and a positive correlation between the RD values of rPF_WM and the RT of ANT (r = 0.322, P = .021) (Fig 2) in patients with T2DM. Moreover, positive correlations were demonstrated between disease duration and MD values (r = 0.273, P = .044), AD values (r = 0.269, P = .047), and RD values (r = 0.270, P = .046) of the superior rPF_WM in patients with T2DM (Fig 2).

Correlations between DKI parameters and clinical/cognitive variables in the patients with T2DM and controls. A, Correlation between decreased FA in the rPF_WM and RT of ANT. B, Correlation between increased RD in rPF_WM and RT of ANT. C, Correlation between increased MD in the superior rPF_WM and disease duration. D, Correlation between increased AD in the superior rPF_WM and disease duration. E, Correlation between increased RD in the superior rPF_WM and disease duration.
However, there were no significant correlations between the kurtosis metrics and cognitive/clinical variables in patients with T2DM and the controls (P > .05).
Analyses of the Subgroup Comparison between Patients with T2DM with and without Insulin
No significant intergroup differences were observed in terms of age, sex, years of education, and cognitive performance between the insulin-injection group and the non-insulin-injection group (P > .05) (On-line Table 3).
In the ROI-based analysis, no significant intergroup differences in FA, MD, and MK values were found between the 2 subgroups (P > .05) (On-line Tables 4 and 5).
Comparison of Diffusion Metrics from DTI and DKI
On the basis of the voxel-based analysis of DTI metrics, deceased FA in the splenium of the CC and increased MD in the superior and inferior rPF_WM and lEC were noted in patients with T2DM compared with healthy controls (Fig 3). The overlapping map of the DKI and DTI results showed that intergroup differences detected by DTI mostly overlapped those revealed by DKI. Some additional intergroup differences could only be identified by using DKI, including increased MD in the middle rPF_WM, left prefrontal white matter, and right superior temporal white matter and increased MD and decreased MK in the splenium of the CC and the pons (Fig 3).

WM regions that showed significant differences in DKI metrics (red) and DTI metrics (blue) between patients with T2DM and controls were overlapped on the FA template. Green represents the overlapped region of the results of the DKI and the DTI between patients with T2DM and controls.
Discussion
In the present study, the DKI method was used to explore WM microstructural alterations in patients with T2DM without cognitive impairment. Compared with DTI, DKI can provide both diffusion and kurtosis metrics for identifying WM microstructural changes and can provide additional information of WM microstructural abnormalities in patients with T2DM. Furthermore, patients with T2DM had decreased FA in the rPF_WM and the splenium of the CC; increased MD in the bilateral prefrontal and right temporal WM, lEC, splenium of the CC, and pons; and decreased MK in the splenium of the CC and the pons. In addition, significant correlations were detected between the altered diffusion metrics and disease duration and the RT of ANT.
Comparison between DTI and DKI
In our study, the intergroup differences detected by DTI mostly overlapped those revealed by DKI, and increased MD in rPF_WM, left prefrontal white matter, and right superior temporal white matter and both increased MD and decreased MK in the splenium of the CC and the pons could only be detected by using DKI (Fig 3). Moreover, our results were partially consistent with those in the previous DTI studies on T2DM in which decreased FA and/or increased MD of the prefrontal WM,7⇓–9 the temporal WM,7 the CC,10,12 and the lEC12 were observed in patients with T2DM compared with controls. Our patients with T2DM also had decreased MK and increased MD values in the pons, which were not reported in previous DTI studies.7⇓⇓⇓⇓⇓–13 These results demonstrated that DKI is reliable for identifying T2DM-related WM microstructural abnormalities and can provide additional information on WM microstructural abnormalities. DKI is superior to DTI because diffusion metrics obtained from DTI are calculated on the basis of the assumption of Gaussian diffusion of water molecules,15 whereas non-Gaussian diffusion is known to be substantial.16 Due to the inclusion of non-Gaussian effects, the DKI-derived estimates of the diffusion metrics are generally more accurate than those obtained with conventional DTI.18 In addition to the differences in imaging methods, the variation of subjects enrolled in the studies may also lead to the inconsistency of the results. The patients with T2DM in our study did not have T2DM-related complications (retinopathy, peripheral neuropathy, or nephropathy) and showed no significant intergroup difference in cognitive performance relative to the healthy controls. In contrast, patients with T2DM enrolled in several previous studies10,12,13 had slightly or significantly worse cognitive functions, which may contribute to the results of more global differences in their studies compared with ours.
Altered Diffusion and Kurtosis Metrics in Patients with T2DM
FA and MD are the primary diffusion metrics that reflect overall WM health, maturation, and organization.30 In addition to these primary diffusion metrics, AD (reflecting axon integrity) and RD (reflecting myelin sheath integrity) are of great importance in understanding the underlying physiology.31 Decreased FA values are presumably based on predominantly increased RD8,13 or both increased RD and AD.10 Thus, our finding of decreased FA was most probably driven by a significantly increased RD, indicating that the impairment of WM integrity was possibly a result of demyelination according to the study of Song et al.32 In addition, the increased MD values driven by the increased AD and RD, which are partly consistent with results in a previous DTI study,10 may reflect the expansion of extracellular space due to the degeneration of fibers or edema.33 Additionally, the decreased MK was attributed to both the decrease in RK and AK in patients with T2DM compared with controls. Kurtosis values quantify the degree of diffusion restriction or tissue complexity,34 and the reduced MK value may indicate reduced tissue heterogeneity, which could be attributed to microstructural impairment such as the thinner packing of axons and fiber bundles, lower axonal membrane permeability (reflected as reduced RK), decreased microstructural complexity, or cell structure deficits along the axial direction of WM fibers (reflected as reduced AK).
On the basis of the voxel-based analysis, we observed decreased FA in the rPF_WM and the splenium of the CC and increased MD in bilateral prefrontal WM, the right superior temporal white matter, the lEC, the splenium of the CC, and the pons in patients with T2DM. Additionally, decreased MK, RK, and AK values were also detected in the splenium of the CC and the pons of patients with T2DM compared with controls. To date, several studies have suggested various WM impairments in patients with T2DM. For example, Yau et al7 suggested that patients with T2DM had significantly lower FA in the frontal and temporal WM compared with controls. A remarkable decrease in FA and an increase in MD were also mainly located in the frontal cortex.8,9 Compelling evidence acquired from a variety of structural and functional MR imaging studies demonstrated that the prefrontal cortex has an important role in increased cognitive function.35 Given the important role of the prefrontal WM in transferring information between the prefrontal cortex and other brain regions, the microstructural changes in the prefrontal WM may lead to cognitive impairment.
The CC plays an important role in interhemispheric functional integration. The loss of WM connectivity and regionally specific atrophy of the CC are observed in patients with Alzheimer disease and mild cognitive impairment,36 indicating that CC abnormalities may be related to the cognitive deficits. The external capsule is a route for cholinergic fibers from the basal forebrain to the temporal cortex, transmitting auditory and polymodal sensory information. As reported, the external capsule is crucial for cognition, including memory and executive function.37 All of these results demonstrate that T2DM impacts WM integrity. Moreover, the disease duration rather than HbA1c is related to the MD, AD, and RD values of the superior rPF_WM in patients with T2DM, which may indicate that T2DM may have a cumulative effect on the WM microstructural damage. This positive correlation between disease duration and diffusion metrics in patients with T2DM was also reported in a previous DTI study.8
Recently, disease duration was also cited as an important contributing factor for developing diabetic peripheral neuropathy or cardiovascular autonomic neuropathy in patients with T2DM.38,39 Additionally, there were significant correlations between the FA/RD of the superior rPF_WM and the RT of ANT, indicating that patients with T2DM with lower WM integrity have worse behavioral performance. Although no abnormal cognitive functions were detected in our patients with T2DM compared with healthy controls, these findings make it plausible to postulate that the T2DM-related cognitive decline would occur with an increase in disease duration. In addition, it is possible that the neuropsychological tests used in our study were not sensitive enough to detect subtle cognitive impairment. In our study, there were no significant correlations between the diffusion/kurtosis metrics and HbA1c in patients with T2DM, which is consistent with findings in previous DTI studies.8 Among these studies,7⇓⇓⇓⇓⇓⇓–14 only 2 reported a significant11 or trend correlation10 between the altered diffusion metrics and HbA1c. Although the patients included in the studies of Reijmer et al10 and Hoogenboom et al11 and our study were all free from any T2DM-related complications, the duration of the T2DM group is longer in the studies of Reijmer et al and Hoogenboom et al compared with our study, which may be an indirect factor contributing to correlations between the altered diffusion metrics and HbA1c. Thus, the current HbA1c may not be the best predictor of brain health. Additional studies are needed to investigate the effects of long-term glucose control on the diffusion/kurtosis metrics.
Altered WM integrity of the pons was detected in our patients with T2DM, which was not reported in previous DTI studies.7⇓⇓⇓⇓–12 The locus coeruleus is located in the pons40 and is related to numerous functions via its widespread projections to cortical and subcortical regions.41 Previously, Clewett et al42 provided human evidence that functional connectivity exists between the locus coeruleus and the dorsolateral prefrontal cortex. In the current study, patients with T2DM had decreased MK (driven by decreased AK and RK) and increased MD (driven by increased AD and RD) in the pons, which reflected reduced tissue heterogeneity in this area. Our results suggest that DKI-based metrics may be more sensitive to the change in complex WM microstructures of the pons and that the clinical significance of WM microstructure change in the pons in patients with T2DM is worthy of further study.
With the ROI-based analysis, we observed no significant differences in both primary DKI parameter values (FA, MD, and MK) and cognitive assessments between the patients with T2DM with and without insulin injection, which may, to some extent, reflect the use of insulin having no effect on our reported results. In addition, there is no knowledge of how oral antidiabetic drugs may affect the DTI/DKI indices to date7⇓⇓⇓⇓⇓–13; thus, the medication-related impact on the results should be a focus of future studies.
Limitations
Several limitations should be acknowledged. First, our study is limited by its cross-sectional design, and further longitudinal studies are of great importance in investigating the clinical values of DKI for predicting longitudinal cognitive decline. Second, although we attempted to maintain sample consistency by controlling for complications and hypoglycemia, variations in disease duration and treatment methods remained; these variations should be noted as a limitation.
Conclusions
To the best of our knowledge, this is the first DKI study on patients with T2DM. With both diffusion and kurtosis metrics, DKI can provide additional information about WM microstructural abnormalities in patients with T2DM. Our results demonstrated that WM microstructural abnormalities occur before cognitive decline in patients with T2DM; the correlations between the FA/RD of the rPF_WM and the RT of ANT have suggested that WM microstructural alterations may be used as a neuroimaging marker for predicting the early cognitive impairment in patients with T2DM.
Footnotes
Y. Xie and Y. Zhang contributed equally to this work.
Y.X., Y.Z., and Q.Z. designed the research; Y.X., Y.Z., and Q.Z. performed the research; C.N. and S.L. were involved in the clinical assessment; Y.X., Y.Z., W.Q., and Q.Z. analyzed the data; Y.X., Y.Z., and Q.Z. wrote the paper. Q.Z is the guarantor of this work and, as such, had full access to all the data in the study and takes responsibility for the integrity of the data and the accuracy of the data analysis.
No potential conflicts of interest relevant to this article were reported.
References
- Received March 16, 2016.
- Accepted after revision October 18, 2016.
- © 2017 by American Journal of Neuroradiology


