
Abstract
BACKGROUND AND PURPOSE: Several radiologic features such as hematoma volume are related to poor outcome following an intracerebral hemorrhage and can be measured with transcranial duplex sonography. We sought to determine the prognostic value of transcranial duplex sonography in patients with intracerebral hemorrhage.
MATERIALS AND METHODS: We conducted a prospective study of patients diagnosed with spontaneous intracerebral hemorrhage. Transcranial duplex sonography examinations were performed within 2 hours of baseline CT, and we recorded the following variables: hematoma volume, midline shift, third ventricle and lateral ventricle diameters, and the pulsatility index in both MCAs. We correlated these data with the CT scans and assessed the prognostic value of the transcranial duplex sonography measurements. We assessed early neurologic deterioration during hospitalization and mortality at 1-month follow-up.
RESULTS: We included 35 patients with a mean age of 72.2 ± 12.8 years. Median baseline hematoma volume was 9.85 mL (interquartile range, 2.74–68.29 mL). We found good agreement and excellent correlation between transcranial duplex sonography and CT when measuring hematoma volume (r = 0.791; P < .001) and midline shift (r = 0.827; P < .001). The logistic regression analysis with transcranial duplex sonography measurements showed that hematoma volume was an independent predictor of early neurologic deterioration (OR, 1.078; 95% CI, 1.023–1.135) and mortality (OR, 1.089; 95% CI, 1.020–1.160). A second regression analysis with CT variables also demonstrated that hematoma volume was associated with early neurologic deterioration and mortality. When we compared the rating operation curves of both models, their predictive power was similar.
CONCLUSIONS: Transcranial duplex sonography showed an excellent correlation with CT in assessing hematoma volume and midline shift in patients with intracerebral hemorrhage. Hematoma volume measured with transcranial duplex sonography was an independent predictor of poor outcome.
ABBREVIATIONS:
- END
- early neurologic deterioration
- HV
- hematoma volume
- ICH
- intracerebral hemorrhage
- IQR
- interquartile range
- LV
- lateral ventricle
- MLS
- midline shift
- IIIV
- third ventricle
- TDS
- transcranial duplex sonography
Spontaneous intracerebral hemorrhage (ICH) is a major cause of morbidity and mortality,1 with half of the events related to case fatality occurring within the first 48 hours.2 Thus, identifying variables that contribute to early neurologic deterioration (END) and mortality is of enormous importance. An early estimation of the prognosis is crucial for deciding on a treatment plan. Several neuroimaging prognostic factors include hematoma volume (HV), hematoma enlargement, midline shift (MLS), and intraventricular hemorrhage,3⇓⇓⇓⇓⇓–9 and CT is the technique most frequently used to assess them. However, in the early stages, it can be difficult to monitor these radiologic features with repeat CT due to the clinical and/or hemodynamic state of the patient and the risk of radiation overexposure.
Transcranial duplex sonography (TDS) is a noninvasive technique that provides simultaneous 2D imaging of brain parenchyma and hemodynamic information from the main cerebral arteries. The role of TDS is well-established in the assessment of ischemic stroke, but its usefulness in acute ICH has been reported in only a few studies.10⇓⇓⇓⇓–15
Visualization of acute ICH with TDS is feasible: The ICH can be identified as a hyperechoic mass.10⇓–12 Additionally, TDS allows the assessment of the third ventricle (IIIV), the lateral ventricles (LVs), MLS, and the presence of intraventricular hemorrhage.13⇓⇓–16 TDS may have some potential advantages over CT, including the feasibility of performance at the bedside as many times as necessary and regardless of the hemodynamic situation of the patient. Despite a good correlation between TDS and CT having been previously reported,10⇓⇓⇓⇓–15 the prognostic value of this technique in ICH is yet to be established.
The question of whether TDS may reliably measure ICH characteristics and predict END and mortality following ICH has important implications for clinical practice and research. In the current study, we sought to determine the prognostic value of TDS in patients with acute ICH.
Materials and Methods
We conducted a prospective observational study of consecutive adult patients admitted to our center with the diagnosis of spontaneous ICH during a 1-year period (2012–2013). Patients were included when the time from the onset of symptoms to admission CT was <24 hours and the TDS examination was performed within 2 hours of baseline CT. We excluded patients with primary intraventricular hemorrhage, infratentorial ICH, and secondary ICH related to fibrinolysis, trauma, central venous thrombosis, arteriovenous malformations, or aneurysms. During hospitalization, patients received treatment in accordance with the guidelines of the Spanish Society of Neurology.16 All patients or their representatives gave written consent to participate in the study.
The following clinical data were collected from all patients at admission: 1) demographics (age and sex); 2) relevant medical history, including hypertension, diabetes, hypercholesterolemia, stroke, coronary artery disease, liver disease, and alcohol abuse; 3) previous treatments; 4) time from the onset of symptoms to admission; 5) admission blood pressure and blood glucose level; 6) NIHSS score and Glasgow Coma Scale score; and 7) results of blood tests including hematocrit level, hemoglobin level, white cell count, platelet count, electrolytes, glomerular filtration rate, liver function, and a basic hemostatic study (international normalized ratio and activated partial thromboplastin time).
Neurosonographic Methods
A single experienced examiner (P.C.-R.) was trained in a Neurosonology Laboratory by R.D.-M. and J.M.-F. for 6 months before study initiation and was certified in Neurosonology by the Spanish Society of Neurology. The TDS examinations were performed with a CX50 Ultrasound (Philips Healthcare, Best, the Netherlands) with a sectorial probe with a 2- to 5-MHz range. For the explorations, the probe was set up at 5 MHz and placed on the contralateral temporal bone window with a penetration depth of 14–16 cm. The transducer was skewed approximately 10° upward to visualize the contralateral skull bone, and from there, insonation planes were adapted according to the hematoma location. Image brightness, contrast, and time-gain compensation were adjusted to get the best image. ICH was identified as a hyperechoic mass. The examiner was blinded to the CT findings, and he or she was informed only of the side of the ICH (left or right).
We recorded the following neurosonologic variables: 1) the longitudinal (A), axial (B), and coronal (C) diameters of the ICH as previously reported11; 2) HV, calculated with the formula A × B × C/217; 3) IIIV diameter, visualized at a depth of 6–8 cm and identified by its parallel hyperechoic margins and the surrounding hypoechoic thalami13; 4) MLS, calculated with the following formula: (A − B)/2 (A and B being the distances between the transducer and the IIIV, on each side of the skull); 5) LV axial diameter, visualized as 2 anterior and lateral hyperechoic margins corresponding to the frontal horns, which can be observed skewing the transducer upward from the IIIV plane14; and 6) the pulsatility index in both proximal MCAs, calculated with the following formula: (Peak Systolic Velocity − End Diastolic Velocity)/Mean Velocity at a depth of 4.5–5.5 cm. Figure 1 shows an example of 2 ICHs assessed with TDS. Examples showing the MLS, the IIIV, and LV diameters and the pulsatility index measurements are provided in On-line Fig 1.

A and B, A right basal ganglia hemorrhage, assessed by TDS and CT, respectively. The red arrows correspond to the axial and longitudinal diameters. C and D, A right temporal lobar ICH in another patient, assessed by TDS and CT, respectively.
CT
All CT scans were obtained with a 16-section CT scanner. The following variables were assessed by 2 experienced radiologists (J. M. and E.G.): 1) HV, also calculated by A × B × C/217; 2) IIIV diameter; 3) MLS; and 4) LV diameter.
Follow-Up Variables
We collected the following data: 1) END, defined as a decrease of >1 point in the Glasgow Coma Scale score and/or an increase of ≥4 points in the NIHSS score within the first 72 hours; and 2) mortality at the 1-month follow-up.
Statistical Analysis
Data are reported with mean and SD for quantitative variables, median and interquartile range for quantitative ordinal variables, and percentages for categoric variables. A logarithmic transformation of the variable HV was used to approximate the normal distribution. Correlations between measurements were assessed by the Pearson correlation coefficient, and Bland-Altman plots were performed to evaluate the agreement between CT and TDS. Comparison of variables was performed with contingency tables with the χ2 test for categoric variables, the Student t test for quantitative variables with a normal distribution, and the Mann-Whitney U test when a nonparametric test was required. Only variables showing a significant trend (P < .1) in the bivariate analyses were entered in the multivariable logistic regression model and were backward eliminated to a significance level of .05. Collinear factors (as measured through the variance inflation factor) were removed when appropriate. We conducted 2 different logistic regression analyses to construct a predictive model of END and mortality: one with the radiologic variables measured with CT and the other with the same variables calculated with TDS. This approach was used to avoid autocorrelation between variables measuring the same parameters. P < .05 was considered statistically significant.
Results
During the study period, we screened 59 patients: Five were excluded due to the absence of a temporal bone window, 2 died before the TDS examination could be performed, 15 were excluded because the TDS examination was not available within 2 hours of the baseline CT or the patient underwent surgical evacuation before TDS could be performed, and eventually 2 patients were excluded because the ICH was not identified despite presentation of a reasonable temporal bone window. We finally included 35 patients with a mean age of 72.2 ± 12.8 years; 23 (65.7%) were men. In 25 (71.4%) patients, the time from the onset of symptoms to baseline CT was <6 hours. Clinical and radiologic characteristics of the patients are detailed in Table 1. The median baseline NIHSS score was 11 (interquartile range [IQR], 3.5–19), and prior antithrombotic therapy was observed in 10 (28.6%) patients: Six (17.1%) were receiving aspirin and 4 (11.4%) were taking warfarin before admission.
Clinical and radiologic characteristics of the patients
There were 16 (45.7%) lobar (6 frontal, 6 parietal, 2 temporal, and 2 occipital) and 19 (54.3%) deep ICHs. The median HV was 9.85 mL (IQR, 2.74–68.29 mL) assessed with CT and 14.46 mL (IQR, 4.96–39.42 mL) as determined by TDS. As described in the “Materials and Methods,” all patients underwent a TDS examination within 2 hours of the baseline CT. We found an excellent correlation between the baseline TDS examination and the CT when measuring the HV (r = 0.791, P < .001) and, separately, the longitudinal (r = 0.711, P < .001), axial (r = 0.768, P < .001), and coronal diameters (r = 0.754, P < .001) (Fig 2). We repeated the same analysis dividing the population by ICH location, and the correlation remained excellent in both groups (r = 0.792, P < .001 for the lobar ICH and r = 0.805, P < .001 for the deep ICH). We also observed an excellent correlation when analyzing the IIIV diameter (r = 0.678, P < .001) and the MLS (r = 0.827, P < .001). Conversely, CT and TDS showed no correlation when measuring the LV diameter (r = 0.196, P = .327).

Correlation of measurements between CT and TDS.
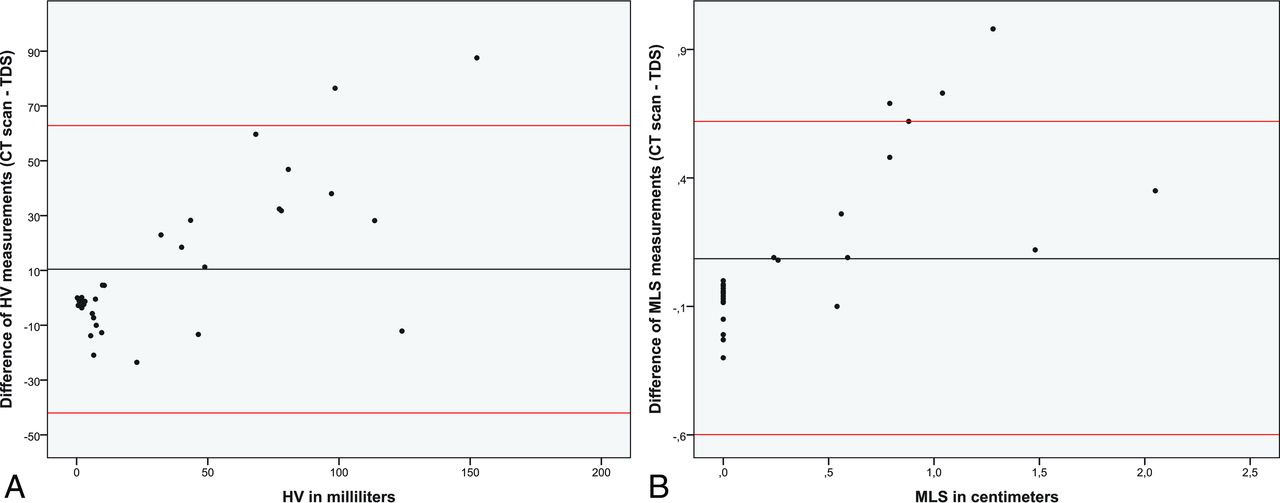
For further comparison between techniques, we conducted a 1-sample t test contrast of the difference between the measurements obtained by CT and TDS. There were no significant differences when contrasting HV measurements (mean difference = −0.077; P = .624) and MLS (mean difference = 0.086; P = .134). Conversely, despite showing a good correlation, the 2 techniques presented significant differences when measuring IIIV diameter (mean difference = 0.132; P = .001). We also constructed Bland-Altman plots with the HV and the MLS measurements (Fig 3). Most interesting, despite finding good agreement between techniques, we detected a systematic bias between both techniques when measuring HV: TDS tended to overestimate the volumes of smaller ICH and, contrariwise, to underestimate volumes in larger ICHs.

Bland-Altman plots comparing the difference between the measurements obtained by CT and TDS when assessing HV (A) and MLS (B). The horizontal black lines demonstrate the mean difference, and the red lines show the 95% confidence interval.
During hospitalization, 9 (25.7%) patients presented with END during the first 3 days. Table 2 provides details of the patients presenting with and without END. Remarkably, prior antiplatelet therapy (P = .017) was more frequently reported in patients presenting with END. Additionally, baseline HV measured with CT (P = .002), baseline HV measured with TDS (P = .001), baseline MLS assessed with CT (P = .018), and baseline MLS calculated with TDS (P = .007) showed an association with the probability of END. In the first logistic regression analysis with CT variables, only baseline HV showed an independent association with END (OR, 1.043; 95% CI,1.015–1.071). Most interesting, in the logistic regression analysis with the TDS variables, we also found that baseline HV (OR, 1.078; 95% CI, 1.023–1.135) was the only variable included in the final model. In both models, HV remained independently associated with END after adjusting for age and the baseline Glasgow Coma Scale. The receiver operating characteristic curve showed that the best threshold to predict END was an HV of 47.62 mL as assessed with CT (77.8% sensitivity and 88.5% specificity) and an HV of 21.80 mL as measured with TDS (88.9% sensitivity and 80% specificity). When we compared the receiver operating characteristic curves of both models, the predictive power was similar between them, and no significant differences were observed when contrasting the 2 areas under the curve (On-line Fig 2).
Differences between patients presenting with and without END
At the 1-month follow-up, 7 (20%) patients had died. Variables associated with mortality are shown in Table 3. Remarkably, baseline HV measured with CT (P < .001), baseline HV measured with TDS (P < .001), baseline MLS assessed with CT (P = .001), and baseline MLS calculated with TDS (P = .001) showed an association with the risk of mortality. In addition, the pulsatility index from the ipsilateral MCA also showed an association with mortality risk (P = .033). Finally, lobar localization (P = .018), baseline NIHSS scores (P < .001), and Glasgow Coma Scale scores (P = .007) were variables also found to be related to the risk of mortality. In the first logistic regression model with CT variables, only baseline HV showed an independent association with mortality (OR, 1.064; 95% CI, 1.017–1.112). Most interesting, in the logistic regression model with the TDS variables, we once again found that baseline HV (OR, 1.089; 95% CI, 1.020–1.160) was the only variable included in the final model. The receiver operating characteristic curves of both models showed that the best threshold to predict mortality at 1-month follow-up was an HV of 47.62 mL as assessed with CT (85.7% sensitivity and 85.7% specificity) and an HV of 30.63 mL as measured with TDS (85.7% sensitivity and 82.2% specificity). Again, as shown in On-line Fig 2, the predictive power of both models was similar, and no significant differences were observed when contrasting both areas under the curve.
Variables associated with mortality at 1-month follow-up
Discussion
We aimed to determine the prognostic value of TDS in a prospective cohort of patients presenting with spontaneous ICH. Our study confirms previously reported data concerning the strong correlation between TDS and CT and adds new information regarding the prognostic value of this technique in patients with ICH.
ICH is a devastating condition, and several radiologic features may predict poor outcome. Currently, the widespread availability of CT allows a rapid and reliable assessment of these variables. However, ICH is a dynamic process, and it can be difficult to monitor complications with repeat CT scans due to the clinical status of the patient. This issue led to interest in TDS, which may represent a viable, noninvasive alternative to CT and can be easily performed at the bedside.
Some previous studies have reported a good correlation between TDS and CT in measuring HV and other intracranial structures.11⇓–13 In accordance with these studies, we found an excellent correlation between CT and TDS when measuring HV and its longitudinal, axial, and coronal diameters, as well as MLS and the IIIV diameter. Conversely, we were unable to demonstrate a good correlation when measuring the LV diameter. Our results disagree with findings in previous studies that reported a good correlation.14,15 A possible explanation for this discrepancy may be the difficulty in visualizing the real margins of the LV when skewing the transducer upward from the IIIV, which results in considerable variability in the measures.
In addition to the correlation analysis, our study presents new information regarding the agreement between both techniques. We found good agreement when measuring HV and MLS, but the IIIV measurements presented a significant difference between CT and TDS. In addition, we observed a systematic bias when assessing HV: TDS tended to overestimate the volumes of smaller ICHs and, contrariwise, to underestimate volumes in larger ICHs. Thus, TDS may be a useful complementary diagnostic tool but may not substitute for CT as the criterion standard technique to assess ICH characteristics.
In addition to the morphologic information, TDS allows assessment of some hemodynamic parameters, such as the pulsatility index, which has been related to increased intracranial pressure. Remarkably, in the univariate analysis, we found that the pulsatility index from the ipsilateral MCA was associated with the risk of mortality. Our results are in accordance with a previous study that assessed the prognostic value of the pulsatility index in an ICH,18 though that study used transcranial Doppler and found a significant association between mortality and the pulsatility index from the contralateral MCA.
Baseline HV has been recognized as a major determinant of outcome in patients with acute ICH.4 Remarkably, we found that HV measured with TDS was an independent predictor of END and mortality. The predictive power of the logistic regression model with TDS variables was similar to that of the same model with CT measurements. Therefore, it is prudent to conclude that TDS may be regarded as a potential tool for the noninvasive monitoring of these patients.
We must be aware of the limitations of TDS, including examiner dependency, susceptibility to an insufficient temporal bone window, low spatial resolution, and possible imaging artifacts. Additionally, some specific limitations occur when assessing ICH, including the loss of echogenicity of the blood with time and the difficulty in evaluating the hematoma in some locations, for example in the infratentorial structures. These drawbacks designate TDS as a complementary diagnostic tool; CT remains the most reliable examination in acute ICH. Nevertheless, a TDS examination following the baseline CT may allow neurologists to monitor the HV at the bedside, regardless of the clinical status of the patient, and to avoid constant transfers to the CT room.
Our study has several limitations, including the small sample size, the limited follow-up of the patients, and the absence of a follow-up TDS examination, which prevented us from assessing hematoma expansion. In addition, a single examiner performed the TDS examinations; thus, we were not able to assess interrater reliability. Finally, we excluded patients who died before a TDS could be performed or who underwent surgical evacuation, which may represent a selection bias.
Conclusions
TDS showed an excellent correlation with CT in assessing HV, MLS, and IIIV diameters in an acute ICH. HV measured with TDS was an independent predictor of poor outcome with a predictive power similar to that of CT. Further studies are warranted to continue testing TDS as a complementary technique for monitoring ICH and to establish whether this monitoring may improve clinical outcomes.
Acknowledgment
We acknowledge Carly Calvert for English grammar revision.
Footnotes
Disclosures: Joan Martí-Fàbregas—UNRELATED: Consultancy: Boehringer Ingelheim, Bayer Pharma AG, Daichii Sankyo, Pfizer; Employment: Hospital Santa Creu i Sant Pau; Expert Testimony: Boehringer Ingelheim, Bayer Pharma AG, Daichii Sankyo, Pfizer; Grants/Grants Pending: Instituto de Salud Carlos III (RETICS INVICTUS PLUS RD16/0019/0010).
Paper previously presented at: European Stroke Organization Conference, April 17-19, 2015; Glasgow, UK.
REFERENCES
- Received December 24, 2016.
- Accepted after revision March 27, 2017.
- © 2017 by American Journal of Neuroradiology


Jump to section
Related Articles
Cited By...
- No citing articles found.