
Abstract
BACKGROUND AND PURPOSE: Leptomeningeal enhancement can be found in a variety of neurologic diseases such as Susac Syndrome. Our aim was to assess its prevalence and significance of leptomeningeal enhancement in Susac syndrome using 3T postcontrast fluid-attenuated inversion recovery MR imaging.
MATERIALS AND METHODS: From January 2011 to December 2017, nine consecutive patients with Susac syndrome and a control group of 73 patients with multiple sclerosis or clinically isolated syndrome were included. Two neuroradiologists blinded to the clinical and ophthalmologic data independently reviewed MRIs and assessed leptomeningeal enhancement and parenchymal abnormalities. Follow-up MRIs (5.9 MRIs is the mean number per patient over a median period of 46 months) of patients with Susac syndrome were reviewed and compared with clinical and retinal fluorescein angiographic data evaluated by an independent ophthalmologist. Fisher tests were used to compare the 2 groups, and mixed-effects logistic models were used for analysis of clinical and imaging follow-up of patients with Susac syndrome.
RESULTS: Patients with Susac syndrome were significantly more likely to present with leptomeningeal enhancement: 5/9 (56%) versus 6/73 (8%) in the control group (P = .002). They had a significantly higher leptomeningeal enhancement burden with ≥3 lesions in 5/9 patients versus 0/73 (P < .001). Regions of leptomeningeal enhancement were significantly more likely to be located in the posterior fossa: 5/9 versus 0/73 (P < .001). Interobserver agreement for leptomeningeal enhancement was good (κ = 0.79). There was a significant association between clinical relapses and increase of both leptomeningeal enhancement and parenchymal lesion load: OR = 6.15 (P = .01) and OR = 5 (P = .02), respectively.
CONCLUSIONS: Leptomeningeal enhancement occurs frequently in Susac syndrome and could be helpful for diagnosis and in predicting clinical relapse.
ABBREVIATIONS:
- CIS
- clinically isolated syndrome
- CC
- corpus callosum
- FA
- fluorescein angiography
- LME
- leptomeningeal enhancement
- pcFLAIR
- postcontrast FLAIR
- SuS
- Susac syndrome
Susac Syndrome (SuS) is a vasculopathy characterized by a triad of neurologic, hearing, and ophthalmologic disorders.1⇓–3 Fluorescein angiography (FA) typically shows branch retinal artery occlusions, and brain MR imaging shows FLAIR hyperintensities involving the corpus callosum (CC). Criteria were recently proposed for definite, probable, and possible SuS to guide diagnosis.4
The complete triad is present in only 13% of patients at disease onset.5 Peripherally located branch retinal artery occlusion may not result in visual symptoms, and its recognition requires review by experienced ophthalmologists. Therefore, MR imaging is often necessary to establish the diagnosis, but the primary radiologic misdiagnosis is multiple sclerosis, and immune treatment for MS may lead to exacerbation in patients with SuS.6⇓–8
Several recent publications have investigated the presence of postcontrast FLAIR (pcFLAIR) leptomeningeal enhancement (LME) in a variety of neurologic diseases, particularly MS.9 Despite LME already being part of the diagnostic criteria proposed by Kleffner et al,4 there is scant literature devoted specifically to LME in SuS.10⇓–12
The aim of our study was to evaluate the prevalence and significance of pcFLAIR LME at 3T in patients with SuS at onset and during follow-up.
Materials and Methods
Study Design and Setting
We conducted a retrospective systematic chart review in a tertiary referral center specializing in ophthalmology and neurology interventions.
Ethics Approval, Patient Information, and Consent
This study was prospectively approved by our institutional research ethics board and adhered to the tenets of the Declaration of Helsinki. Informed consent was waived.
Patients
Susac Syndrome Group.
We reviewed the medical charts of adult patients with SuS treated in our center from January 2011 to December 2017. All patients except one had a definite clinical diagnosis of SuS according to the 2016 criteria without relying on or including the presence of LME. The patient with a probable diagnosis of SuS had retinal and vestibular cochlear involvement without neurologic symptoms. All patients had branch retinal artery occlusion on FA. Brain MR imaging, FA, tonal audiometry, a complete serologic battery, and lumbar puncture were performed in all patients.
Treating neurologists determined the evaluation frequency and appropriate management with a systematic neurologic examination, completed by additional ear, nose, and throat and ophthalmologic examinations depending on symptoms. There are no standard algorithms for the use of steroids, antithrombotic therapy, or immunoglobulin intravenous or immunosuppressive therapy for SuS at our institution.
Follow-up included neurologic, ophthalmologic, and audiologic evaluations and FA and MR imaging. The MRIs and FAs were always performed within the same month as the clinical evaluations. A relapse was defined by the following: new neurologic symptoms, recent hearing loss and tinnitus or peripheral vertigo (peripheral vertigo should be supported by caloric testing of the vestibular organ, nystagmography, and/or vestibular evoked myogenic potentials), and/or a new vascular occlusion on FA. An ophthalmologist specialized in SuS with 10 years of experience (A.A.), blinded to clinical and radiologic data, independently reviewed all ophthalmologic data including FA for each eye. During follow-up, the severity of FA lesions was classified as unchanged, decreased, increased, or dissociated (defined as an increase in some lesions and decrease in others); in the case of dissociated evolution, the overall severity of the lesion was specified as unchanged, decreased, or increased.
Control Group.
The control group included all consecutive patients who presented with acute optic neuritis with a definite diagnosis of MS or clinically isolated syndrome (CIS) during the same period. We chose this control group for 2 reasons: first, because of our recruitment as a tertiary referral center where many patients present with optic neuritis, either isolated or related to MS; second, because we perform the same imaging protocol for all patients presenting with vision loss, thus allowing an accurate comparability regarding imaging technique and sequences between patients with SuS and the control group. From January 2011 to December 2017, seventy-three patients were included in the control group (56 patients with definite MS and 17 patients with CIS). A flowchart illustrating the selection of patients is shown in the On-line Figure.
MR Imaging Acquisition
All MR imaging examinations were performed with a 3T Ingenia device (Philips Healthcare, Best, the Netherlands) with a 32-channel head coil. Patients with SuS and those in the control group had the same protocol. An intravenous contrast injection of a single dose (0.1 mmol/kg) of gadolinium was administered 5 minutes before the first MR imaging acquisition. The common MR imaging protocol included postcontrast coronal T2 (TR/TE = 3000/75 ms, FOV = 150 × 150 mm, total acquisition time = 4 minutes 5 seconds), T1-weighted imaging (TR/TE = 497/7 ms, FOV = 150 × 150 mm, total acquisition time = 2 minutes 51 seconds), 3D pcFLAIR (TR/TE = 8000/388 ms, TI = 2400 ms, voxel size = 0.9 × 0.9 × 1 mm3, FOV = 240 × 240 × 175 mm3, total acquisition time = 4 minutes 24 seconds), and 3D postcontrast spin-echo T1-weighed imaging (TR/TE = 500/27 ms, voxel size = 1 × 1 × 1 mm3, FOV = 252 × 252 × 200 mm3, total acquisition time = 3 minutes 37 seconds).
MR Imaging Analysis
Two neuroradiologists (F.C. and E.S. with 12 and 7 years of experience, respectively), blinded to clinical, biologic, and FA data, independently analyzed the datasets in random order.
The readers assessed the following characteristics of patients' MR imaging at baseline and during follow-up: The primary judgment criterion was the presence of LME, defined as a pcFLAIR hyperintensity within the subarachnoid space substantially greater than that of the brain parenchyma (Fig 1). Secondary judgment criteria for LME were the number of regions of LME classified as few (<3) or multiple (≥3); their shape classified as punctate, linear, or mixed; their location classified as posterior fossa or supratentorial; an associated enhancement on postcontrast T1-weighted images; and their number classified as some or all regions of LME. Other secondary judgment criteria were the following: the presence of intraparenchymal focal pcFLAIR hyperintensities, their pattern defined as nonspecific, probably related to a small-vessel disease, or probably related to an inflammatory disease, according to international standards13⇓–15; their location classified as posterior fossa, CC, or supratentorial; the precise location and shape of the CC lesions, classified as located in the central portion or the callosal-septal surface as “snowball,” “icicle,” or “spoke,” respectively6,16; and an associated enhancement on postcontrast T1-weighted images and the number classified as some or all intraparenchymal lesions.
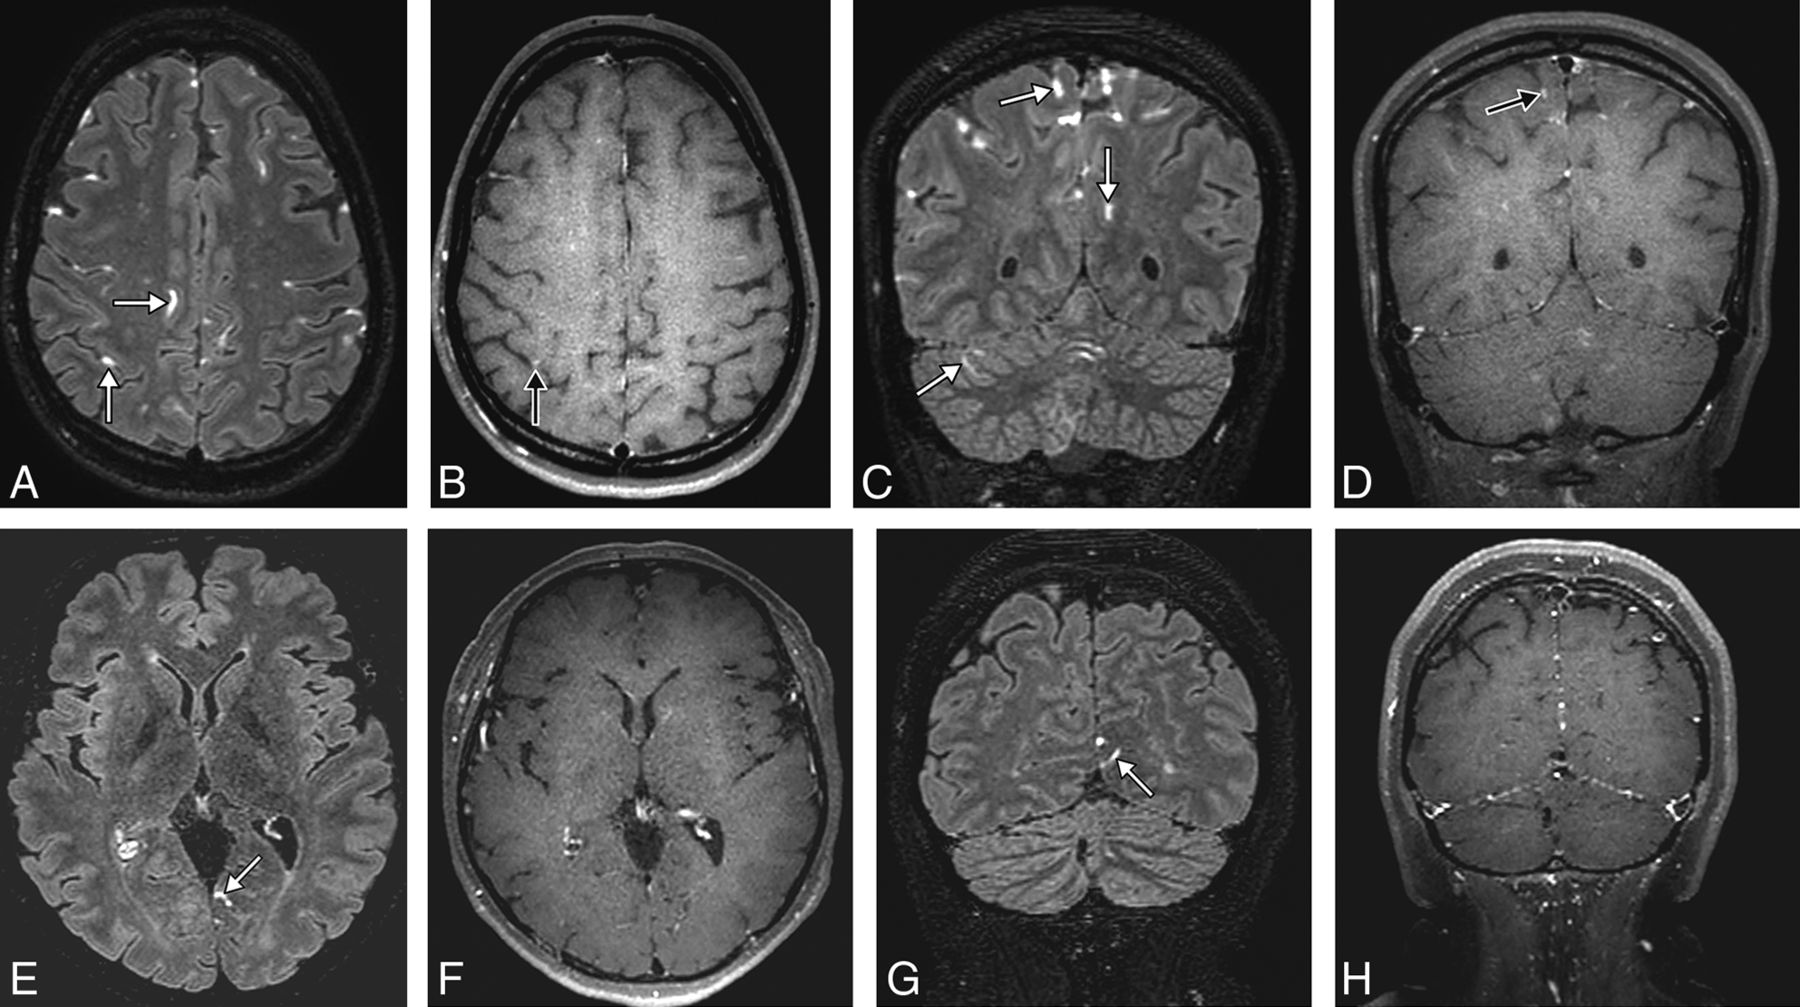
3D postcontrast FLAIR and postcontrast T1-weighted MR images in the axial and coronal planes showing leptomeningeal enhancement (white arrows) in a patient with Susac syndrome (A–D) and one with multiple sclerosis (E–H). Note the multiple regions of leptomeningeal enhancement in the patient with Susac syndrome compared with the patient with MS. Only the MR imaging of the patient with Susac syndrome shows posterior fossa leptomeningeal enhancement. Some of the regions of leptomeningeal enhancement have an associated enhancement on postcontrast T1-weighted imaging (black arrows).
During follow-up, LME and other encephalic lesion loads were classified as unchanged, decreased, increased, or dissociated (defined as an increase in some lesions and decrease in others); in case of dissociated evolution, the overall lesion load was specified as unchanged, decreased, or increased. Both readers were instructed to focus on and report LME as well as its characteristics before looking at the intraparenchymal lesions to avoid any recognition bias.
Statistics
Quantitative variables are presented as mean (SD), median (interquartile range); and categoric variables, as percentages. Agreement between readers was assessed using the Cohen κ. Fisher tests were used to compare the SuS and control groups. Because multiple tests were performed, Bonferroni adjustment was used with an α level adjusted to a significance level of .005. Mixed-effects logistic models were used to assess the relationship between LME or parenchymal lesion load and relapse. Bias-corrected bootstrap 95% confidence intervals were obtained using 1000 bootstrap replicates. Post hoc power analyses were performed. All statistical analyses were performed by Kevin Zuber, MSc, Biostatistician, Clinical Research Unit, Fondation Ophtalmologique Adolphe de Rothschild, using R Statistical Software.17
Results
Baseline
Demographic and Clinical Characteristics.
Among the 9 patients included in the SuS group, 8 had definite SuS and 1 had a probable diagnosis (8 women and 1 man; mean age, 37.7 ± 11 years SD). At the first manifestation of the disease, 8 patients (89%) had a branch retinal artery occlusion on FA, 8 (89%) had neurologic symptoms (headache, n = 6; focal neurologic deficit, n = 5; or encephalopathy, n = 4), and 6 (67%) had auditory symptoms (hearing loss, n = 5; tinnitus, n = 3; or peripheral vertigo, n = 1). Only 5 patients (56%) fulfilled the SuS triad at the onset of the disease. The mean time before diagnosis was 5 months (median, 0.4 months). The lumbar puncture findings were normal (<5 cells and 28–52 mg/dL of protein) in 2 patients and revealed a slight pleocytosis (mean, 12.3 cells/mm3; range, 0–67 cells/mm3) and an elevation of CSF protein (mean, 90 mg/dL; range, 31–274 mg/dL) in all others. Detailed clinical characteristics of patients are described in Table 1. Detailed characteristics of the 73 patients included in the control group are provided in Table 2.
Clinical characteristics of patients with Susac syndrome at baseline and during follow-up
Clinical characteristics of the control group at baseline
MR Imaging Findings
LME.
Patients with SuS were significantly more likely to present with LME: 5/9 (56%) versus 6/73 (8%) in the control group (P = .002). They had a significantly higher LME burden with ≥3 lesions in 5/9 patients versus 0/73 (P < .001). Regions of LME were significantly more likely to be located in the posterior fossa: 5/9 versus 0/73 (P < .001) (Fig 1).
There was significantly more associated postcontrast T1-weighted imaging enhancement in the SuS group than in the control group: 4/9 (44%) versus 4/73 (5%) (P = .004). Detailed MR imaging findings are presented in the On-line Table.
Intraparenchymal Focal pcFLAIR Hyperintensities.
There was no significant difference between the 2 groups in the presence of intraparenchymal focal pcFLAIR hyperintensities: 9/9 (100%) versus 70/73 (96%). However, they were significantly more often described as inflammatory in the control group: 2/9 (22%) versus 62/73 (85%) (P < .001).
There was no significant difference between the 2 groups in the presence of CC focal pcFLAIR hyperintensities: 9/9 (100%) versus 51/73 (70%). However, they were significantly more often described as located in the central portion of the CC in the SuS group: 7/9 (78%) versus 3/51 (6%) (P < .001). There was no statistically significant difference between the 2 groups for associated enhancement on postcontrast T1-weighted images.
Interobserver Agreement
Interobserver agreement was good for detecting LME and intraparenchymal lesions: κ = 0.79; 95% CI, 0.31–1 and κ = 0.77; 95% CI, 0.57–0.90, respectively.
Follow-up
Clinical Characteristics.
The median follow-up time for the patients with SuS was 46 months (interquartile range, 25) with a total of 53 clinical evaluations. Seventeen relapses occurred during follow-up in 6 (67%) patients (median number, 1.5; interquartile range, 1.75 per patient). Throughout the course of the disease, all patients were treated with acetylsalicylic acid; 80%, with prednisone and intravenous immune globulin; and 70%, with immunosuppressive drugs. Five patients started immunosuppressive therapy after diagnosis, and 2, after a relapse. Detailed clinical follow-up characteristics are shown in Tables 1 and 3.
Follow-up clinicoradiologic data of patients with Susac syndrome
Thirty-six FAs were performed during the follow up, showing small, focal, and occlusive lesions of retinal arterioles in the retinal periphery in 6/9 (67%) patients. Of 72 eyes evaluated, worsening of the lesion severity was found for 14; stability, for 34; improvement, for 13; and dissociation, for 11.
MR Imaging Findings
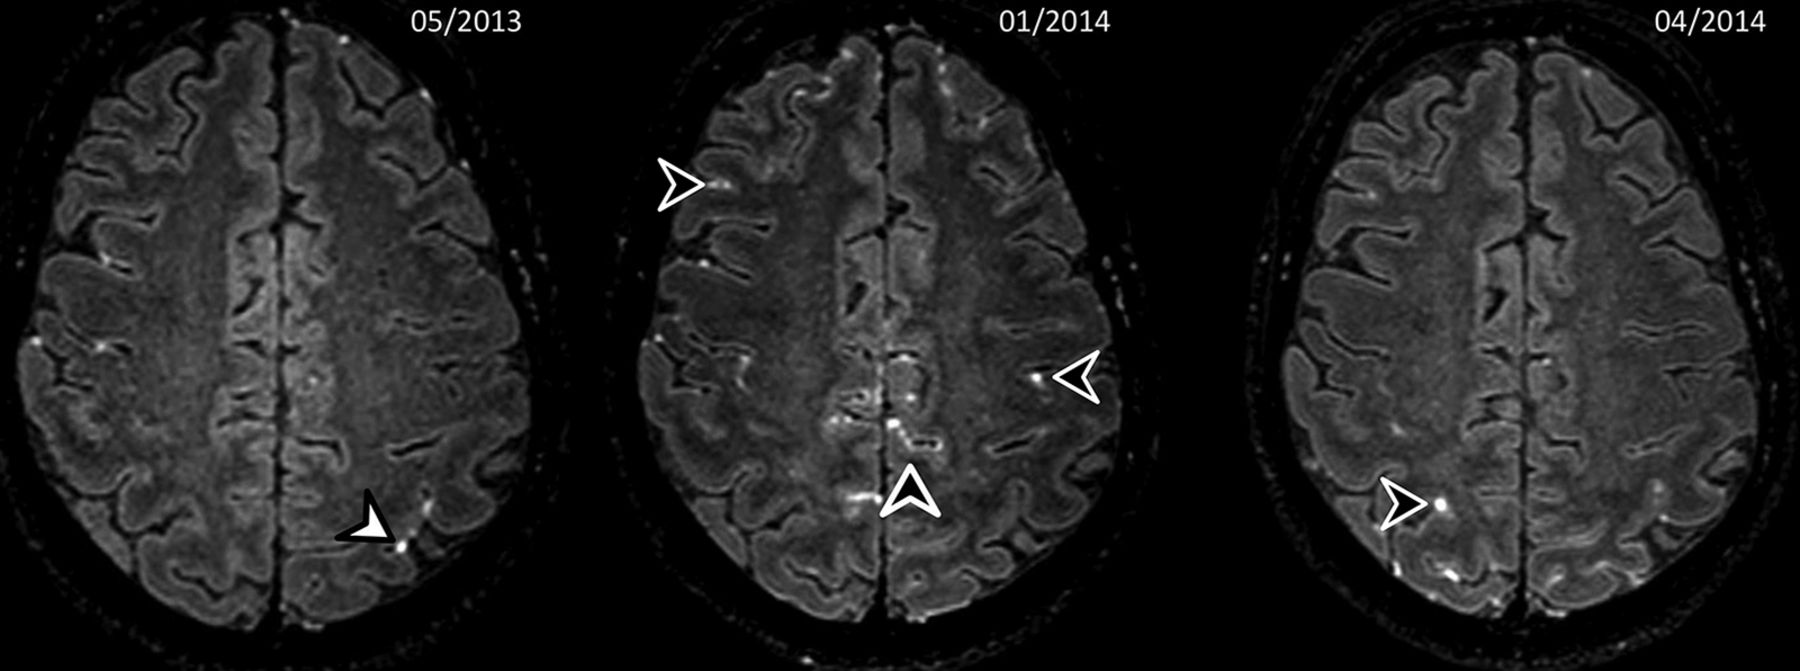
Fifty-three MRIs were reviewed (mean number, 5.9 per patient). LME was seen in 7 of 9 (78%) patients on 40 (75%) follow-up MRIs. LME load remained unchanged in 23%, was decreased in 39%, and was increased in 39% of cases. It was dissociated in 50% of cases. (Fig 2). Intraparenchymal focal pcFLAIR hyperintensity lesion load remained unchanged in 36%, was decreased in 23%, and was increased in 41% of MRIs. It was dissociated in 18% of cases. Detailed MR imaging findings are shown in Table 3.

One-year follow-up 3D postcontrast FLAIR MR images in an axial plane showing a dissociated evolution of the regions of leptomeningeal contrast-enhancement in a patient with a Susac syndrome. Sequential MRIs show disappearance of the left parietal regions of leptomeningeal contrast enhancements (white arrowhead) and onset of multiple new regions of leptomeningeal contrast enhancement (black arrowheads), some of which disappeared during follow-up.
Association between MR Imaging Findings and Disease Course
There was a strong relationship between the occurrence of a clinical relapse and the increase of LME or intraparenchymal focal pcFLAIR hyperintensities: OR = 6.2; 95% CI, 1.6–59.7 and OR = 5; 95% CI, 1.3–37.7, respectively. There was a nonsignificant association between a worsening of the lesion severity on FA and an increase of LME or intraparenchymal focal pcFLAIR hyperintensities: OR = 2.8; 95% CI, 0.430 and OR = 3.6; 95% CI, 0.6–30, respectively.
Post Hoc Power Analyses
Post hoc power analyses performed on both groups for the appearance of leptomeningeal abnormalities showed a very high power of 90%. For the subgroup of patients with Susac, post hoc power analysis showed a power of 72%.
Discussion
Our study showed that LME occurred frequently in SuS and may be helpful for diagnosis and in predicting clinical relapse. It is the first study to investigate the prevalence of LME on pcFLAIR at 3T MR imaging in SuS alongside the main differential diagnoses of MS or CIS. It is also the largest follow-up study of patients with SuS with MR imaging, to our knowledge. These results add to the body of knowledge regarding MR imaging findings in SuS as well as suggesting possible pathophysiologic mechanisms.
LME was more frequent in our study than in a previous report using postcontrast T1-weighted imaging (56% versus 33%),10 but the pcFLAIR technique has shown greater ability to detect LME and is considered the reference technique to assess its presence.9,18⇓–20
LME is not specific to SuS and has been observed in various pathologies associated with blood-meningeal barrier dysfunction, such as after stroke,21 posterior reversible encephalopathy syndrome,22 brain tumors,23 vasculitis,24 neurosarcoidosis,25 CNS infections, MS,20,26 HIV, or human T-cell lymphotropic virus type 1–associated myelopathy, but also in healthy volunteers.26 However, LME is more frequent, and its pattern is unique in patients with SuS, which is highly relevant in clinical practice because it could be useful for differentiating SuS from its main differential diagnoses such as MS or CIS. Posterior fossa lesions and a high lesion burden (≥3) were found in more than half of our patients but in none of the control group, which is in accordance with MS studies showing mostly supratentorial and uni- or bifocal lesions.27,28
LME could also be useful for discriminating patients with SuS from those with neuromyelitis optica because the latter are much less likely to present with LME at onset or during follow-up.29 The frequent involvement of the posterior fossa in SuS (cerebellum, middle cerebellar peduncles, and brain stem) has been reported previously, but only for white matter lesions.10,30 Moreover, during follow-up, our study showed that LME load was evolving with time with an increase of 39% and a decrease of 39% shown on follow-up MRIs. This finding was not reported in MS and could also be used to discriminate those with SuS from patients with MS or CIS. Therefore, LME might considerably strengthen the radiologic diagnostic criteria for SuS4 and should be included in further recommendations and guidelines. The overall number of regions of LME as well as their shape and location are the most important findings and should be reported to help radiologists and clinicians when diagnosing SuS.
Our findings might provide details concerning the possible pathophysiologic mechanisms of SuS. Pathophysiologically, CSF-restricted enhancement on pcFLAIR images is supposed to be an expression of a breakdown of the blood-meningeal barrier, directly related to ongoing inflammation and an immune-mediated neurologic condition in individuals infected with neurotropic viruses.26 Therefore, the different patterns between the SuS and control groups could be explained by different blood-meningeal barrier dysfunctions: a specific focal reaction to the site of inflammation in MS and generalized angiopathy in SuS. Involvement of multiple foci in SuS likely represents contained areas of vascular leakage secondary to endotheliopathy. Likewise, histopathologic findings in SuS cases showed T-cell inflammation involving small-to-medium-sized leptomeningeal vessels.31 Other retinal histopathologic32 findings demonstrated vascular occlusion of retinal blood vessels without thrombosis and serous-filled spaces between the retinal blood vessels and the internal limiting membrane, resulting from the breakdown of the blood-retinal barrier. Decreased Adenosine diphosphatase (ADPase) activity in some peripheral blood vessels also suggested endothelial cell dysfunction. The association of SuS with anti-endothelial cell antibodies further supports the role of endothelial pathology.33 Vascular leakage could also be indicated by arteriolar wall hyperfluorescence observed on FA, known to be highly suggestive of SuS.34
The other primary radiologic findings are in line with previous reports. We reported intraparenchymal focal pcFLAIR hyperintensities and CC involvement in all our patients with SuS, which is in accordance with the literature.5,10 The specificity of white matter lesions for diagnosis remains low. Lesions of the central portion of CC were significantly more frequent in patients with SuS in our study, as reported previously.6,10,16 This particular pattern is due to microinfarctions involving the microvascular blood supply of the CC.35 Absinta et al26,27 showed that LME was dissociated from the formation of new white matter lesions in MS and suggested that LME might localize inflammation-related focal disruption of the blood-meningeal barrier and associated scarring. We believe that the pathophysiology is the same in patients with Susac syndrome, with LME reflecting a blood-meningeal barrier disruption, whereas intraparenchymal hyperintensities are due to microinfarctions.
During follow-up, there was a significant association between an increase in the number of regions of LME and clinical relapses in patients with SuS, with an OR of 6.2, confirming an observation on 2 patients in the literature.30 LME could therefore become an interesting biomarker to monitor disease activity, predict clinical relapses, and plan the therapeutic approach, similar to the T2 lesion load in CIS36 or MS.37
This study has some limitations. First, the clinical retrospective design may have led to loss of clinical data capture, though regular and frequent follow-up at our institution with systematic neurologic examinations and hearing and visual evaluations with repeat FA may have limited such bias. Second, the sample was small due to the single-center study design and the rarity of the disease. Third, our control group consisted of patients with optic neuritis associated with MS or CIS, possibly lowering the probability of LME. Notably, LME was reported to be rare in relapsing-remitting MS and in CIS38 and most common in patients with progressive forms of MS, half of whom showed pcFLAIR with a diagnosis of secondary-progressive MS.28 Fourth, although radiologists were blinded to clinical data, SuS and MS/CIS have different morphologies, which might have led to a recognition bias. To minimize this effect, a double reading was performed independently by 2 trained and experienced neuroradiologists with instructions to focus and report LME before intraparenchymal lesions. Fifth, we compared patients with SuS with those with MS/CIS only, though it would have been interesting to compare them with patients with other autoimmune, inflammatory, or possibly infectious etiologies with LME. Sixth, we performed only postcontrast FLAIR and T1WI, thus preventing us from drawing conclusions about the underlying pathophysiologic processes. Further studies including pre- and postcontrast imaging would allow us to determine whether LME is due to a leak of the contrast or is only from a T2 lesion with a leak of gadolinium due to an inflammatory process, with potential concerns regarding gadolinium accumulation.
Conclusions
Our study showed that LME occurred frequently in SuS and may be helpful for diagnosis and in predicting clinical relapse. Large multicenter studies are needed to confirm our findings and establish LME as a useful biomarker in SuS.
Acknowledgments
Paul Kretchmer and Laura McMaster provided professional English language medical editing of this article.
Footnotes
Sarah Coulette and Augustin Lecler contributed equally to the work
Disclosures: Julien Savatovsky—UNRELATED: Payment for Lectures Including Service on Speakers Bureaus: Medtronic, Biogen, Sanofi; Travel/Accommodations/Meeting Expenses Unrelated to Activities Listed: Bayer Healthcare.
Kevin Zuber, MSc, Biostatistician, Clinical Research Unit, Fondation Ophtalmologique Adolphe de Rothschild conducted the statistical analysis.
REFERENCES
- Received November 4, 2018.
- Accepted after revision May 13, 2019.
- © 2019 by American Journal of Neuroradiology


