
Abstract
BACKGROUND AND PURPOSE: Reductions in magnetization transfer ratio have been associated with brain microstructural damage. We aim to compare magnetization transfer ratio in global and regional GM and WM between individuals with Alzheimer disease and healthy control participants to analyze the relationship between magnetization transfer ratio and cognitive functioning in Alzheimer disease.
MATERIALS AND METHODS: In this prospective study, participants with Alzheimer disease and a group of age-matched healthy control participants underwent clinical examinations and 3T MR imaging. Magnetization transfer ratios were determined in the cortex, AD-signature regions, normal-appearing WM, and WM hyperintensities.
RESULTS: Seventy-seven study participants (mean age ± SD, 72 ± 8 years; 47 female) and 77 age-matched healthy control participants (mean age ± SD, 72 ± 8 years; 44 female) were evaluated. Magnetization transfer ratio values were lower in patients with Alzheimer disease than in healthy control participants in all investigated regions. When adjusting for atrophy and extent of WM hyperintensities, significant differences were seen in the global cortex (OR = 0.47; 95% CI: 0.22, 0.97; P = .04), in Alzheimer disease–signature regions (OR = 0.31; 95% CI: 0.14, 0.67; P = .003), in normal-appearing WM (OR = 0.59; 95% CI: 0.39, 0.88; P = .01), and in WM hyperintensities (OR = 0.18; 95% CI: 0.09, 0.33; P ≤ .001). The magnetization transfer ratio in these regions was an independent determinant of AD. When correcting for atrophy and WM hyperintensity extent, lower GM magnetization transfer ratios were associated with poorer global cognition, language function, and constructional praxis.
CONCLUSIONS: Alzheimer disease is associated with magnetization transfer ratio reductions in GM and WM regions of the brain. Lower magnetization transfer ratios in the entire cortex and AD-signature regions contribute to cognitive impairment independent of brain atrophy and WM damage.
ABBREVIATIONS:
- AD
- Alzheimer disease
- CERAD
- Consortium to Establish a Registry for Alzheimer’s Disease
- MMSE
- Mini-Mental State Examination
- MTI
- magnetization transfer imaging
- MTR
- magnetization transfer ratio
- NAWM
- normal-appearing white matter
Alzheimer disease (AD) represents the most common cause of dementia. Only a few neuroimaging biomarkers have been approved for clinical use, and most are still objects of research.1 Although structural MR imaging contributes to the exclusion of other possible causes of a dementia syndrome, brain atrophy measures have only modest sensitivity and specificity for the differential diagnosis of dementia.2 The role of MR imaging techniques that allow assessment of microstructural brain changes, such as DTI and magnetization transfer imaging (MTI) for detecting AD-related tissue abnormalities, is still widely unknown. Numerous DTI studies have reported loss of WM integrity in AD and related this to tau accumulation in AD-specific regions.3 Only a few studies used MTI to explore microstructural tissue abnormalities in AD.
The magnetization transfer ratio (MTR), which can be derived from MTI, has been shown to be associated with axonal attenuation and myelin content.4⇓-6 In patients with AD, MTR reductions were reported in the whole-brain analyses,7⇓-9 cortical GM,8,10 global WM,10 hippocampus,7,11,12 and temporal lobes.8 In a longitudinal study of our own group, patients with AD had significantly lower global MTR values than control participants. MTR declined significantly over a follow-up period of 12 months and was paralleled by a brain tissue loss of 2.2% per year.13 So far, only a few studies have explored the association between regional MTR changes and cognition in patients with AD. Van der Flier et al9 reported a strong association between whole-brain MTR and global cognitive deterioration in patients with AD, but there was no significant relationship between regional MTR reductions and domain-specific cognitive impairment. In our previous study, we observed direct associations between MTR and Mini-Mental State Examination (MMSE) scores for the hippocampus, putamen, and thalamus. The relationship was stronger in the left than in the right hemisphere.13
Here we extend previous work by assessing the role of MTR reductions in the GM and WM in distinguishing patients with mild to moderate AD from healthy control participants, and we investigate their associations with cognitive decline independent of atrophy and WM damage.
MATERIALS AND METHODS
Study Participants
This prospective study included 77 participants with AD from the longitudinal cohort study Prospective Dementia Registry Austria (PRODEM),14 a multicenter study. Current study participants originate exclusively from the Graz center because it was the only center where an MTI sequence had been included in the MR imaging protocol. The study was approved by the ethics committee of the Medical University of Graz, and informed consent was signed by all participants or their caregivers. The data that support the findings of this study are available on request from the corresponding author (R.S.). Dementia was diagnosed according to the Diagnostic and Statistical Manual of Mental Disorders-IV15 and National Institute of Neurological and Communicative Disorders and Stroke and the Alzheimer’s Disease and Related Disorders Association (NINCDS-ADRDA) criteria.16 The severity of dementia was determined according to the MMSE score, as previously described.17 A group of 77 age-matched healthy control participants was selected from the Austrian Stroke Prevention Study, a large prospective single-center longitudinal study of the healthy older adult population of the city of Graz, Austria, including individuals without neuropsychiatric disease randomly selected from the community register.18 All participants underwent a comprehensive clinical evaluation and 3T MR imaging on the same scanner with identical acquisition parameters. The cognitive function of the participants with AD was assessed with the MMSE19 and the Consortium to Establish a Registry for Alzheimer Disease (CERAD)20 test battery.
Image Acquisition
MR imaging was performed on a 3T whole-body MR system (Tim Trio, Siemens) with a 12-channel head coil. The MR imaging protocol included a T2 FLAIR sequence (TR/TE/TI = 10,000/69/2500 ms, number of slices = 40, section thickness = 3 mm, in-plane resolution = 0.86 mm ×0.86 mm), a T2-weighted sequence with 2 echoes (TE1/TE2/TR = 10/72/5260 ms, number of slices = 40, section thickness = 3mm, in-plane resolution = 0.86 mm ×0.86 mm), and a 3D T1-weighted magnetization-prepared rapid acquisition of gradient echo sequence with whole-brain coverage (TR/TE/TI = 1900/2.19/900 ms, flip angle = 9°, isotropic resolution = 1 mm).
Additionally, MTI was performed with a spoiled 3D gradient-echo sequence (TR/TE = 40/7.38 ms, flip angle = 15°, number of slices = 40, section thickness = 3 mm, in-plane resolution = 0.86 mm×0.86 mm), which was performed twice, with and without a Gaussian-shaped radiofrequency saturation prepulse.
Image Processing
MTR maps were calculated according to the formula MTR = (Mo-Mss)/Mo, in which Mss and Mo are the signal intensities obtained with and without MT saturation, respectively. For regional assessment of MTR values, the cortical structures were segmented fully automated using FreeSurfer (version 5.3; http://surfer.nmr.mgh.harvard.edu). The technical details of these procedures are described elsewhere.21,22 The volumes of all segmented structures were normalized by the estimated total intracranial volume. A visual quality check was done for each case using an in-house developed bash-script based tool, which provides a graphic summary of the segmentations, overlaid on the T1-weighted image. Of all segmentations provided by FreeSurfer, we analyzed 6 ROIs (AD-signature regions) that were previously identified as sensitive to early effects of AD.23 These regions included the hippocampus, parahippocampal cortex, cuneus, precuneus, entorhinal cortex, and inferior parietal lobule.
After affine registration with the T1-weighted scan using FSL FLIRT (version 6; https://fsl.fmrib.ox.ac.uk/fsl/fslwiki/FLIRT), regional masks were overlaid on the MT-weighted images. To identify and exclude CSF-contaminated voxels in the registered cortical masks, we performed a mask-segmentation optimization using a semiquantitative T2 map,24 which was calculated from the mono-exponential decay of both echoes of the T2-weighted sequence and registered to the T1 sequence. After a histogram analysis of the T2 map for each brain-lobe mask, voxel intensities above the full width at half maximum of the histogram peak were defined as CSF-contaminated voxels and were therefore excluded from further analyses. Finally, median MTR values were extracted from the CSF-corrected brain lobes using FSLSTATS (https://fsl.fmrib.ox.ac.uk/fsl/fslwiki/Fslutils). To assess binary masks of WM hyperintensities, we segmented hyperintense T2 lesions on the FLAIR images with an in-house-developed semiautomatic region-growing tool.25 A normal-appearing white matter (NAWM) mask was calculated by subtracting the manually segmented WM hyperintensity masks from the total WM mask obtained by FreeSurfer. The extent of WM hyperintensity was assessed according to the Fazekas scale.26
Statistical Analysis
For data analysis, we used SPSS (version 23; IBM). Assumptions of normal distribution were tested with the Kolmogorov–Smirnov test. For bivariate correlations, we performed the Pearson test and a paired t test, and in case of non-normally distributed samples, a Wilcoxon signed-rank test was used to compare the 2 groups. Z-scores were computed for raw scores of MTR and normalized volumes, and they were used in the regression analyses. Logistic regression analyses were performed to correlate the diagnosis of AD with MTR metrics in the global cortex, AD-signature regions, NAWM, and WM hyperintensities. To assess the associations between MTRs and performance on the MMSE and on CERAD, linear regressions were calculated with cognition as the dependent variable and MTR as the predictor variable. All models were adjusted for age, sex, years of education, normalized regional volumes, and Fazekas score. Brain volume and Fazekas score were considered as covariates to determine if MTRs relate to AD and to cognitive impairment independent of atrophy and extent of WM hyperintensities. For each regression coefficient, the 95% confidence interval and the P value were determined. A P value <.05 was considered statistically significant.
RESULTS
Participant Characteristics
A total of 156 individuals with dementia were confirmed eligible and recruited in the longitudinal cohort study PRODEM in Graz. We excluded 19 participants who were affected by other causes of dementia and 60 individuals who had not undergone a MR imaging examination with sufficient MTI quality (Fig 1). Seventy-seven study participants with AD were included in our study. They were 30 men and 47 women with a mean age of 72 ± 8 years, ranging from 51 to 87 years. Fifty-five patients had mild AD (MMSE score: range 21–28, mean ± SD: 23.98 ± 2.13), and 22 patients were diagnosed with moderate to severe AD (MMSE score: range 14–20, mean ± SD: 17.14 ± 1.86). Seventy-seven healthy age-matched individuals (±1 year) served as control participants. Their mean age was also 72 ± 8 years, ranging from 51 to 87 years. All control participants had MMSE scores ≥24 with the exception of 3 individuals who had MMSE scores of 23. None of the control participants had symptoms of dementia or mild cognitive impairment. The comparison of demographics, neuropsychological findings, and MR imaging findings between AD and healthy control participants are displayed in Table 1. Whereas the distribution of sex was similar in both investigational subsets (P = .62), the study participants with AD performed significantly worse on the MMSE (P < .001), had lower GM (P < .001) and NAWM (P = .01) volumes, and had higher WM hyperintensity volumes (P = .02). A higher grade of chronic small-vessel disease, indicated by Fazekas grade 2 or 3, was present in the 63.7% of the patients with AD and in the 40.3% of the healthy control participants.
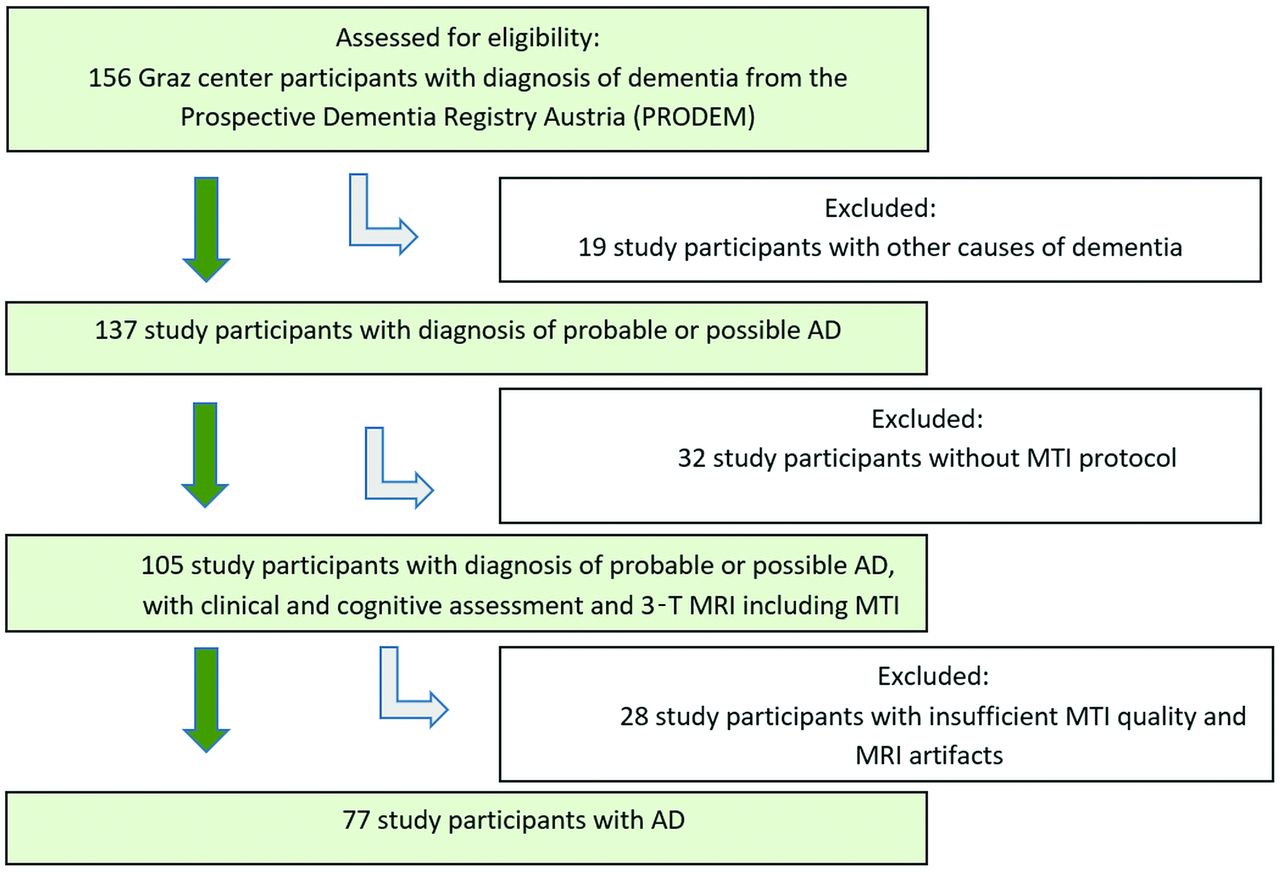
Flowchart shows the recruitment of the study participants with AD.
Demographic, neuropsychological, and MR imaging findings of study participants
Comparison of MTR Between Patients with AD and Healthy Control Participants
The study participants with AD had lower MTR values in the GM (P < .001), NAWM (P = .003), and WM hyperintensities (P < .001) (Table 1). Logistic regression analyses demonstrated that lower MTR values in global cortex (OR = 0.47; 95% CI: 0.22, 0.97; P = .04), AD-signature regions (OR = 0.31; 95% CI: 0.14, 0.67; P = .003), NAWM (OR = 0.59; 95% CI: 0.39, 0.88; P = .01), and WM hyperintensities (OR = 0.18; 95% CI: 0.09, 0.33; P ≤ .001) remained significantly related to AD even after correction for age, sex, and years of education as well as brain atrophy and extent of WM hyperintensities (Table 2). When considering the AD-signature regions individually, we found that decreased MTR values in the parahippocampal cortex (OR = 0.61; 95% CI: 0.37, 0.99; P = .04), cuneus (OR = 0.26; 95% CI: 0.09, 0.73; P = .01), precuneus (OR = 0.24; 95% CI: 0.12, 0.45; P ≤ .001), and entorhinal cortex (OR = 0.57; 95% CI: 0.35, 0.95; P = .03) were associated with AD diagnosis (Online Supplemental Data). Furthermore, we found that reduced MTRs in NAWM and WM hyperintensities were related to AD independent of dementia severity; by contrast, in only the patients with mild AD, lower MTRs in the AD-signature regions (OR = 0.38, 95% CI: 0.17, 0.82; P = .02) were associated with AD.
Logistic regression analysis—lower MTRs relate to AD independent of normalized regional brain volume and white matter damage
MTR and Cognition in AD
Table 3 displays the associations between MTRs and cognitive functioning in the AD cohort. Only GM MTRs were significantly related to cognitive measures; no such relationship existed for WM MTRs. When adjusting for age, sex, education, normalized regional volume, and Fazekas score, lower MTRs in the global cortex were related to lower scores on the language subtest of the CERAD test battery (β = 0.31, P = .02). Only a nonsignificant trend was seen for the association between cortical MTR and MMSE and between global MTRs in the AD-signature regions and poorer performance on CERAD subtests for language function and constructional praxis. However, when considering the AD-signature regions individually, lower MTRs in the cuneus (β = 0.30; 95% CI: 0.26, 1.95; P = .01) and hippocampus (β = 0.29; 95% CI: 0.03, 2.22; P = .04) were significantly related to a poorer performance on the MMSE. With regard to the CERAD test, reduced MTRs in the parahippocampal cortex (β = 0.38; 95% CI: 0.28, 1.41; P = .006), cuneus (β = 0.45; 95% CI: 0.51, 1.56; P ≤ .001), and entorhinal cortex (β = 0.35; 95% CI: 0.25, 1.28; P = .004) were associated with worse constructional praxis (Online Supplemental Data). There existed no significant associations with other CERAD subtests. No effect of laterality on the MTR correlations with poor language function was found (data not shown).
Linear regression analysis in AD—cortical MTRs relate to poorer language function in patients with AD
DISCUSSION
Our study shows lower MTRs in cortical and subcortical structures, including AD-signature regions, in NAWM, and WM hyperintensities in patients with AD. Lower WM MTRs were related to AD diagnosis in patients with both mild and moderately severe AD. However, MTRs in the AD-signature regions were related to AD diagnosis only in study participants with mild disease. One explanation for these discrepant associations between GM MTRs in mild versus moderately severe AD might be that GM microstructural changes are indeed an early disease phenomenon. Yet we cannot exclude that the small sample size of patients with severe disease and resulting low statistical power are responsible for the lack of a significant association between MTR in GM regions and AD diagnosis. With regard to cognition, only GM but none of the WM MTR measures were related to cognitive functioning in patients with AD. The effects of MTR reductions in the cortex and in the AD-signature regions on global cognition, language function, and constructional praxis were modest, but they were independent of brain atrophy and WM damage. Previous work also reported reduced MTRs in the cortex,8,10 hippocampus,7,27 and WM10,28 in AD. So far, only a limited number of studies have examined the relationship between MTR values and cognition in individuals with AD.7,9,10,29 In the current work, reduced MTRs in the GM were associated with worse global cognition, language function, and constructional praxis. Van der Flier et al9 reported an association between poorer cognitive performance and lower peak heights of the MTR histograms in the whole brain and frontal and temporal lobes. Here we extend this previous study by demonstrating that the association between MTR and cognition in AD exists particularly with cortical MTR and that it is independent of brain atrophy. Like others,7,10,29 we failed to observe a relationship between WM MTR and cognition in AD. We realize that we cannot rule out with certainty that reductions in MTR might have been caused by partial volume effects from the CSF as a consequence of atrophy in patients with dementia. CSF has very low MTR values, and sulcal enlargement could cause a reduction of MTR in voxels because of the combination of cortex and CSF.30 However, we do not believe that partial volume effects had a considerable effect in our study because cortical volume was considered as a confounder, and all MTR masks have been corrected by deleting voxels with high intensities in the co-registered pseudo-T2 map to prevent CSF contamination of cortical MTR. However, the histopathologic correlates of MTR reductions in the cortex in AD are widely unknown. Decreased MTRs caused by focal demyelination in the cortex were found in patients with multiple sclerosis,31 but it is unlikely that loss of cortical myelin is responsible for lowering of cortical MTRs in those with AD. A more likely explanation comes from a study of Patel and coworkers,32 who found that dendritic branching is likely to be the main driver of MTR values in the cortex because higher surface area of cellular membranes relates to greater magnetization transfer between the free water and bound water pool. The authors indicated that dendrites and their spines contribute 34-fold more exposure to the extracellular water than myelin and concluded that MTRs in the cortex are more sensitive to cellular membranes associated with dendrites than myelin.32 The loss of dendritic spines directly correlates with the loss of synaptic function. Patients with AD show a significant loss of synapses and their cognitive capabilities correlate strongly with synapse attenuation.33
Another possible explanation for MTR lowering in AD brains is posttranslational modification of axonal proteins. This is suggested by an MTI study on unfixed postmortem brain slices, which assessed blocks containing microscopically nonlesional brain tissue and microdissected adjacent tissue to quantify specific protein levels.34 The authors reported that lowering of MTR was caused by a hyperphosphorylation-related change in proton mobility. In line with this finding, altered cortical MTRs may thus reflect hyperphosphorylation of proteins such as tau and pathologic protein accumulation, a process that is known to precede cell death in AD and other primary neurodegenerative diseases.35 The mentioned mechanisms are in keeping with the main finding of our study that MTR changes in the cortex in patients with AD are at least partly independent of cortical volume and that cortical MTR reductions explain cognitive impairment beyond regional cortical atrophy.
Our study has several strengths. We investigated a considerably large sample of individuals with AD and of healthy community-dwelling older adults. The availability of a structural scan with high resolution allowed segmentation of cortical and WM compartments. One limitation of our study is that we used the 1984 NINCDS-ADRDA criteria for the diagnosis of AD.16 These criteria were standard at the time of patient recruitment into the study. Recently, the criteria have been revised, yet it was shown that the 1984 criteria provide a diagnostic sensitivity and specificity of 81% and 70%, respectively, in clinicopathologic studies.36 Another limitation was that the spatial resolution of the MT sequence was limited, and therefore partial volume effects caused by CSF in cortical regions cannot be ruled out with certainty. However, these effects should be small, and they have been considered in image postprocessing and in the statistical analyses by correcting for atrophy.
CONCLUSIONS
MTR values were reduced not only in the GM but also in the WM of patients with AD. Only the MTR values in the GM were related to cognitive impairment. At this point, the diagnostic contribution of MTR in patients with AD is still unknown, but our data indicate that it provides additional information beyond pure assessment of brain atrophy and WM damage. How AD-related pathophysiology can affect the MT mechanism in the GM is not fully determined. Moreover, longitudinal studies in the prodromal stages of AD are needed to evaluate if MTR is able to add to the prediction of conversion to AD.
Footnotes
The work originated from the Department of Neurology, Medical University of Graz, Auenbruggerplatz 22, 8036 Graz, Austria.
This study was funded by the Austrian Science Fund (FWF grant No. I2889-B31) and the German Research Foundation (DF DU1626/1-1).
Previously presented at: 6th Congress of the European Academy of Neurology, virtual congress, May 23, 2020.
Disclosures: Reinhold Schmidt—UNRELATED: Consultancy: AXON Neuroscience; Grants/Grants Pending: Austrian Science Fund.* *Money paid to institution.
Indicates open access to non-subscribers at www.ajnr.org
References
- Received July 1, 2020.
- Accepted after revision October 23, 2020.
- © 2021 by American Journal of Neuroradiology


Jump to section
Related Articles
Cited By...
- No citing articles found.