
Abstract
BACKGROUND: A noninvasive, safe, and economic imaging technique is required to identify epileptogenic lesions in the brain.
PURPOSE: Our aim was to perform a meta-analysis evaluating the accuracy of arterial spin-labeling in localizing the epileptic focus in the brain and the changes in the blood perfusion in these regions.
DATA SOURCES: Our sources were the PubMed and EMBASE data bases.
STUDY SELECTION: English language studies that assessed the diagnostic accuracy of arterial spin-labeling for detecting the epileptogenic zone up to July 2019 were included.
DATA ANALYSIS: The symptomatogenic foci of seizures in the brain were determined and used as the references. The relevant studies were evaluated using the Quality Assessment of Diagnostic Accuracy Studies-2 tool. The outcomes were evaluated using the pooled sensitivity, pooled specificity, pooled accuracy, diagnostic odds ratio, area under the summary receiver operating characteristic curve, and likelihood ratio.
DATA SYNTHESIS: Six studies that included 174 patients qualified for this meta-analysis. The pooled sensitivity, pooled specificity, and area under the summary receiver operating characteristic curve were 0.74 (95% CI, 0.65–0.82), 0.35 (95% CI, 0.03–0.90), and 0.73 (95% CI, 0.69–0.76), respectively. The accuracy of arterial spin-labeling for localizing the epileptic focus was 0.88 (accuracy in arterial spin-labeling/all perfusion changes in arterial spin-labeling) in cases of a positive arterial spin-labeling result. The epileptogenic zone exhibited hyperperfusion or hypoperfusion.
LIMITATIONS: Only a few studies were enrolled due to the strict inclusion criteria.
CONCLUSIONS: Arterial spin-labeling can be used for assessing, monitoring, and reviewing, postoperatively, patients with epilepsy. Blood perfusion changes in the brain may be closely related to the seizure time and pattern.
ABBREVIATIONS:
- ASL
- arterial spin-labeling
- QUADAS-2
- Quality Assessment of Diagnostic Accuracy Studies-2
- SOZ
- seizure onset zone
Epilepsy is the most common chronic neurologic disease, characterized by the occurrence of repeat seizures. Several diseases, including brain tumors, hypoxia-related brain diseases, and cerebral cortical dysplasia, can cause epilepsy. Electroencephalography, which identifies the epileptic discharges in the brain, was the earliest method applied for the diagnosis and localization of epileptic disorders.1,2 The development of imaging technology in recent years has enabled the use of conventional (structural) MR imaging and CT, which can locate and visualize the structural brain lesions responsible for epilepsy. However, not all patients with epilepsy exhibit structural changes in their brain tissue. Several animal and clinical studies have found that seizures can alter the metabolism and vascular perfusion in the brain tissue.3⇓⇓⇓⇓-8 Therefore, PET and SPECT can be used to locate lesions with metabolic abnormalities and an abnormal blood supply.
Currently, the treatment of epilepsy is mainly based on pharmacotherapy, and 20%–40% of patients may have refractory seizures. Surgery is the treatment of choice in patients with refractory epilepsy.9,10 Patients who are not drug-resistant with surgical conditions can also benefit from surgery.11 The accurate detection of the epileptic lesion is the key to the effectiveness of surgery. The surgical treatment plan mainly depends on the consistency of the clinical symptoms of the seizure and the findings of electroencephalography and structural MR imaging.12 PET and SPECT are used if both electroencephalography and structural MR imaging fail to identify the lesion.13⇓-15 However, the radiation exposure associated with PET and SPECT can have adverse effects on human health. Therefore, a noninvasive, safe, and economic imaging technique is required to identify the brain lesions responsible for epilepsy.
The development of functional MR imaging technology has made it possible to visualize the change in the CBF using arterial spin-labeling (ASL) (without the use of contrast agents) because ASL can magnetize protons in the circulating blood as an endogenous perfusion tracer.16,17 Several studies of neurologic diseases have shown a good correlation among ASL, DSC-perfusion MR imaging, and PET for evaluating the changes in CBF perfusion, and they support the credibility and feasibility of the clinical applications of ASL.18⇓⇓-21
ASL can be used to identify the location of epileptic lesions, with the potential to replace interventional examinations. However, most published research on this subject consists of experimental studies, with small samples and different results. There is controversy about the changes in the blood perfusion in the lesion area; some believe that perfusion is increased, and some believe that perfusion is reduced. The purpose of our study was to conduct a systematic review and meta-analysis of studies assessing the ability of ASL to locate epileptogenic foci. We aimed to obtain a clear idea of the accuracy of ASL for the localization of the epileptogenic focus and the changes of the blood perfusion of the lesion.
MATERIALS AND METHODS
Medical Subject Headings and terms such as “seizures” or “seizure” or “epilepsies” or “epilepsy” or “arterial spin-labeling” were used to search the PubMed and EMBASE data bases for studies published in English on ASL and epileptic foci up to July 13, 2019.
The search strategy was as follows: ((((((eclampsia) OR convulsion) OR epilepsy) OR epilepsies) OR seizure) OR seizures) AND arterial spin-labeling. We also manually sought related studies mentioned in the selected articles to ensure that all relevant research was included.
Studies that assessed the diagnostic accuracy of ASL in detecting the epileptogenic zone were included in the analysis. The symptomatogenic focus in the brain was determined from the studies that qualified for inclusion, and it was used as the reference. The outcomes were evaluated using the pooled sensitivity, pooled specificity, pooled accuracy, summary receiver operating characteristic, and likelihood ratio.
Study Selection
The inclusion criteria were as follows: 1) retrospective or prospective studies on epilepsy, 2) clinical studies that included at least 20 patients, 3) studies that located the brain lesions using ASL and used the clinical seizure focus (in the brain) as a reference, and 4) the availability of the true-positive, true-negative, false-positive, and false-negative nature of the findings in the given data. Reviews, abstracts, letters to the editor, editorials, and case reports were excluded. Two colleagues (F.J.D. and X.Q.H.)with extensive experience and expertise screened the qualified studies. Disagreements between the 2 analysts were resolved through discussion or by the third analyst (J.Y.Z.), who reassessed the search results, assessed the process, and read the included studies to ensure they met the inclusion criteria. We summarized the characteristics of the qualified studies, such as the authors of the study, the country where it was conducted, publication year, and reported data, namely, true-positive, false-negative, false-positive, true-negative, sensitivity, and specificity information. Moreover, we summarized the characteristics of the results of ASL and analyzed the accuracy of ASL in detecting the cortical epileptogenic zone under different conditions, such as hyperperfusion or hypoperfusion, and structural MR imaging with positive or negative findings.
The qualifying studies were evaluated using the Quality Assessment of Diagnostic Accuracy Studies-2 (QUADAS-2) tool. Each domain of the QUADAS-2 is used to judge the risk of bias, and the first 3 domains were assessed to ascertain their applicability.22,23
Statistical Analyses
MIDAS (Version 14.0; Stata module; https://econpapers.repec.org/software/bocbocode/s456880.htm) and RevMan (Version 5.3.5; https://training.cochrane.org/online-learning/core-software-cochrane-reviews/revman/revman-5-download) software were used to analyze the included studies. STATA (Version 14.0, with a bivariate mixed-effects regression model; StataCorp) was used to analyze the diagnostic test accuracy by collating the statistical indices (including the sensitivity, specificity, summary receiver operating characteristic, and so forth) and drawing a statistical chart.23
RevMan was used for the methodologic evaluation of the quality of the included studies. The heterogeneity of the qualifying studies was evaluated using the Cochrane Q Test statistic value (P) and the inconsistency index (I2).24
Publication Bias
The potential publication bias was evaluated using the Deek funnel plot asymmetry test. The slope coefficient: P < .1, indicated significant asymmetry.25
RESULTS
Literature Search
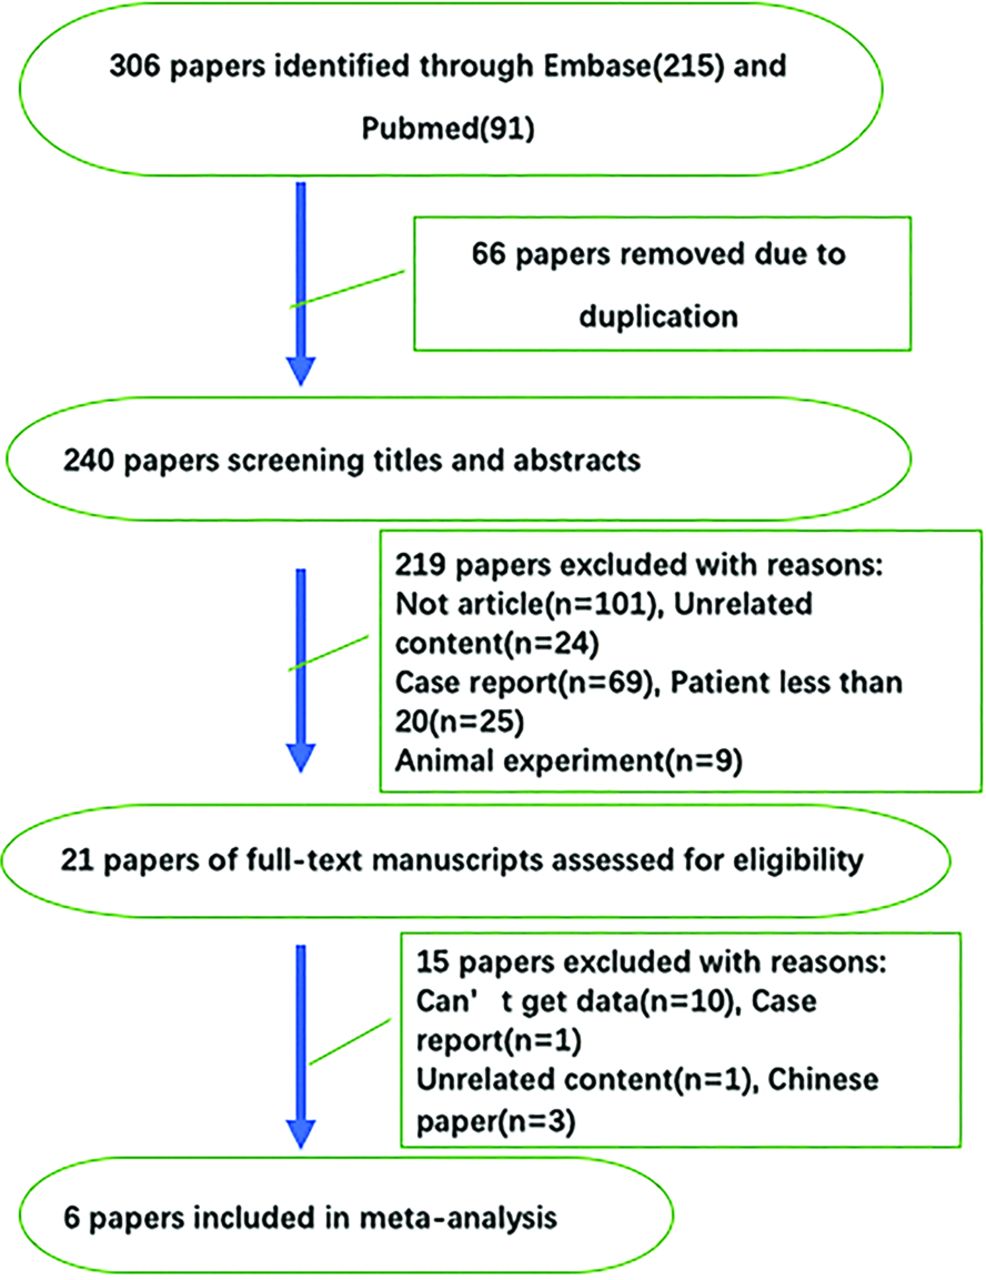
A total of 306 studies were selected through the search strategy. Six of 306 studies met the inclusion criteria and were included in this meta-analysis (Fig 1).

Data collection process.
Study Characteristics
The 6 retrospective diagnostic studies that qualified for inclusion in this meta-analysis21,26⇓⇓⇓-30 included 174 patients. The symptomatogenic zone of 155 patients was used as the reference. The characteristics of the qualifying studies are summarized in the Online Supplemental Data. We classified the results of the 6 studies, which are summarized in the Online Supplemental Data. Three studies (studies 3–5)21,28,29 performed quantitative analyses, while the other 3 studies (studies 1, 2, and 6)26,27,30 performed qualitative analyses (Table).
Characteristics of the included studies
Methodology Quality Assessment
The results of the QADAS-2 are presented in Fig 2. All the qualifying studies had a low risk of bias and were of high quality as per the QADAS-2 assessment.

Results of the QUADAS-2 tool. Risk of bias and applicability concerns summary (upper table). Risk of bias and applicability concerns graph (lower table).
Data Synthesis and Analysis
The pooled sensitivity, pooled specificity, and area under the summary receiver operating characteristic curve were 0.74 (95% CI, 0.65–0.82), 0.35 (95% CI, 0.03–0.90), and 0.73 (95% CI, 0.69–0.76), respectively (Figs 3 and 4). The positive and negative likelihood ratios were 1.1 (95% CI, 0.4–2.9) and 0.74 (95% CI, 0.13–4.09), respectively (Fig 5).

Forest plot showing the sensitivity for each specific study on the right y-axis and the specificity of the accuracy of ASL for detecting the epileptogenic zone.
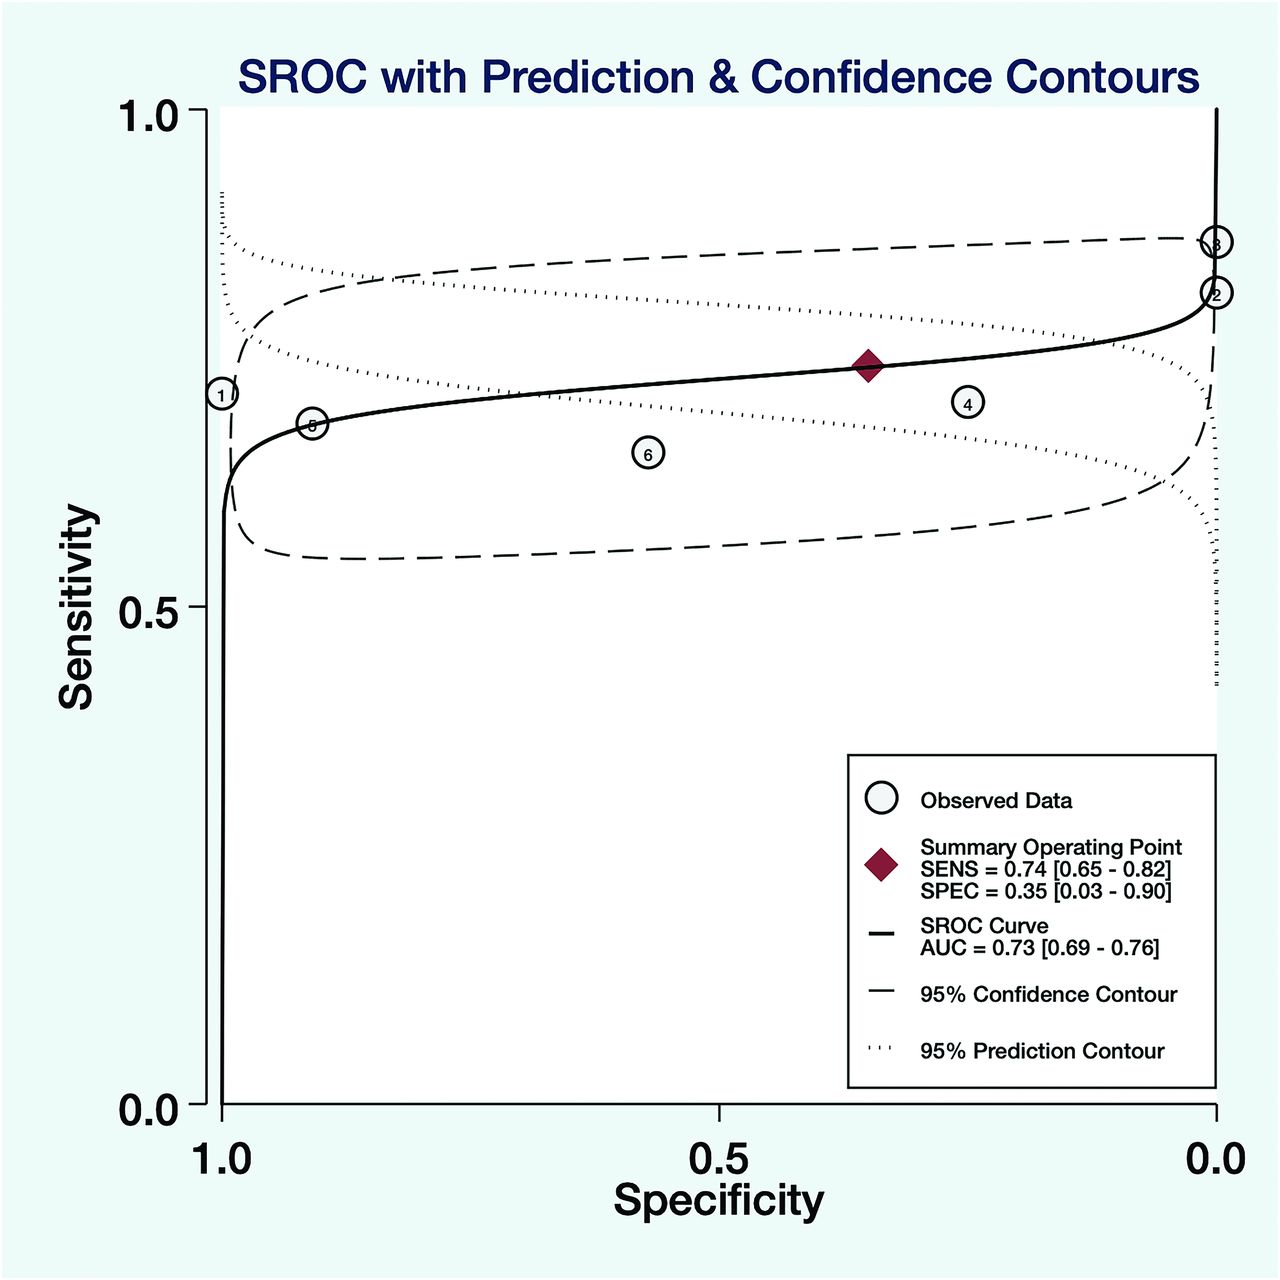
Summary receiver operating characteristic curves with prediction and confidence contour, 95% confidence contour, and 95% prediction contour for all included studies for analyzing the accuracy of ASL in detecting the epileptogenic zone (n = 6). SENS indicates sensitivity; SPEC, specificity; AUC, area under the curve; SROC, summary receiver operating characteristic.
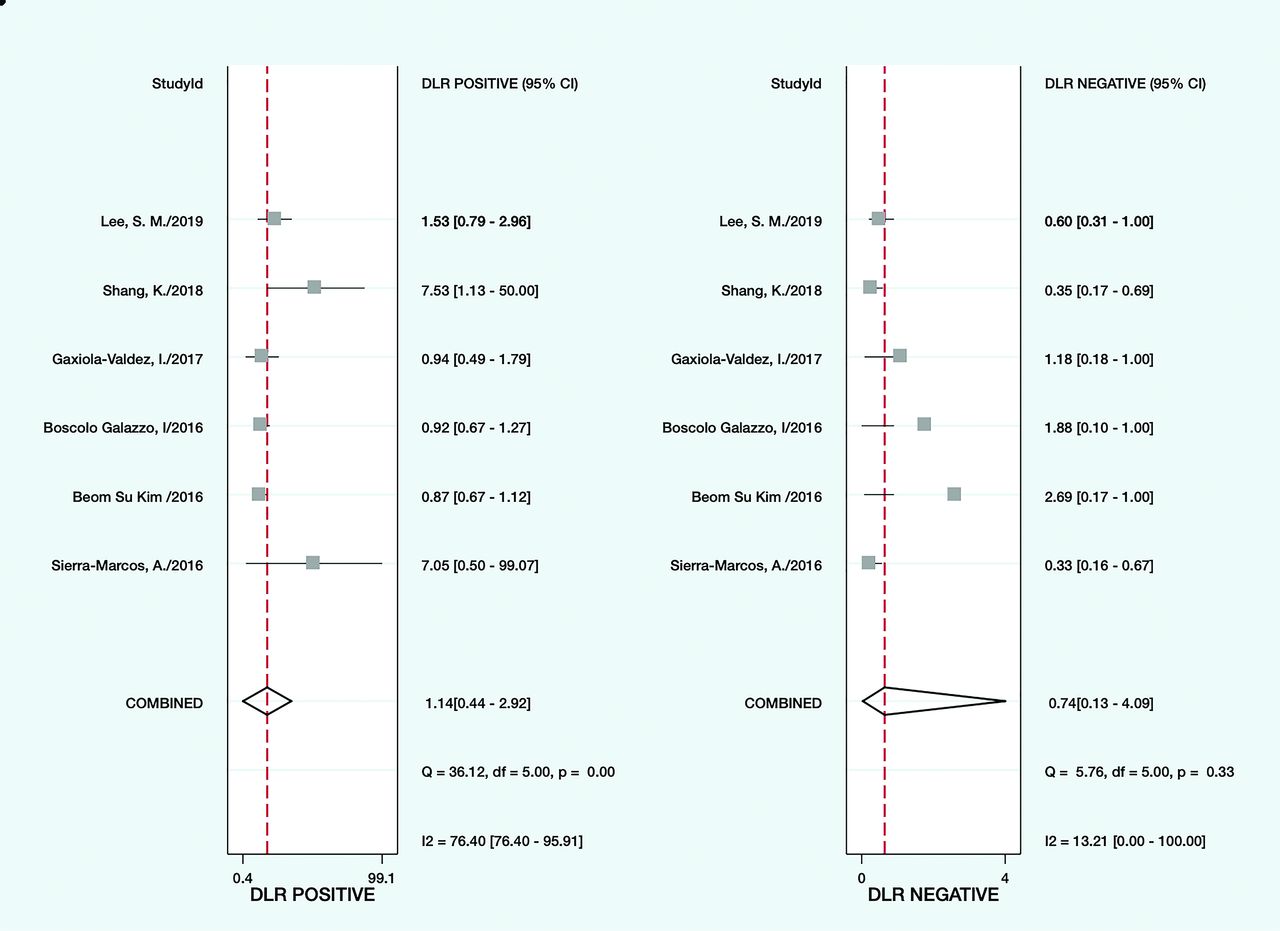
Forest plot showing the negative and positive likelihood ratios of the accuracy of ASL for each specific study on the right y-axis and in detecting the epileptogenic zone.
A total of 79 patients exhibited hypoperfusion in the epileptogenic zone; the epileptogenic zone was accurately located using ASL in 70 patients (accuracy rate, 88.6%) (Online Supplemental Data). However, 45 patients exhibited hyperperfusion in the epileptogenic zone; the epileptogenic zone was accurately located using ASL in 39 patients (accuracy rate, 87.7%). The classification of the structural MR imaging findings revealed that 26 patients showed abnormalities in the brain tissue, which was accurately located in 21 patients using ASL (accuracy rate, 65.5%). The brain tissue was normal in 87 patients; ASL accurately detected the lesions in 57 of these patients (accuracy rate, 80.8%).
ASL accurately located the lesions in 98 of 151 patients whose lesions were localized using video electroencephalography, with an accuracy rate of 64.9%.
The actual epileptogenic focus corresponded exactly with the symptomatogenic focus in 72 of 109 patients whose lesions were accurately localized using ASL. The ASL-localized lesion was partially consistent with the symptomatogenic seizure focus (it was smaller or larger) in the remaining 37 patients (Online Supplemental Data).
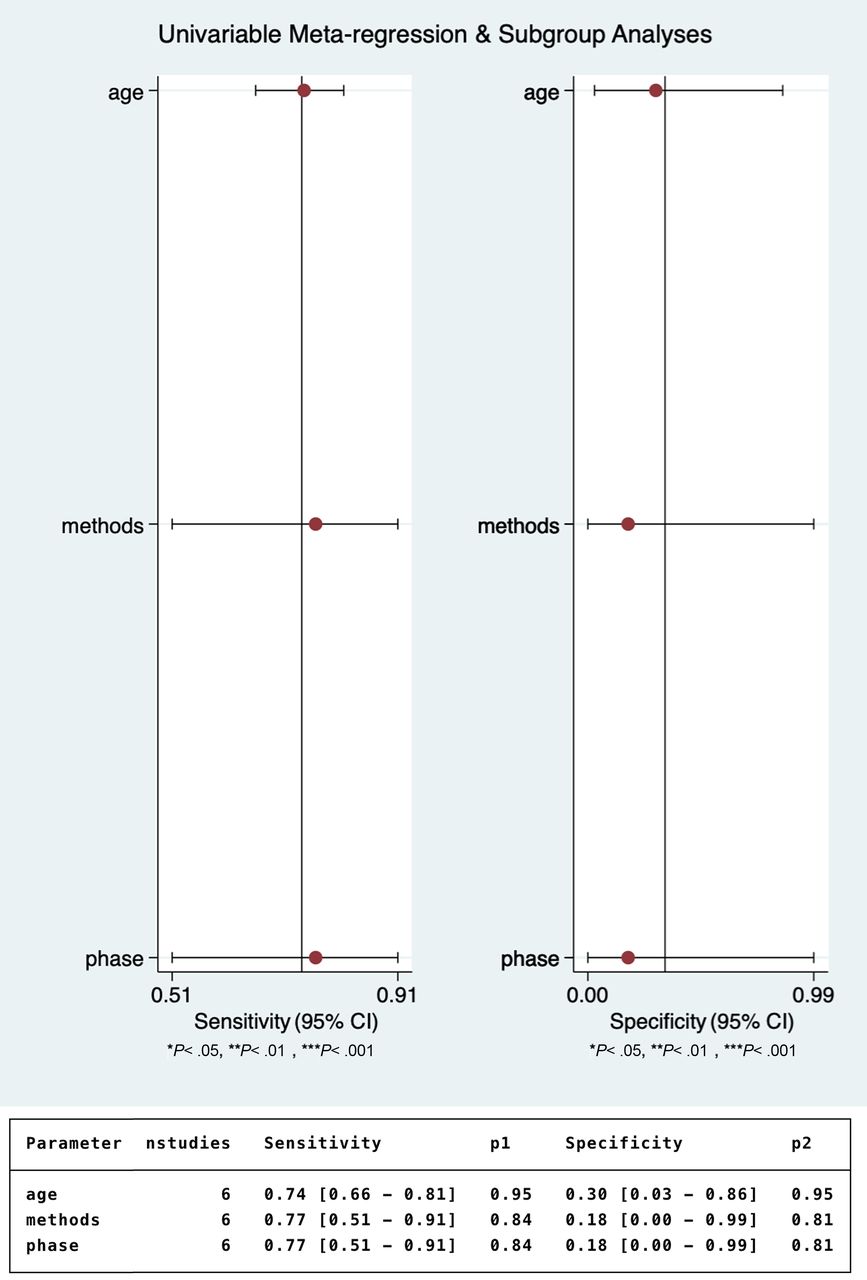
The P values of the patients' ages, measurement method, and time of onset of epilepsy were all > .01 in univariate logistic regression analysis (Fig 6).

Subgroup analysis of the effect of age, measurement methods, and seizure phase on the detection of the epileptogenic zone using ASL.
Publication Bias
The Deek funnel plot demonstrated a lack of evidence of publication bias, and the studies were dispersed symmetrically (P = .73, Fig 7).

The Deek funnel plot for the diagnostic odds ratio of ASL for detecting the epileptogenic zone.
DISCUSSION
Our study found that ASL was highly sensitive (0.74) in detecting changes in the CBF in patients with epilepsy. This sensitivity was especially high in patients with negative results on structural MRI. Animal experiments have shown that the blood vessel changes in the brain lesions of rats mainly include hyperemia and neuronal degeneration and that hyperperfusion caused by vascular changes was inextricably linked to the incidence of epilepsy.3⇓⇓-6 Clinical studies have found that increased neuronal activity caused by seizures is associated with increased neuronal metabolism and local blood flow.7⇓-9
In nonlesional epilepsy, when conventional MR imaging cannot detect a structural epileptogenic lesion, the goal is to identify the epileptogenic zone. During epileptic seizures, neuronal activity and metabolic demand in the focal area increase and the local blood flow produces corresponding changes to meet the needs of the neural activity.28⇓⇓⇓-32 Therefore, ASL can detect the seizure onset zone (SOZ) through the blood flow changes. The epileptogenic zone includes the SOZ, ie, the area of the cortex from which the epileptic discharge originates; the irritative zone, ie, the area of cortex where the epileptic discharge spreads; and the symptomatogenic zone, ie, the area of cortex that produces ictal symptoms and signs.
The irritative zone encompasses the SOZ and represents the seat of the hemodynamic response to neuronal activity and metabolic demand that may be evaluated with ASL. Therefore, ASL can detect CBF changes larger than only the SOZ, thus overestimating the real extent of the lesion. However, this phenomenon also occurs in other methods that investigate brain perfusion in epilepsy.
The accuracy of ASL for locating lesions was approximately 0.9, irrespective of hyperperfusion or hypoperfusion on MR imaging, which was almost consistent with its accuracy for the clinical location. Recent studies have shown that the accuracy of ASL is in concordance with that of [18F] FDG-PET and DSC MR imaging.18⇓⇓-21 Therefore, ASL can be used to measure changes in the CBF in patients with epilepsy, and the positive results are reliable,18,21 consistent with the results of our included studies. However, our study found that the specificity and negative likelihood results of ASL are relatively poor and that its negative results had low credibility. The specificity ranged from 1 to 0 (it was lower than 0.5 in most studies), as seen in the Online Supplemental Data.
We analyzed the data from the studies, which included patients without symptomatogenic foci in whom ASL failed to locate the lesion. These patients were judged as having true-negative results. The first, fourth, and sixth studies included patients with true-negative results (no clinical seizure focus, and ASL failed to locate the brain lesions). The fifth study also included 10 healthy controls. Strictly speaking, these patients should have been excluded because our inclusion criteria entailed the presence of a symptomatogenic focus for comparison. Therefore, these 3 studies had no patients with true-negative results. The patients in the second and third studies had known epileptic lesions; thus, the number of those with true-negative results was zero. Therefore, the specificity of the included studies would be zero.
The study population in clinical research usually consists of patients, and there is no healthy group for comparison, resulting in few or no true-negative results, poor specificity of the experiment, and unreliable results. In general, ASL can be used to assist in the localization of epileptic lesions or in postoperative reviews, but other tests need to be performed in cases of negative results.
Second, the increase or decrease in the blood flow to epileptic lesions is a matter of controversy. The Online Supplemental Data show that the vascular flow in most lesions mainly decreased in the interictal and postictal periods, especially in patients with structural MR imaging negative for epilepsy. Our results are in agreement with those of previous studies in adults.33⇓-35 An animal study indicated that hypoperfusion could be observed in epileptic lesions for up to 60 minutes after a seizure.36 Clinical research in the same group found that ASL depicted hypoperfusion in >70% of patients within 60 minutes of the end of the seizure, and 80% of these were accurately localized.4
Only one of the included studies reported that hyperperfusion was the predominant alteration in the epileptic lesions (study 2). We carefully analyzed the data and speculated that the patients in this study might have had a high frequency of seizures. The time intervals (immediately to 65 days; average time interval, 101 hours; 39 patients, ≤ 3 days; 5 patients, >3 days) between the seizure episode and electroencephalography and between the seizure episode and ASL (1 hour to 60 days; average time interval, 97 hours; 38 patients ≤ 3 days; 6 patients, > 3 days) were both prolonged in study 2. Moreover, the 2 time intervals were not synchronized, and there was no significant difference between them.
The abnormal discharge time and abnormal perfusion time of the lesion areas were synchronized, unless the patients had frequent seizure attacks. Thus, the 2 examinations were performed at different times, but they found the results during the same period (either during the ictal period or during abnormal brain firing). Hence, the results are consistent, and the time interval is meaningless. Moreover, some hyperperfusion changes were reported by 2 other studies (studies 1 and 6). Most interesting, most patients with hyperperfusion also had frequent seizures and/or abnormal discharges on electroencephalography. Recent animal and clinical studies have shown that the CBF increases during seizures and decreases in the postictal and interictal periods, thus disproving the previously recognized hypoxia-hyperfusion theory.5,37
Thus, we speculated that the blood flow to the lesion area usually increases in the interictal (abnormal neuronal firing but without clinical symptoms) and ictal periods in patients with frequent seizures, while the blood flow decreases in the interictal and postictal periods if the patient's seizure frequency is low. There is a correlation between the perfusion pattern and frequency of seizures (or abnormal brain discharge). This hypothesis is consistent with the findings of other studies.19,38,39
Limitations
First, the inclusion criteria were extremely strict, and only 6 studies were enrolled in the meta-analysis. Most of the included studies had small sample sizes, and their results were limited. Moreover, our results are dependent on the symptomatogenic focus as a standard reference, but the symptomatogenic zone is not easily ascertained in all types of epilepsy (such as insular epilepsy).40 Therefore, our results are only meaningful for epilepsy with symptomatogenic focus localization. In addition, most of the included studies lacked symptomatic patients without epileptogenic lesions in the brain, which led to high heterogeneity in the results of our analysis. This reduced the reliability of the results of the specificity and negative likelihood of the ASL findings. However, the time, place (where the study was conducted), and participants' ages differed among the studies included, and the results of PET and other tests were compared at the same time; hence, the positive results had high reliability. Future meta-analyses should include more studies with epilepsy diagnosed as negative to reduce the heterogeneity. In addition, our study found that the perfusion of the lesion area was closely related to the duration of the seizure episode and seizure pattern, though the exact period could not be judged in many of the included studies. Therefore, future studies should consider the duration and frequency of seizures to better understand the changes in cerebral perfusion using ASL.
Second, ASL is a new diagnostic technology. Thus, there are important differences in the diagnostic accuracy of ASL, which need improvement. For example, the participant's age influences the inflow time between the end of the marker pulse and the image-acquisition time; thus, ASL cannot be quantified among different age groups.16 Manufacturer-related differences in the MR imaging scanners and the lack of a quantitative threshold also affect the accuracy.
CONCLUSIONS
First, our meta-analysis showed that ASL has high sensitivity for the localization of lesions in patients with epilepsy, and the accuracy of the localization is very high for the positive results. Therefore, whether in patients with or without normal brain structure, ASL can be used for the assessment in diagnosis, in protocol, and postoperative review after surgery or other treatments, in association with the other methods currently used.
Second, the changes in the CBF may be closely related to the seizure time and seizure pattern.
Footnotes
J. Zeng and X. Hu shared the first authorship.
References
- Received July 18, 2020.
- Accepted after revision December 15, 2020.
- © 2021 by American Journal of Neuroradiology


Jump to section
Related Articles
Cited By...
- Enhancing the Diagnostic Utility of ASL Imaging in Temporal Lobe Epilepsy through FlowGAN: An ASL to PET Image Translation Framework
- Arterial Spin Labeling Changes Parallel Asymmetric Perisylvian and Perirolandic Symptoms in 3 Pediatric Cases of Anti-NMDAR Encephalitis
- Simultaneously Acquired MRI Arterial Spin-Labeling and Interictal FDG-PET Improves Diagnosis of Pediatric Temporal Lobe Epilepsy